Le forcage solaire utilisé par les simulations
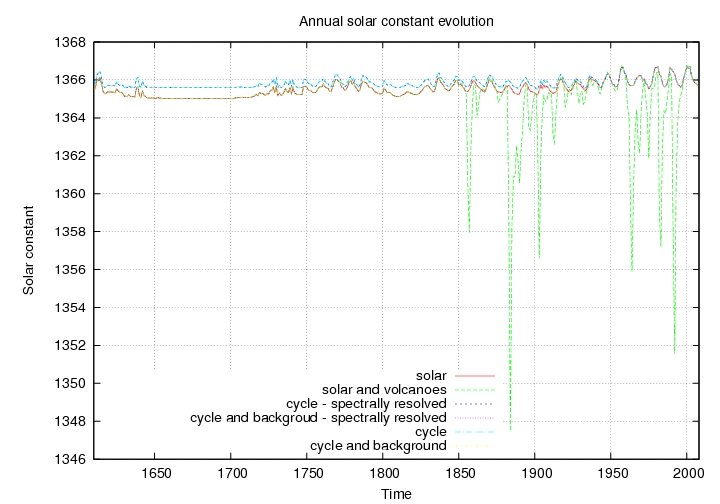
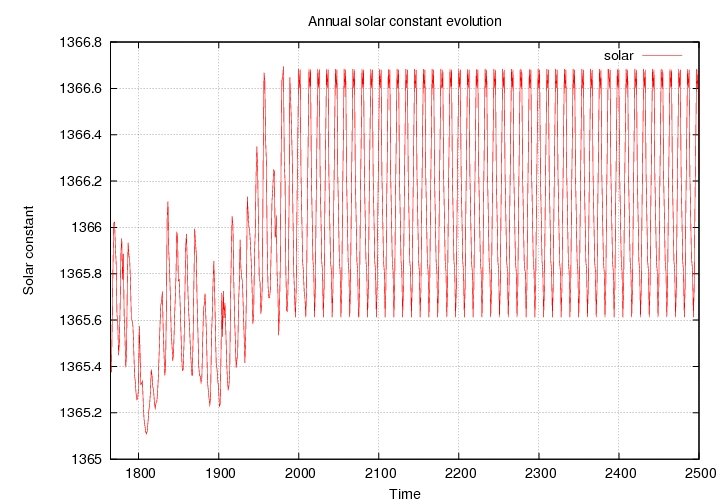
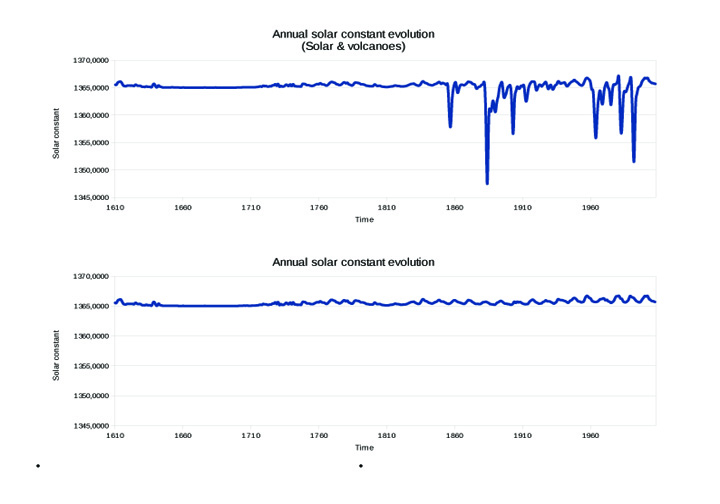
Annual solar constant evolution
Annual solar constant evolution from 1610 to 2008 with solar and volcanoes radiative forcings SOLARANDVOLCANOES_1610_2008.txt

Annual solar constant evolution from 2006 to 2100 with solar radiative forcing only for RCPs SOLAR_2006_2100.txt

What to prescribe in the future?
Repeat the last cycle (cycle 23), with values from 1996 to 2008 inclusive mapping to 2009-2021, 2022-2034 etc. Please note that cycle 23 starts in 1996.4 and ends in 2008.6!!!
There have been some concerns that cycle 23 was unusually long and repeating this special cycle would give out of phase behavior of a normal 11-year solar cycle around 2050. Cycle 23 is actually only 12.2 years long not 13 years since it goes from 1996.4 to 2008.6. In Lean and Rind (2009, GRL, doi:10.1029/2009GL038932) the irradiance was projected forward by just repeating cycle 23. Since it is unknown what the sun will do, there is going to be a lot of uncertainty for future solar irradiance projections. Also the two prior cycles (21 and 22) have been shorter than average - the official times of minima are 1976.5, 1986.8, 1996.4 and now 2008.6 so cycle 21 was only 10.3 years and cycle 22 was 9.6 years - which are not 11 years either! Cycles 21 and 22 have been some of the highest and shortest on record and its quite possible that cycle 23 may be more representative of the future - but of course nobody knows.
More figures/intercomparisons
Annual solar constant evolution from 1610 to 2008

Annual solar constant evolution 1765 up to 2500

For historical experiments
SOLARANDVOLCANOES_1610_2008.txt takes into account solar and aerosols radiative forcings
SOLAR_1610_2008.txt is also available on /dmnfs/cont003/p86ipsl/IGCM/BC/ATM/IPSLCM5A/IPCC_AR5/HISTORIQUE/
Related files
| Radiative forcing/Period | 1610-2008 | 2006-2100 | 1765-2500 | 2006-2500 |
| SOLAR | SOLAR_1610_2008.txt | SOLAR_2006_2100.txt | SOLAR_1765_2500.txt | SOLAR_2006_2500.ods |
| SOLAR and VOLCANOES | SOLARANDVOLCANOES_1610_2008.txt & SOLARANDVOLCANOES_1610_2008.xls | SOLARANDVOLCANOES_2006_2100.ods | ||
Solar forcing used for historical extension
+ pour les simulations RCP standards, on considère qu'à partir du début du scénario (cad 2006) le forçage volcanique est égale au forçage volcanique moyen sur tout le 20è siècle (de même que pour la simulation de contrôle). Si on fait le calcul, on obtient qu'il faut donc ajouter 1.471 (approx 4*0.25/0.69, cf article présentation générale de IPSL-CM5)
+ pour les extensions, on essaye de coller au plus près de ce qui est observé depuis début 2006. On prend les valeurs calculé par Sato et al, comme pour toute la période historique. Ils se trouve que le forçage est quasi-nul depuis 2006
Voici le détail des valeurs à prendre (Solaire Seul+Volcan Seul).
Annee_2006=1365.8107 + 0.949=1366.7597
Annee_2007=1365.7240 + 1.201=1366.925
Annee_2008=1365.6918 + 1.316=1367.0078
Annee_2009=1365.6121 + 1.210=1366.8221
Annee_2010=1365.7399 + 1.413=1367.1529
Annee_2011=1366.1021 + 1.471=1367.5731
Annee_2012=1366.3851 + 1.471=1367.8561
Quick links
(Spectrally resolved irradiance for CMIP5 models Annual resolution TSI file: TSI_WLS_ann_1610_2008.txt)
http://www.pik-potsdam.de/~mmalte/rcps/20c3m.htm
https://forge.ipsl.jussieu.fr/igcmg/changeset/1026/CONFIG/IPSLCM/IPSLCM5A/historical/PARAM
http://forge.ipsl.jussieu.fr/igcmg/wiki/IPSLCMIP5/Centennal/Table3#historical
Attachments (12)
- AnnualSolarConstantEvolution_1610_2008.jpg (53.9 KB) - added by agipsl 13 years ago.
- AnnualSolarConstantEvolutionUpTo2500.jpg (71.5 KB) - added by agipsl 13 years ago.
- SOLARANDVOLCANOES_1610_2008.jpg (630.7 KB) - added by agipsl 13 years ago.
- SOLARANDVOLCANOES_2006_2100.jpg (671.5 KB) - added by agipsl 13 years ago.
- SOLAR_2006_2100.jpg (617.4 KB) - added by agipsl 13 years ago.
- SOLAR_1610_2008.txt (8.2 KB) - added by agipsl 13 years ago.
- SOLAR_1765_2500.txt (15.1 KB) - added by agipsl 13 years ago.
- SOLAR_2006_2100.txt (1.9 KB) - added by agipsl 13 years ago.
- SOLAR_2006_2500.ods (102.3 KB) - added by agipsl 13 years ago.
- SOLARANDVOLCANOES_1610_2008.txt (8.2 KB) - added by agipsl 13 years ago.
- SOLARANDVOLCANOES_1610_2008.xls (54.5 KB) - added by agipsl 13 years ago.
- SOLARANDVOLCANOES_2006_2100.ods (40.8 KB) - added by agipsl 13 years ago.