| Version 56 (modified by msaad, 5 years ago) (diff) |
|---|
= Evaluation of ORCHIDEE for N coumpounds emissions =
Working group
Mohamed Saad, Nicolas Vuichard, Juliette Lathiere, Didier Hauglustaine
Planned work
1-Perform a set of simulations with the ORCHIDEE model to quantify the fluxes of nitrogen compounds (NH3,NOx,N2O) emitted by the soil.
2-Evaluate simulated emissions at national, continental and global scales by comparing them to emissions by other methods such as inventories (eg: EDGAR).
3-Develop the coupling between ORCHIDEE and INCA models in terms of downward (deposition)and upward(emissions) N fluxes.
Team meeting: 06/03/2019
Define the work steps:
- Read some bibliographical references related to the subject of work.
- Start by seeing outputs of a simulation performed by the ORCHIDEE model as part of NMIP (Tian et al., 2018a, b).
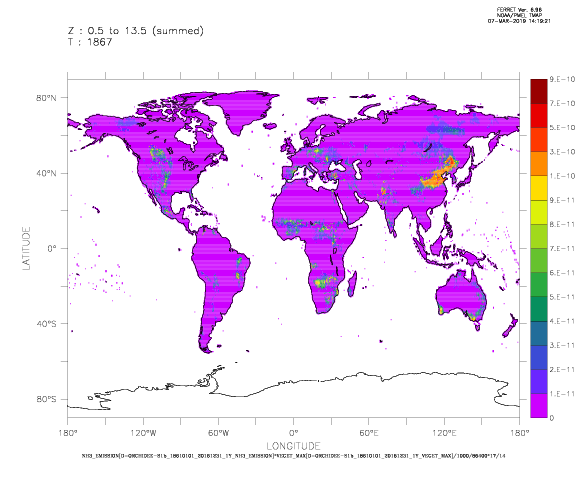
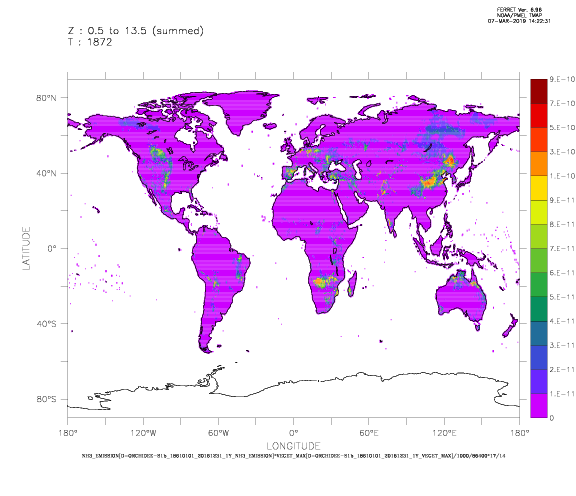
- look at the variable NH3_EMISSION which gives the emissions per m2 of each type of vegetation. It is an information to combine with the file VEGET_MAX which gives us the fraction of mesh occupied by each type of vegetation.
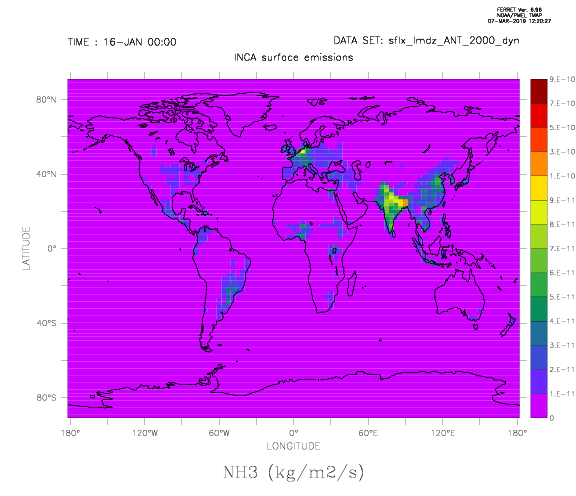
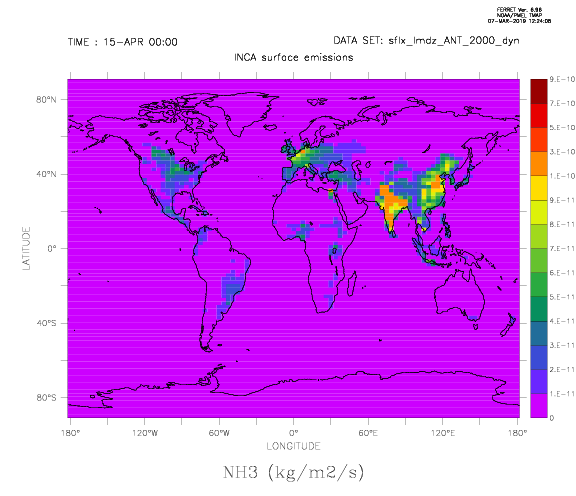
- See the outputs of the NH3 simulations made by INCA to compare them with those of ORCHIDEE.
Team meeting: 13/03/2019
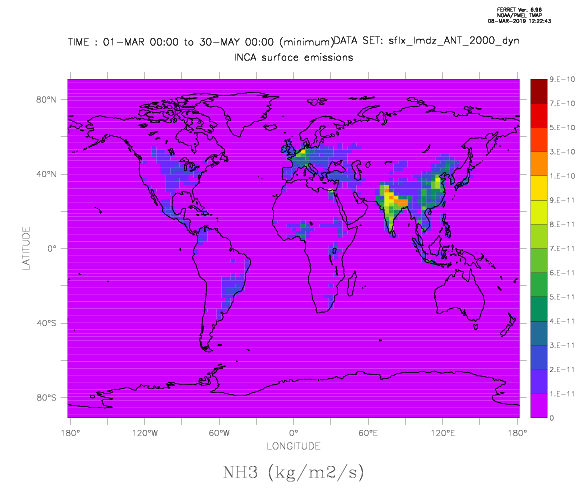
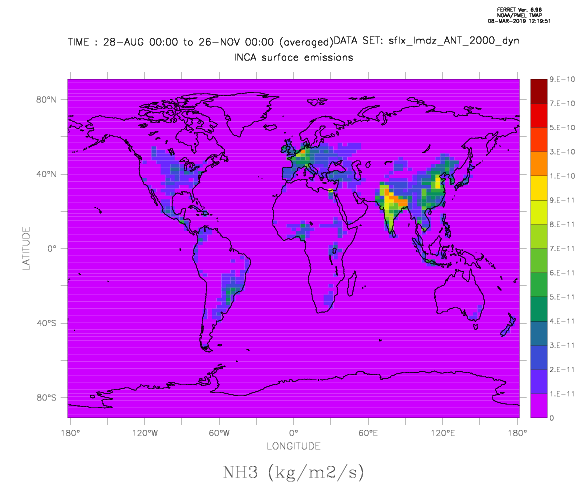
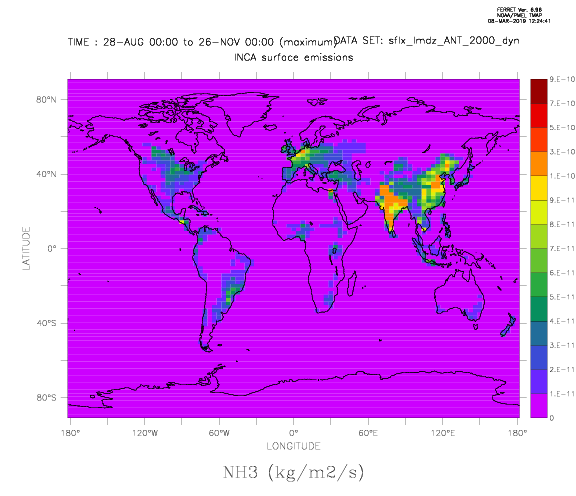
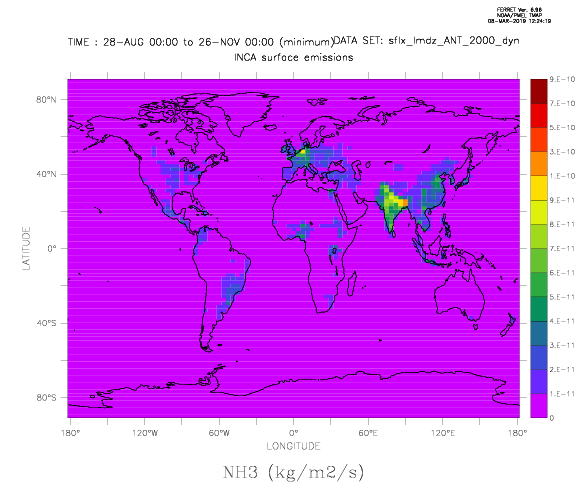
Evaluate the outputs of the NH3 (monthly, seasonal(averaged, maximum, minimum)) simulations of ORCHIDEE (2016) and INCA.
 Emissions of NH3 simulated by ORCHIDEE model for the month of January 2016. Emissions of NH3 simulated by ORCHIDEE model for the month of January 2016. |  Emissions of NH3 simulated by ORCHIDEE model for the month of February 2016. Emissions of NH3 simulated by ORCHIDEE model for the month of February 2016. |  Emissions of NH3 simulated by ORCHIDEE model for the month of March 2016. Emissions of NH3 simulated by ORCHIDEE model for the month of March 2016.
|
 Emissions of NH3 simulated by ORCHIDEE model for the month of April 2016. Emissions of NH3 simulated by ORCHIDEE model for the month of April 2016. |  Emissions of NH3 simulated by ORCHIDEE model for the month of May 2016. Emissions of NH3 simulated by ORCHIDEE model for the month of May 2016. |  Emissions of NH3 simulated by ORCHIDEE model for the month of June 2016. Emissions of NH3 simulated by ORCHIDEE model for the month of June 2016.
|
 Emissions of NH3 simulated by ORCHIDEE model for the month of July 2016. Emissions of NH3 simulated by ORCHIDEE model for the month of July 2016. |  Emissions of NH3 simulated by ORCHIDEE model for the month of August 2016. Emissions of NH3 simulated by ORCHIDEE model for the month of August 2016. |  Emissions of NH3 simulated by ORCHIDEE model for the month of September 2016. Emissions of NH3 simulated by ORCHIDEE model for the month of September 2016.
|
 Emissions of NH3 simulated by ORCHIDEE model for the month of October 2016. Emissions of NH3 simulated by ORCHIDEE model for the month of October 2016. |  Emissions of NH3 simulated by ORCHIDEE model for the month of November 2016. Emissions of NH3 simulated by ORCHIDEE model for the month of November 2016. |  Emissions of NH3 simulated by ORCHIDEE model for the month of December 2016. Emissions of NH3 simulated by ORCHIDEE model for the month of December 2016.
|

Averaged emissions of NH3 simulated by ORCHIDEE model for the winter season of 2016.

Maximum emissions of NH3 simulated by ORCHIDEE model for winter season of 2016.

Minimum emissions of NH3 simulated by ORCHIDEE model for the winter season of 2016.

Averaged emissions of NH3 simulated by ORCHIDEE model for the spring season of 2016.

Minimum emissions of NH3 simulated by ORCHIDEE model for the spring season of 2016.

Averaged emissions of NH3 simulated by ORCHIDEE model for the summer season of 2016.

Maximum emissions of NH3 simulated by ORCHIDEE model for the summer season of 2016.

Minimum emissions of NH3 simulated by ORCHIDEE model for the summer season of 2016.

Averaged emissions of NH3 simulated by ORCHIDEE model for the autumn season of 2016.

Maximum emissions of NH3 simulated by ORCHIDEE model for the autumn season of 2016.
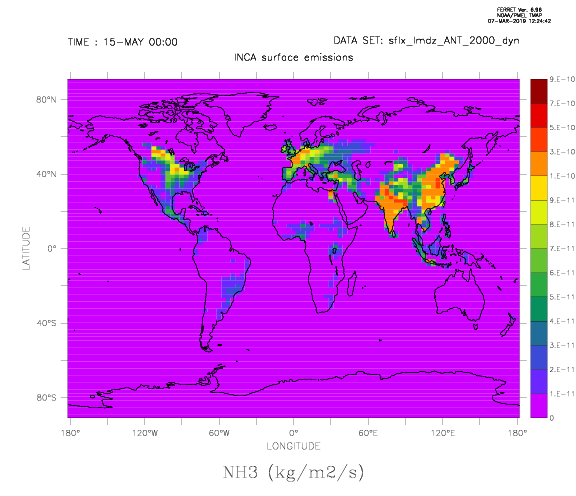
 Emissions of NH3 simulated by INCA for the month of January. Emissions of NH3 simulated by INCA for the month of January. |  Emissions of NH3 simulated by INCA for the month of February. Emissions of NH3 simulated by INCA for the month of February. |  Emissions of NH3 simulated by INCA for the month of March. Emissions of NH3 simulated by INCA for the month of March.
|
 Emissions of NH3 simulated by INCA for the month of April. Emissions of NH3 simulated by INCA for the month of April. |  Emissions of NH3 simulated by INCA for the month of May. Emissions of NH3 simulated by INCA for the month of May. |  Emissions of NH3 simulated by INCA for the month of June. Emissions of NH3 simulated by INCA for the month of June.
|
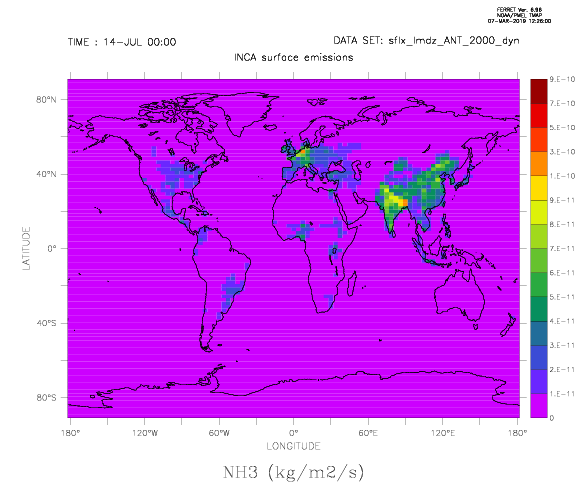
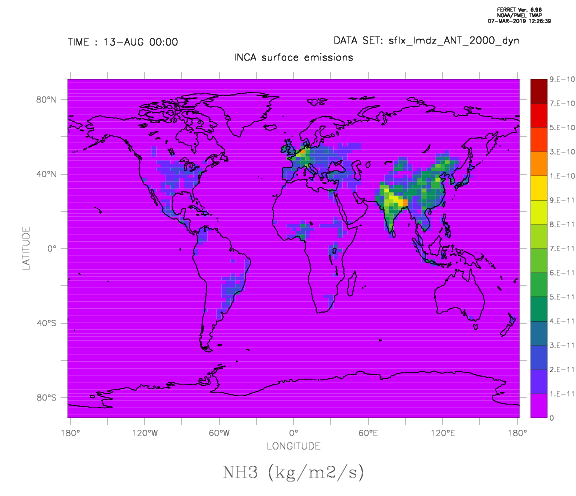
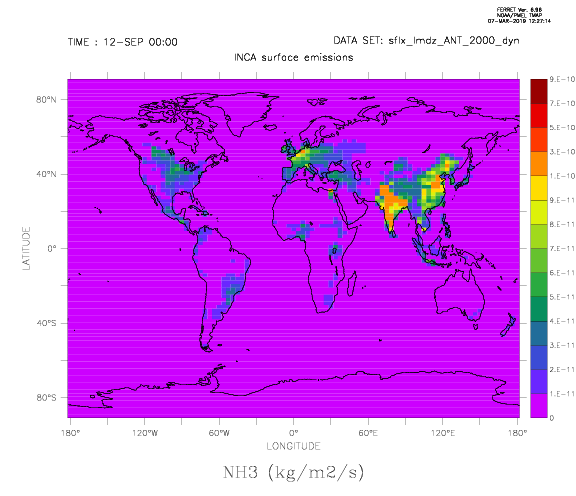
 Emissions of NH3 simulated by INCA for the month of July. Emissions of NH3 simulated by INCA for the month of July. |  Emissions of NH3 simulated by INCA for the month of August. Emissions of NH3 simulated by INCA for the month of August. |  Emissions of NH3 simulated by INCA for the month of September. Emissions of NH3 simulated by INCA for the month of September.
|
 Emissions of NH3 simulated by INCA for the month of October. Emissions of NH3 simulated by INCA for the month of October. |  Emissions of NH3 simulated by INCA for the month of November. Emissions of NH3 simulated by INCA for the month of November. |  Emissions of NH3 simulated by INCA for the month of December. Emissions of NH3 simulated by INCA for the month of December.
|
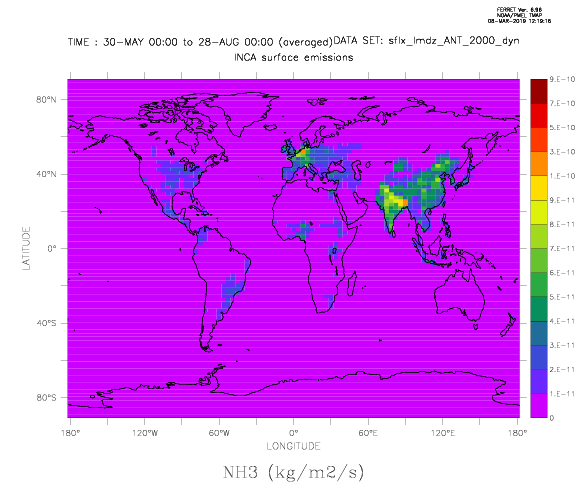
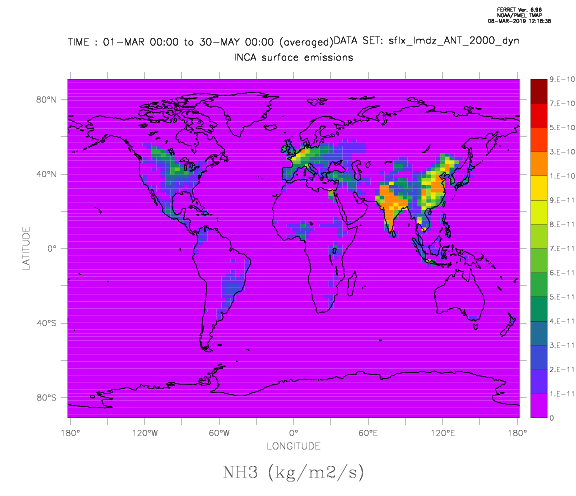
 Averaged emissions of NH3 simulated by INCA for the spring season. Averaged emissions of NH3 simulated by INCA for the spring season. |  Averaged emissions of NH3 simulated by INCA for the summer season. Averaged emissions of NH3 simulated by INCA for the summer season. |  Averaged emissions of NH3 simulated by INCA for the autumn season. Averaged emissions of NH3 simulated by INCA for the autumn season.
|
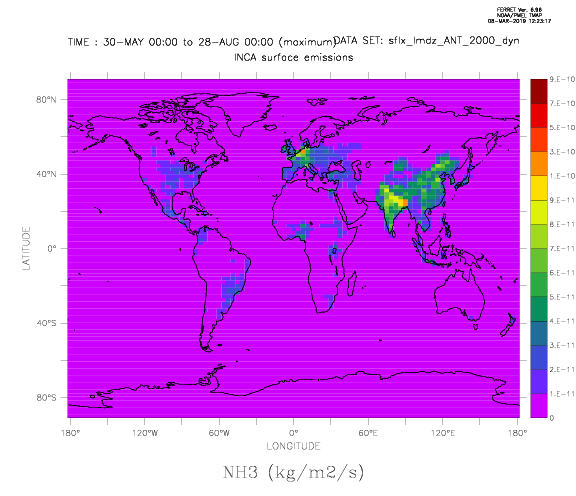
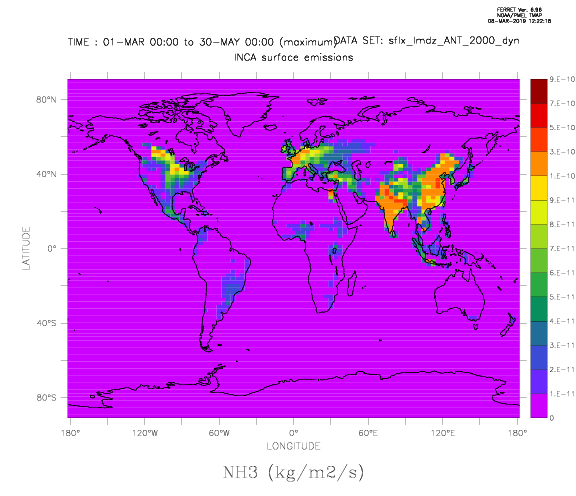
 Maximum emissions of NH3 simulated by INCA for the spring season. Maximum emissions of NH3 simulated by INCA for the spring season. |  Maximum emissions of NH3 simulated by INCA for the summer season. Maximum emissions of NH3 simulated by INCA for the summer season. |  Maximum emissions of NH3 simulated by INCA for the autumn season. Maximum emissions of NH3 simulated by INCA for the autumn season.
|
 Minimum emissions of NH3 simulated by INCA for the spring season. Minimum emissions of NH3 simulated by INCA for the spring season. |  Minimum emissions of NH3 simulated by INCA for the summer season. Minimum emissions of NH3 simulated by INCA for the summer season. |  Minimum emissions of NH3 simulated by INCA for the autumn season. Minimum emissions of NH3 simulated by INCA for the autumn season.
|
What is the temporal variability of the emissions of NH3 mainly for the months of May and September?
Recommendations
- include the global balances of the emissions of NH3 for ORCHIDEE and INCA for the period of 2000-2014.
Team meeting: 20/03/2019

Global balances of the emissions of NH3 for ORCHIDEE (black) and INCA (red) for the period of 2000-2014.
What is the origin of this difference between the global balances of the emissions of NH3.
Recommendations
- Focus on NH3 emissions from the agricultural sector for INCA.
- See references and inventories.
- Compare the emissions of NH3 for INCA with those of the EDGAR inventory.
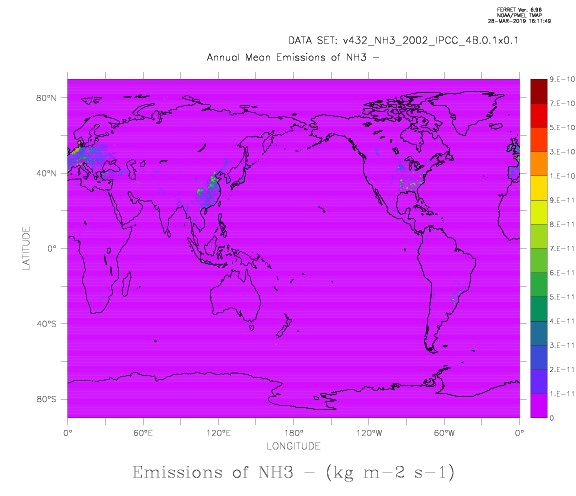
Team meeting: 27/03/2019
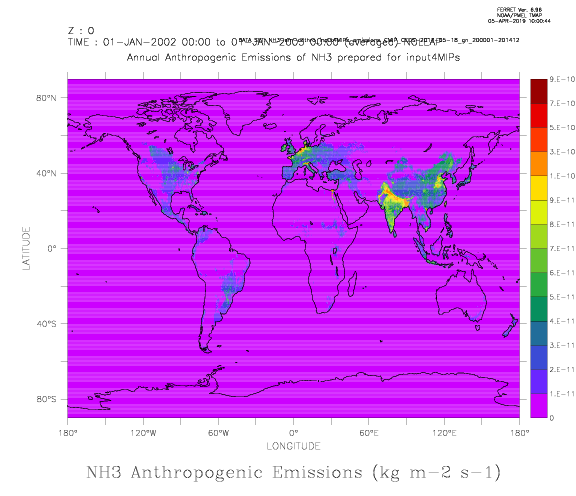
 Annual emissions of NH3 for INCA from the agricultural sector for the year 2000. Annual emissions of NH3 for INCA from the agricultural sector for the year 2000. |  Annual emissions of NH3 for INCA from the agricultural sector for the year 2001. Annual emissions of NH3 for INCA from the agricultural sector for the year 2001. |  Annual emissions of NH3 for INCA from the agricultural sector for the year 2002. Annual emissions of NH3 for INCA from the agricultural sector for the year 2002.
|
 Annual emissions of NH3 for INCA from the agricultural sector for the year 2003. Annual emissions of NH3 for INCA from the agricultural sector for the year 2003. |  Annual emissions of NH3 for INCA from the agricultural sector for the year 2004. Annual emissions of NH3 for INCA from the agricultural sector for the year 2004. |  Annual emissions of NH3 for INCA from the agricultural sector for the year 2005. Annual emissions of NH3 for INCA from the agricultural sector for the year 2005.
|
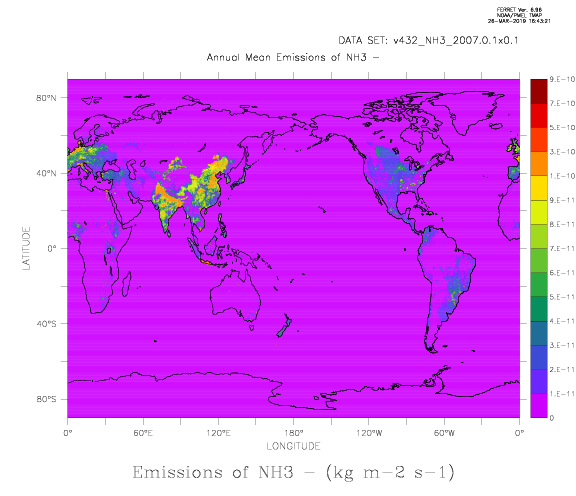
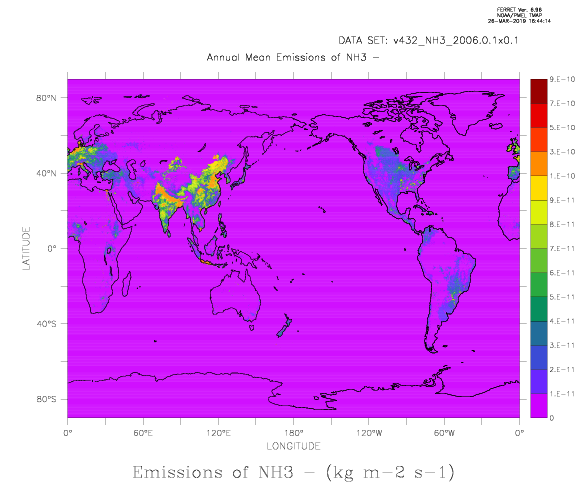
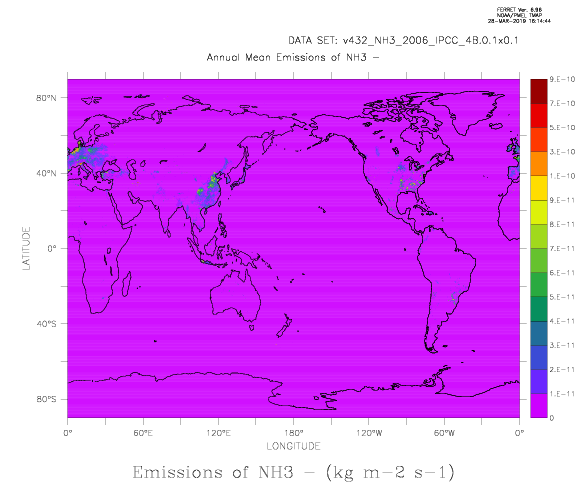
 Annual emissions of NH3 for INCA from the agricultural sector for the year 2006. Annual emissions of NH3 for INCA from the agricultural sector for the year 2006. |  Annual emissions of NH3 for INCA from the agricultural sector for the year 2007. Annual emissions of NH3 for INCA from the agricultural sector for the year 2007. |  Annual emissions of NH3 for INCA from the agricultural sector for the year 2008. Annual emissions of NH3 for INCA from the agricultural sector for the year 2008.
|
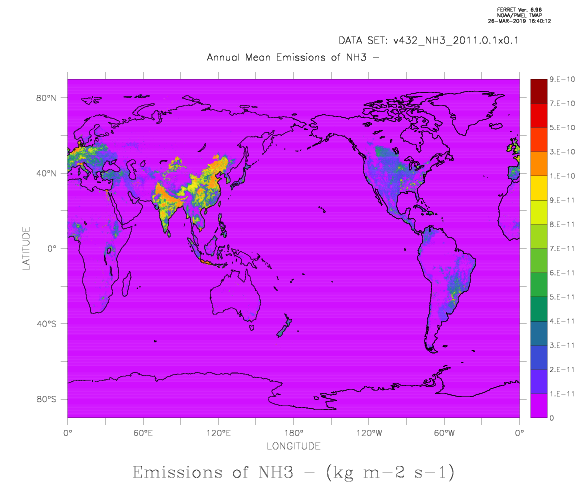
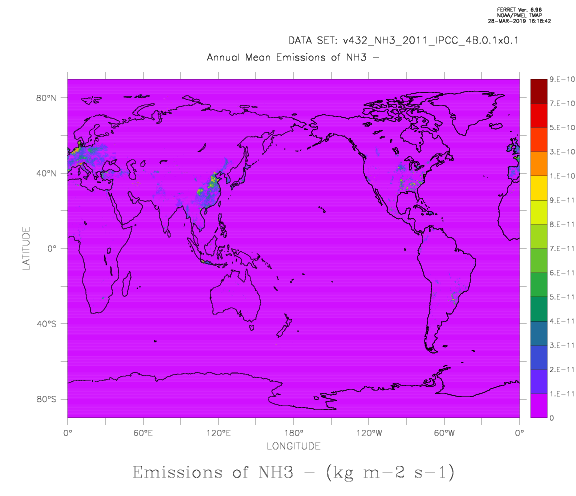
 Annual emissions of NH3 for INCA from the agricultural sector for the year 2009. Annual emissions of NH3 for INCA from the agricultural sector for the year 2009. |  Annual emissions of NH3 for INCA from the agricultural sector for the year 2010. Annual emissions of NH3 for INCA from the agricultural sector for the year 2010. |  Annual emissions of NH3 for INCA from the agricultural sector for the year 2011. Annual emissions of NH3 for INCA from the agricultural sector for the year 2011.
|
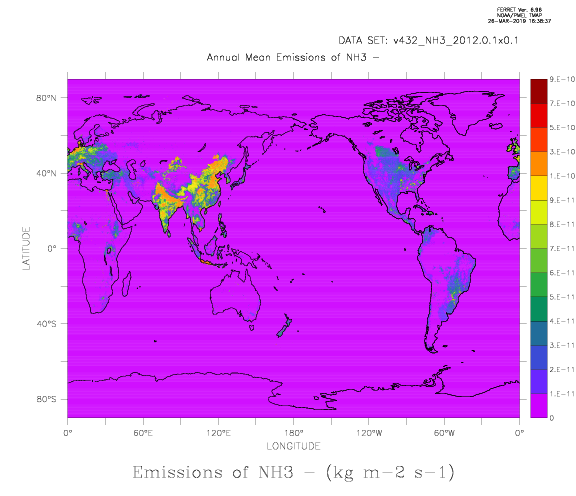
 Annual emissions of NH3 for INCA from the agricultural sector for the year 2012. Annual emissions of NH3 for INCA from the agricultural sector for the year 2012.
|
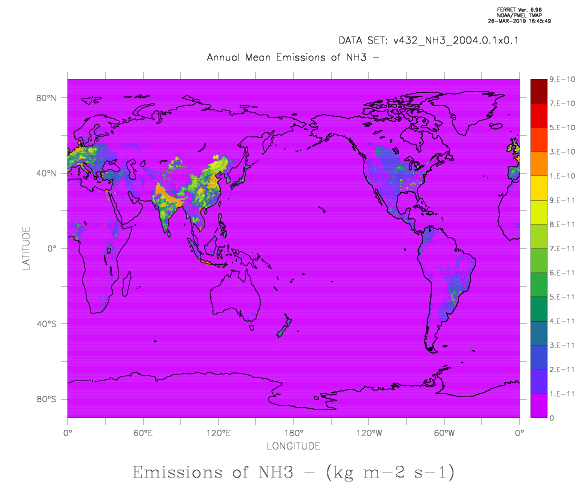
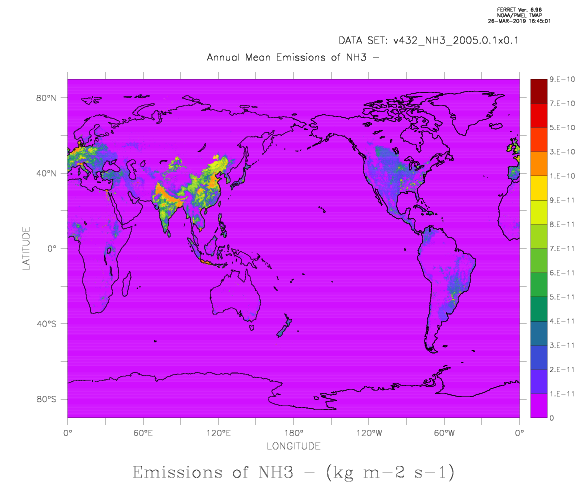
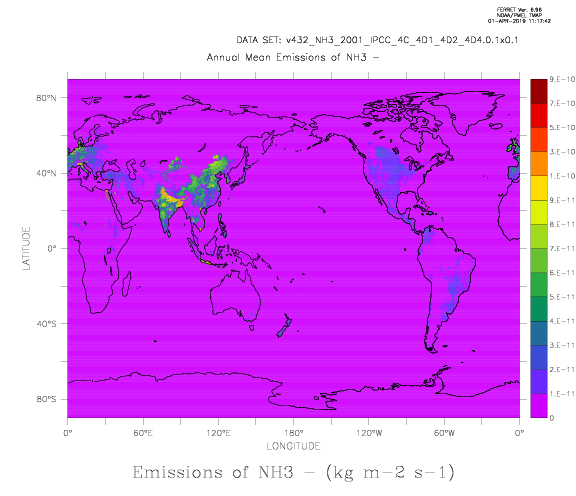
 Annual emissions of NH3 for EDGAR inventory for the year 2000. Annual emissions of NH3 for EDGAR inventory for the year 2000. |  Annual emissions of NH3 for EDGAR inventory for the year 2001. Annual emissions of NH3 for EDGAR inventory for the year 2001. |  Annual emissions of NH3 for EDGAR inventory for the year 2002. Annual emissions of NH3 for EDGAR inventory for the year 2002.
|
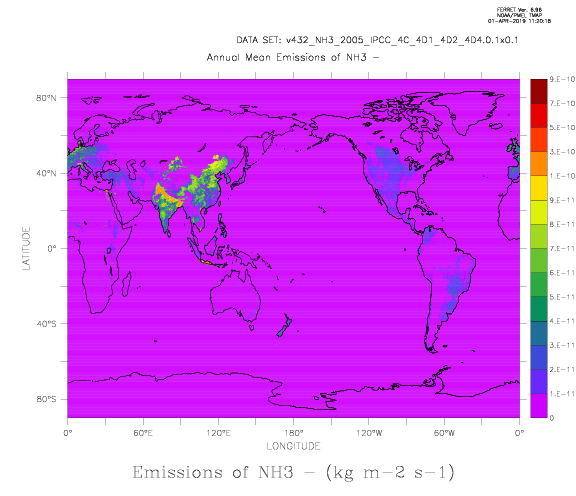
 Annual emissions of NH3 for EDGAR inventory for the year 2003. Annual emissions of NH3 for EDGAR inventory for the year 2003. |  Annual emissions of NH3 for EDGAR inventory for the year 2004. Annual emissions of NH3 for EDGAR inventory for the year 2004. |  Annual emissions of NH3 for EDGAR inventory for the year 2005. Annual emissions of NH3 for EDGAR inventory for the year 2005.
|
 Annual emissions of NH3 for EDGAR inventory for the year 2006. Annual emissions of NH3 for EDGAR inventory for the year 2006. |  Annual emissions of NH3 for EDGAR inventory for the year 2007. Annual emissions of NH3 for EDGAR inventory for the year 2007. |  Annual emissions of NH3 for EDGAR inventory for the year 2008. Annual emissions of NH3 for EDGAR inventory for the year 2008.
|
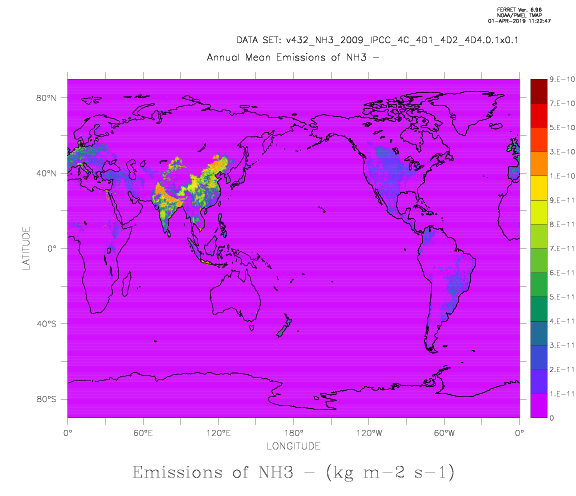
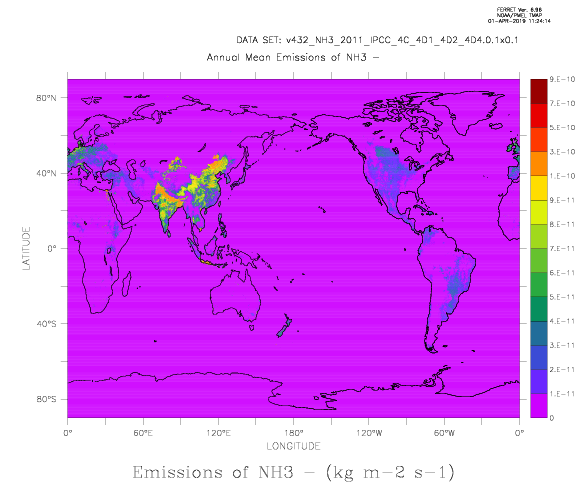
 Annual emissions of NH3 for EDGAR inventory for the year 2009. Annual emissions of NH3 for EDGAR inventory for the year 2009. |  Annual emissions of NH3 for EDGAR inventory for the year 2010. Annual emissions of NH3 for EDGAR inventory for the year 2010. |  Annual emissions of NH3 for EDGAR inventory for the year 2011. Annual emissions of NH3 for EDGAR inventory for the year 2011.
|
 Annual emissions of NH3 for EDGAR inventory for the year 2012. Annual emissions of NH3 for EDGAR inventory for the year 2012.
|
What are the different sources that contribute to emissions from the agricultural sector for EDGAR inventory.
Recommendations
- Focus on NH3 emissions from the agricultural sector for EDGAR inventory.
Team meeting: 03/04/2019
The important sources for which the EDGAR inventory accounts for the agricultural sector are:
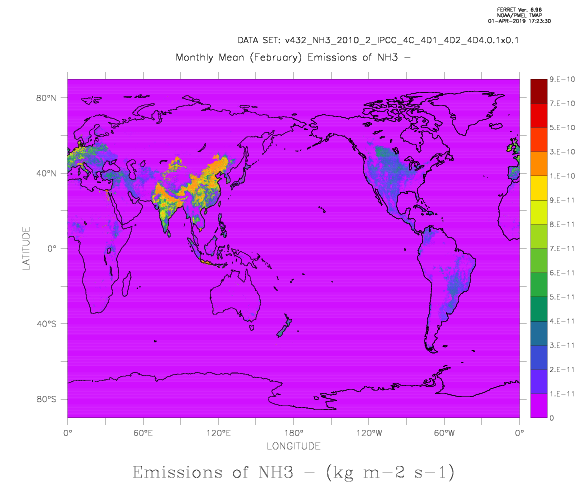
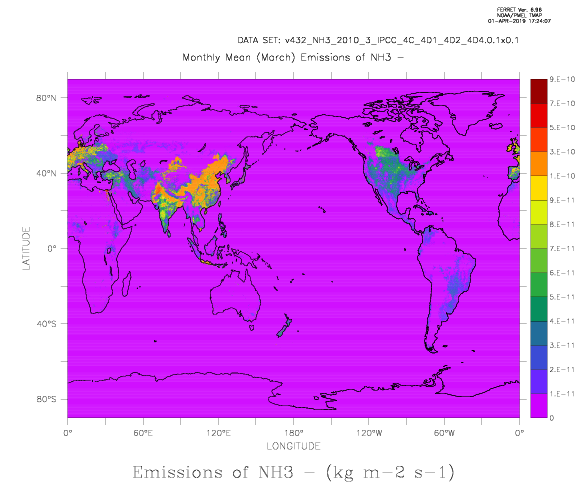
- Agricultural Soil: 4C + 4D
- Manure Management: 4B
- Agricultural Waste BURNING: 4F
 Annual emissions of NH3 from agricultural soil for EDGAR inventory for the year 2000. Annual emissions of NH3 from agricultural soil for EDGAR inventory for the year 2000. |  Annual emissions of NH3 from agricultural soil for EDGAR inventory for the year 2001. Annual emissions of NH3 from agricultural soil for EDGAR inventory for the year 2001. |  Annual emissions of NH3 from agricultural soil for EDGAR inventory for the year 2002. Annual emissions of NH3 from agricultural soil for EDGAR inventory for the year 2002.
|
 Annual emissions of NH3 from agricultural soil for EDGAR inventory for the year 2003. Annual emissions of NH3 from agricultural soil for EDGAR inventory for the year 2003. |  Annual emissions of NH3 from agricultural soil for EDGAR inventory for the year 2004. Annual emissions of NH3 from agricultural soil for EDGAR inventory for the year 2004.
| |
 Annual emissions of NH3 from agricultural soil for EDGAR inventory for the year 2006. Annual emissions of NH3 from agricultural soil for EDGAR inventory for the year 2006.
| ||
 Annual emissions of NH3 from agricultural soil for EDGAR inventory for the year 2009. Annual emissions of NH3 from agricultural soil for EDGAR inventory for the year 2009.
| ||
 Annual emissions of NH3 from agricultural soil for EDGAR inventory for the year 2012. Annual emissions of NH3 from agricultural soil for EDGAR inventory for the year 2012.
|


 Annual emissions of NH3 from manure management for EDGAR inventory for the year 2000. Annual emissions of NH3 from manure management for EDGAR inventory for the year 2000. |  Annual emissions of NH3 from manure management for EDGAR inventory for the year 2001. Annual emissions of NH3 from manure management for EDGAR inventory for the year 2001.
| |
 Annual emissions of NH3 from manure management for EDGAR inventory for the year 2003. Annual emissions of NH3 from manure management for EDGAR inventory for the year 2003. |  Annual emissions of NH3 from manure management for EDGAR inventory for the year 2004. Annual emissions of NH3 from manure management for EDGAR inventory for the year 2004. |  Annual emissions of NH3 from manure management for EDGAR inventory for the year 2005. Annual emissions of NH3 from manure management for EDGAR inventory for the year 2005.
|
 Annual emissions of NH3 from manure management for EDGAR inventory for the year 2006. Annual emissions of NH3 from manure management for EDGAR inventory for the year 2006. |  Annual emissions of NH3 from manure management for EDGAR inventory for the year 2007. Annual emissions of NH3 from manure management for EDGAR inventory for the year 2007. |  Annual emissions of NH3 from manure management for EDGAR inventory for the year 2008. Annual emissions of NH3 from manure management for EDGAR inventory for the year 2008.
|
 Annual emissions of NH3 from manure management for EDGAR inventory for the year 2009. Annual emissions of NH3 from manure management for EDGAR inventory for the year 2009. |  Annual emissions of NH3 from manure management for EDGAR inventory for the year 2010. Annual emissions of NH3 from manure management for EDGAR inventory for the year 2010. |  Annual emissions of NH3 from manure management for EDGAR inventory for the year 2011. Annual emissions of NH3 from manure management for EDGAR inventory for the year 2011.
|
 Annual emissions of NH3 from manure management for EDGAR inventory for the year 2012. Annual emissions of NH3 from manure management for EDGAR inventory for the year 2012.
|
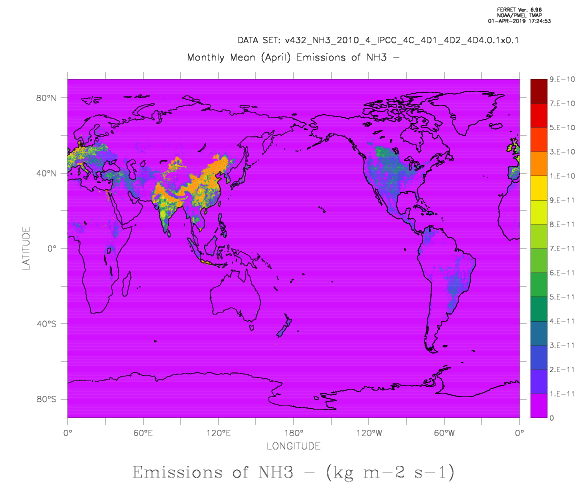
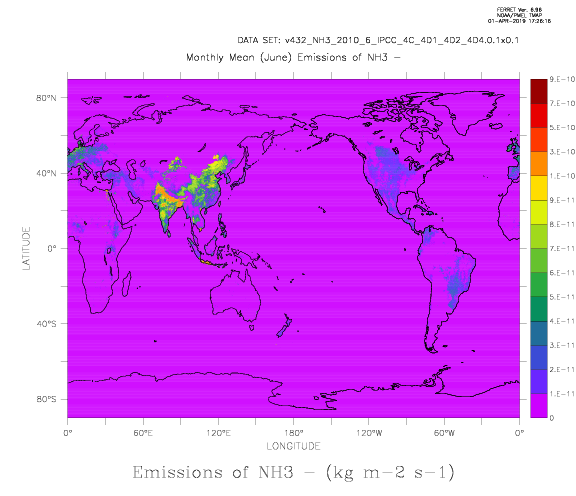
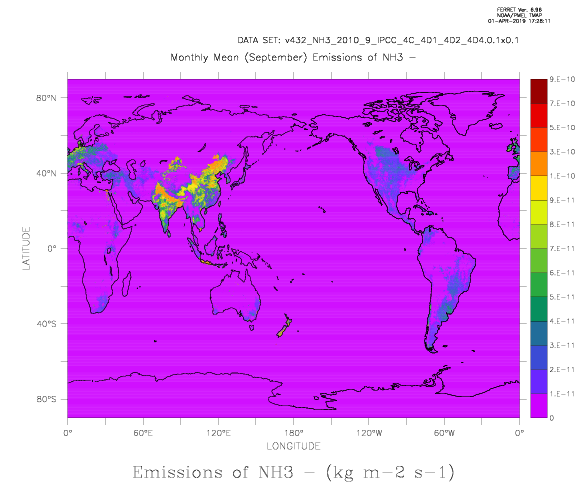
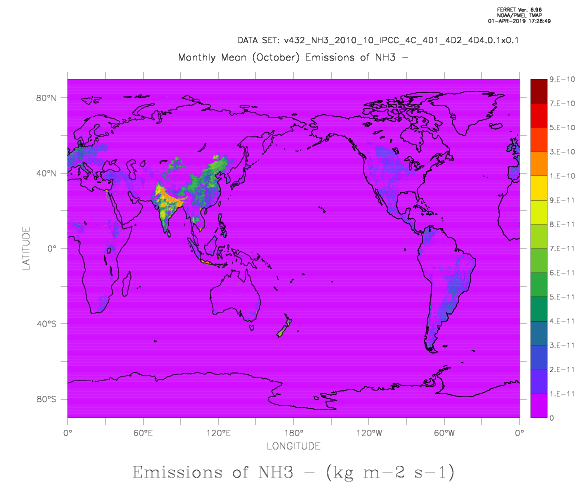
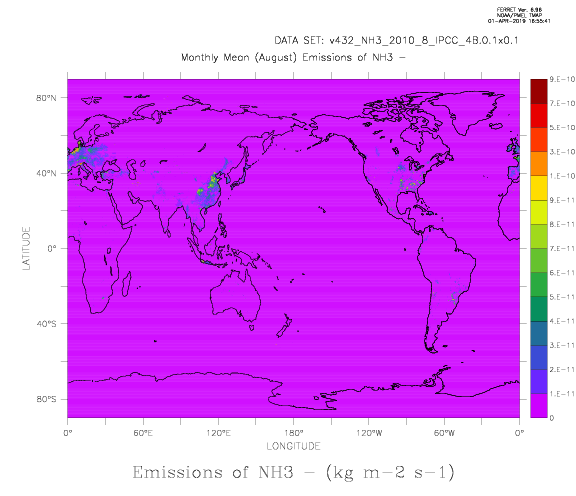
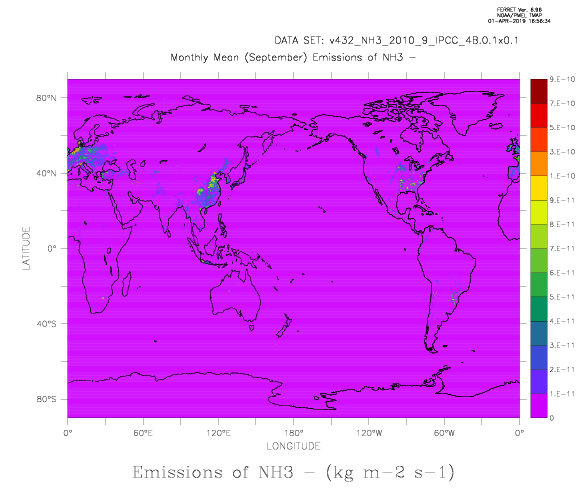
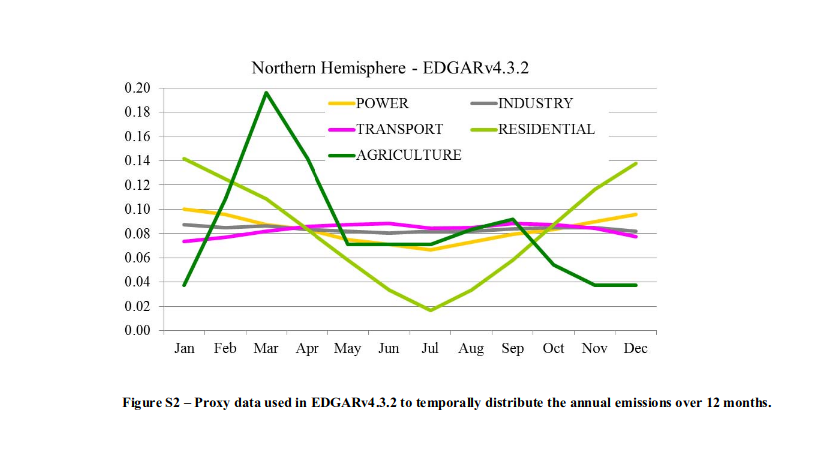
what is the monthly variability of nh3 emissions from agricultural soil and manure management for EDGAR inventory.
The monthly data available for agricultural soil and manure management are for the year 2010.

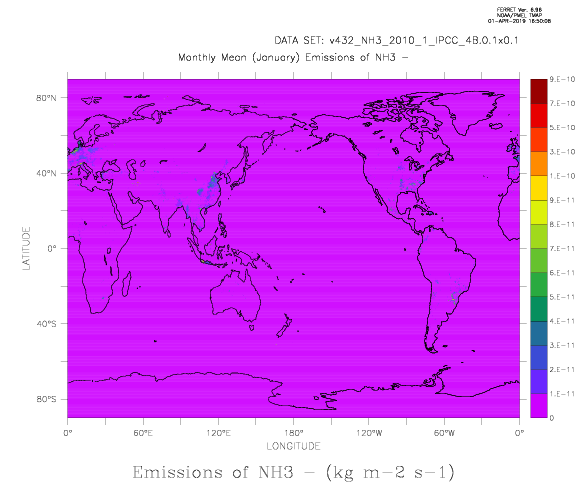
Monthly change in NH3 emissions from agricultural soil for the EDGAR inventory for January 2010.

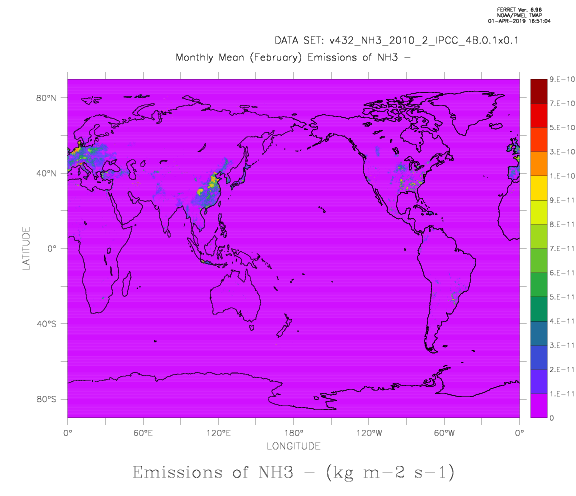
Monthly change in NH3 emissions from agricultural soil for the EDGAR inventory for February 2010.

Monthly change in NH3 emissions from agricultural soil for the EDGAR inventory for March 2010.

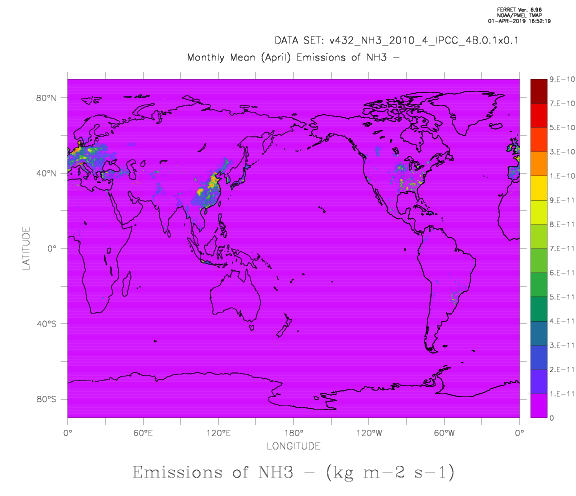
Monthly change in NH3 emissions from agricultural soil for the EDGAR inventory for April 2010.

Monthly change in NH3 emissions from agricultural soil for the EDGAR inventory for May 2010.

Monthly change in NH3 emissions from agricultural soil for the EDGAR inventory for June 2010.

Monthly change in NH3 emissions from agricultural soil for the EDGAR inventory for July 2010.

Monthly change in NH3 emissions from agricultural soil for the EDGAR inventory for August 2010.

Monthly change in NH3 emissions from agricultural soil for the EDGAR inventory for September 2010.

Monthly change in NH3 emissions from agricultural soil for the EDGAR inventory for October 2010.

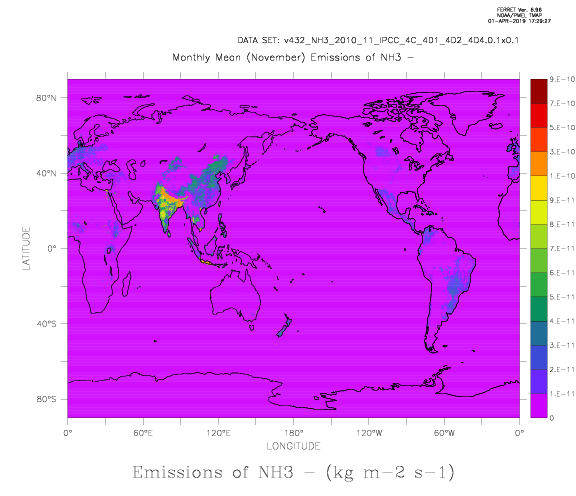
Monthly change in NH3 emissions from agricultural soil for the EDGAR inventory for November 2010.

Monthly change in NH3 emissions from agricultural soil for the EDGAR inventory for December 2010.

Monthly change in NH3 emissions from manure management for the EDGAR inventory for January 2010.

Monthly change in NH3 emissions from manure management for the EDGAR inventory for February 2010.

Monthly change in NH3 emissions from manure management for the EDGAR inventory for March 2010.

Monthly change in NH3 emissions from manure management for the EDGAR inventory for April 2010.

Monthly change in NH3 emissions from manure management for the EDGAR inventory for May 2010.

Monthly change in NH3 emissions from manure management for the EDGAR inventory for June 2010.

Monthly change in NH3 emissions from manure management for the EDGAR inventory for July 2010.

Monthly change in NH3 emissions from manure management for the EDGAR inventory for August 2010.

Monthly change in NH3 emissions from manure management for the EDGAR inventory for September 2010.

Monthly change in NH3 emissions from manure management for the EDGAR inventory for October 2010.

Monthly change in NH3 emissions from manure management for the EDGAR inventory for November 2010.

Monthly change in NH3 emissions from manure management for the EDGAR inventory for December 2010.

Attachments (444)
- NH3_EMISSION_JANVIER.png (104.5 KB) - added by msaad 5 years ago.
- NH3_EMISSION_FEVRIER.png (104.1 KB) - added by msaad 5 years ago.
- NH3_EMISSION_MARS.png (103.9 KB) - added by msaad 5 years ago.
- NH3_EMISSION_AVRIL.png (102.3 KB) - added by msaad 5 years ago.
- NH3_EMISSION_MAI.png (100.5 KB) - added by msaad 5 years ago.
- NH3_EMISSION_JUIN.png (99.4 KB) - added by msaad 5 years ago.
- NH3_EMISSION_JUILLET.png (99.8 KB) - added by msaad 5 years ago.
- NH3_EMISSION_AOUT.png (100.8 KB) - added by msaad 5 years ago.
- NH3_EMISSION_SEPTEMBRE.png (101.0 KB) - added by msaad 5 years ago.
- NH3_EMISSION_OCTOBRE.png (101.4 KB) - added by msaad 5 years ago.
- NH3_EMISSION_NOVEMBRE.png (101.9 KB) - added by msaad 5 years ago.
- NH3_EMISSION_DECEMBRE.png (102.6 KB) - added by msaad 5 years ago.
- NH3_EMISSION_HIVER.png (105.5 KB) - added by msaad 5 years ago.
- NH3_EMISSION_HIVER_MAX.png (108.9 KB) - added by msaad 5 years ago.
- NH3_EMISSION_HIVER_MIN.png (101.0 KB) - added by msaad 5 years ago.
- NH3_EMISSION_PRINTEMPS_MIN.png (98.2 KB) - added by msaad 5 years ago.
- NH3_EMISSION_ETE.png (101.5 KB) - added by msaad 5 years ago.
- NH3_EMISSION_ETE_MAX.png (106.0 KB) - added by msaad 5 years ago.
- NH3_EMISSION_ETE_MIN.png (94.5 KB) - added by msaad 5 years ago.
- NH3_EMISSION_AUTOMNE.png (102.4 KB) - added by msaad 5 years ago.
- NH3_EMISSION_AUTOMNE_MAX.png (105.7 KB) - added by msaad 5 years ago.
- NH3_EMISSION_AUTOMNE_MIN.png (98.3 KB) - added by msaad 5 years ago.
- NH3_EMISSION_PRINTEMPS.png (102.9 KB) - added by msaad 5 years ago.
- FLX_NH3_JANVIER.png (59.6 KB) - added by msaad 5 years ago.
- FLX_NH3_FEVRIER.png (60.1 KB) - added by msaad 5 years ago.
- FLX_NH3_MARS.png (60.4 KB) - added by msaad 5 years ago.
- FLX_NH3_AVRIL.png (62.4 KB) - added by msaad 5 years ago.
- FLX_NH3_MAI.png (64.3 KB) - added by msaad 5 years ago.
- FLX_NH3_JUIN.png (60.9 KB) - added by msaad 5 years ago.
- FLX_NH3_JUILLET.png (60.8 KB) - added by msaad 5 years ago.
- FLX_NH3_AOUT.png (61.1 KB) - added by msaad 5 years ago.
- FLX_NH3_SEPTEMBRE.png (63.1 KB) - added by msaad 5 years ago.
- FLX_NH3_OCTOBRE.png (61.7 KB) - added by msaad 5 years ago.
- FLX_NH3_NOVEMBRE.png (59.6 KB) - added by msaad 5 years ago.
- FLX_NH3_DECEMBRE.png (59.6 KB) - added by msaad 5 years ago.
- FLX_NH3_ETE.png (61.7 KB) - added by msaad 5 years ago.
- FLX_NH3_ETE_MAX.png (61.9 KB) - added by msaad 5 years ago.
- FLX_NH3_ETE_MIN.png (61.5 KB) - added by msaad 5 years ago.
- FLX_NH3_PRINTEMPS.png (63.7 KB) - added by msaad 5 years ago.
- FLX_NH3_PRINTEMPS_MAX.png (65.1 KB) - added by msaad 5 years ago.
- FLX_NH3_PRINTEMPS_MIN.png (60.8 KB) - added by msaad 5 years ago.
- FLX_NH3_AUTOMNE.png (62.6 KB) - added by msaad 5 years ago.
- FLX_NH3_AUTOMNE_MAX.png (65.0 KB) - added by msaad 5 years ago.
- FLX_NH3_AUTOMNE_MIN.png (60.2 KB) - added by msaad 5 years ago.
- bilan_globe_2000_2014_ceds_orc.gif (5.8 KB) - added by msaad 5 years ago.
- NH3_EM_ANTHRO_2000_Moyenne.png (92.6 KB) - added by msaad 5 years ago.
- NH3_EM_ANTHRO_2001_Moyenne.png (92.8 KB) - added by msaad 5 years ago.
- NH3_EM_ANTHRO_2002_Moyenne.png (93.8 KB) - added by msaad 5 years ago.
- NH3_EM_ANTHRO_2003_Moyenne.png (94.2 KB) - added by msaad 5 years ago.
- NH3_EM_ANTHRO_2004_Moyenne.png (94.5 KB) - added by msaad 5 years ago.
- NH3_EM_ANTHRO_2005_Moyenne.png (94.5 KB) - added by msaad 5 years ago.
- NH3_EM_ANTHRO_2006_Moyenne.png (94.8 KB) - added by msaad 5 years ago.
- NH3_EM_ANTHRO_2007_Moyenne.png (95.2 KB) - added by msaad 5 years ago.
- NH3_EM_ANTHRO_2008_Moyenne.png (95.4 KB) - added by msaad 5 years ago.
- NH3_EM_ANTHRO_2009_Moyenne.png (95.5 KB) - added by msaad 5 years ago.
- NH3_EM_ANTHRO_2010_Moyenne.png (95.4 KB) - added by msaad 5 years ago.
- NH3_EM_ANTHRO_2011_Moyenne.png (95.6 KB) - added by msaad 5 years ago.
- Emissions de NH3_EDGAR_2000.png (110.3 KB) - added by msaad 5 years ago.
- Emissions de NH3_EDGAR_2003.png (110.8 KB) - added by msaad 5 years ago.
- Emissions de NH3_EDGAR_2004.png (111.1 KB) - added by msaad 5 years ago.
- Emissions de NH3_EDGAR_2005.png (111.0 KB) - added by msaad 5 years ago.
- Emissions de NH3_EDGAR_2007.png (111.5 KB) - added by msaad 5 years ago.
- Emissions de NH3_EDGAR_2009.png (111.6 KB) - added by msaad 5 years ago.
- Emissions de NH3_EDGAR_2008.png (111.6 KB) - added by msaad 5 years ago.
- Emissions de NH3_EDGAR_2012.png (112.2 KB) - added by msaad 5 years ago.
- Emissions de NH3_EDGAR_2001.png (110.3 KB) - added by msaad 5 years ago.
- Emissions de NH3_EDGAR_2002.png (110.3 KB) - added by msaad 5 years ago.
- Emissions de NH3_EDGAR_2006.png (111.2 KB) - added by msaad 5 years ago.
- Emissions de NH3_EDGAR_2010.png (111.7 KB) - added by msaad 5 years ago.
- Emissions de NH3_EDGAR_2011.png (112.2 KB) - added by msaad 5 years ago.
- EMI_NH3_AS_2000.png (99.6 KB) - added by msaad 5 years ago.
- EMI_NH3_AS_2001.png (99.6 KB) - added by msaad 5 years ago.
- EMI_NH3_AS_2002.png (100.1 KB) - added by msaad 5 years ago.
- EMI_NH3_AS_2003.png (100.5 KB) - added by msaad 5 years ago.
- EMI_NH3_AS_2004.png (100.7 KB) - added by msaad 5 years ago.
- EMI_NH3_AS_2005.png (101.0 KB) - added by msaad 5 years ago.
- EMI_NH3_AS_2006.png (101.4 KB) - added by msaad 5 years ago.
- EMI_NH3_AS_2007.png (101.5 KB) - added by msaad 5 years ago.
- EMI_NH3_AS_2008.png (101.7 KB) - added by msaad 5 years ago.
- EMI_NH3_AS_2009.png (101.8 KB) - added by msaad 5 years ago.
- EMI_NH3_AS_2010.png (102.2 KB) - added by msaad 5 years ago.
- EMI_NH3_AS_2010.2.png (102.2 KB) - added by msaad 5 years ago.
- EMI_NH3_AS_2011.png (102.4 KB) - added by msaad 5 years ago.
- EMI_NH3_AS_2012.png (102.5 KB) - added by msaad 5 years ago.
- EMI_NH3_MM_2000.png (81.8 KB) - added by msaad 5 years ago.
- EMI_NH3_MM_2001.png (81.9 KB) - added by msaad 5 years ago.
- EMI_NH3_MM_2002.png (82.1 KB) - added by msaad 5 years ago.
- EMI_NH3_MM_2003.png (82.3 KB) - added by msaad 5 years ago.
- EMI_NH3_MM_2004.png (82.3 KB) - added by msaad 5 years ago.
- EMI_NH3_MM_2005.png (82.7 KB) - added by msaad 5 years ago.
- EMI_NH3_MM_2006.png (83.0 KB) - added by msaad 5 years ago.
- EMI_NH3_MM_2007.png (83.3 KB) - added by msaad 5 years ago.
- EMI_NH3_MM_2008.png (83.5 KB) - added by msaad 5 years ago.
- EMI_NH3_MM_2009.png (83.7 KB) - added by msaad 5 years ago.
- EMI_NH3_MM_2010.png (83.9 KB) - added by msaad 5 years ago.
- EMI_NH3_MM_2011.png (83.9 KB) - added by msaad 5 years ago.
- EMI_NH3_AS_JANVIER2010.png (94.2 KB) - added by msaad 5 years ago.
- EMI_NH3_AS_FEVRIER2010.png (105.7 KB) - added by msaad 5 years ago.
- EMI_NH3_AS_MARS2010.png (109.5 KB) - added by msaad 5 years ago.
- EMI_NH3_AS_AVRIL2010.png (106.1 KB) - added by msaad 5 years ago.
- EMI_NH3_AS_MAI2010.png (99.7 KB) - added by msaad 5 years ago.
- EMI_NH3_AS_JUIN2010.png (100.1 KB) - added by msaad 5 years ago.
- EMI_NH3_AS_JUILLET2010.png (99.6 KB) - added by msaad 5 years ago.
- EMI_NH3_AS_AOUT2010.png (102.7 KB) - added by msaad 5 years ago.
- EMI_NH3_AS_SEPTEMBRE2010.png (105.6 KB) - added by msaad 5 years ago.
- EMI_NH3_AS_OCTOBRE2010.png (100.5 KB) - added by msaad 5 years ago.
- EMI_NH3_AS_NOVEMBRE2010.png (95.1 KB) - added by msaad 5 years ago.
- EMI_NH3_AS_DECEMBRE2010.png (94.3 KB) - added by msaad 5 years ago.
- EMI_NH3_MM_JANVIER2010.png (78.7 KB) - added by msaad 5 years ago.
- EMI_NH3_MM_FEVRIER2010.png (86.9 KB) - added by msaad 5 years ago.
- EMI_NH3_MM_MARS2010.png (89.4 KB) - added by msaad 5 years ago.
- EMI_NH3_MM_AVRIL2010.png (87.4 KB) - added by msaad 5 years ago.
- EMI_NH3_MM_MAI2010.png (82.5 KB) - added by msaad 5 years ago.
- EMI_NH3_MM_JUIN2010.png (82.9 KB) - added by msaad 5 years ago.
- EMI_NH3_MM_JUILLET2010.png (82.4 KB) - added by msaad 5 years ago.
- EMI_NH3_MM_AOUT2010.png (84.3 KB) - added by msaad 5 years ago.
- EMI_NH3_MM_SEPTEMBRE2010.png (85.6 KB) - added by msaad 5 years ago.
- EMI_NH3_MM_OCTOBRE2010.png (81.6 KB) - added by msaad 5 years ago.
- EMI_NH3_MM_NOVEMBRE2010.png (79.3 KB) - added by msaad 5 years ago.
- EMI_NH3_MM_DECEMBRE2010.png (78.9 KB) - added by msaad 5 years ago.
- variation mensuelle des émissions de NH3_EDGAR.png (116.4 KB) - added by msaad 5 years ago.
- bilan_mensuelle_2010_AGS_MM_AWB.gif (9.0 KB) - added by msaad 5 years ago.
- bilan_mensuelle_2010_AGS_MM_AWB(y=-90:-30).gif (8.4 KB) - added by msaad 5 years ago.
- bilan_mensuelle_2010_AGS_MM_AWB(y=-90:30).gif (8.5 KB) - added by msaad 5 years ago.
- bilan_mensuelle_2010_AGS_MM_AWB(y=30:90).gif (9.1 KB) - added by msaad 5 years ago.
- bilan_mensuelle_2010_AGS_MM_AWB_y=-90:-30.gif (8.4 KB) - added by msaad 5 years ago.
- bilan_mensuelle_2010_AGS_MM_AWB_y=-30:30.gif (8.2 KB) - added by msaad 5 years ago.
- bilan_mensuelle_2010_AGS_MM_AWB_y=30:90.gif (9.1 KB) - added by msaad 5 years ago.
- bilan_mensuelle_2010_AGS_MM_AWB_y_-90:-30.gif (8.4 KB) - added by msaad 5 years ago.
- bilan_mensuelle_2010_1_AGS_MM_AWB.gif (8.4 KB) - added by msaad 5 years ago.
- bilan_mensuelle_2010_2_AGS_MM_AWB.gif (8.2 KB) - added by msaad 5 years ago.
- bilan_mensuelle_2010_3_AGS_MM_AWB.gif (9.1 KB) - added by msaad 5 years ago.
- EMI_NH3_MM_2002.2.png (82.1 KB) - added by msaad 5 years ago.
- NH3_EM_ANTHRO_2012_Moyenne.png (95.8 KB) - added by msaad 5 years ago.
- EMI_NH3_MM_2012.png (84.0 KB) - added by msaad 5 years ago.
- bilan_mensuel_2010_4_AGS_MM_AWB.gif (8.0 KB) - added by msaad 5 years ago.
- bilan_mensuel_2010_5_AGS_MM_AWB.gif (8.1 KB) - added by msaad 5 years ago.
- bilan_mensuel_2010_90S_90N.gif (8.7 KB) - added by msaad 5 years ago.
- bilan_mensuel_2010_90S_30S.gif (8.5 KB) - added by msaad 5 years ago.
- bilan_mensuel_2010_30S_30N.gif (8.2 KB) - added by msaad 5 years ago.
- bilan_mensuel_2010_30N_90N.gif (9.1 KB) - added by msaad 5 years ago.
- bilan_mensuel_2010_30S_0.gif (7.8 KB) - added by msaad 5 years ago.
- bilan_mensuel_2010_0_30N.gif (8.0 KB) - added by msaad 5 years ago.
- bilan_glob_1970_2014_CEDS_EDGAR_ORCHIDEE.gif (10.2 KB) - added by msaad 5 years ago.
- bilan_glob_CEDS_EDGAR_ORCHIDEE_1970_2014.gif (9.0 KB) - added by msaad 5 years ago.
- bilan_glob_CEDS_EDGAR_ORCHIDEE_1970_2014.2.gif (9.0 KB) - added by msaad 5 years ago.
- bilan_glob_CEDS_ORCHIDEE_1861_2014.gif (8.1 KB) - added by msaad 5 years ago.
- bilan_glob_CEDS_EDAR_ORCHIDEE_1870_2014.gif (8.6 KB) - added by msaad 5 years ago.
- bilan_mensuel_2010_30N.gif (9.2 KB) - added by msaad 5 years ago.
- bilan_mensuel_2010_30S.gif (9.7 KB) - added by msaad 5 years ago.
- bilan_mensuel_2010_CEDS_90S_90N.gif (9.5 KB) - added by msaad 5 years ago.
- bilan_mensuel_2010_CEDS_90S_30S.gif (9.8 KB) - added by msaad 5 years ago.
- bilan_mensuel_2010_CEDS_30S_30N.gif (9.5 KB) - added by msaad 5 years ago.
- bilan_mensuel_2010_CEDS_30N_90N.gif (9.7 KB) - added by msaad 5 years ago.
- bilan_mensuel_2010_CEDS_30S_0.gif (10.1 KB) - added by msaad 5 years ago.
- bilan_mensuel_2010_CEDS_0_30N.gif (9.4 KB) - added by msaad 5 years ago.
- bilan_mensuel_2010_0.gif (9.0 KB) - added by msaad 5 years ago.
- bilan_mensuel_2010_80S.gif (5.4 KB) - added by msaad 5 years ago.
- bilan_mensuel_2010_70S.gif (5.4 KB) - added by msaad 5 years ago.
- bilan_mensuel_2010_60S.gif (5.4 KB) - added by msaad 5 years ago.
- bilan_mensuel_2010_60S.2.gif (5.4 KB) - added by msaad 5 years ago.
- bilan_mensuel_2010_50S.gif (7.6 KB) - added by msaad 5 years ago.
- bilan_mensuel_2010_40S.gif (7.5 KB) - added by msaad 5 years ago.
- bilan_mensuel_2010_30S.2.gif (9.7 KB) - added by msaad 5 years ago.
- bilan_mensuel_2010_20S.gif (11.3 KB) - added by msaad 5 years ago.
- bilan_mensuel_2010_10S.gif (8.9 KB) - added by msaad 5 years ago.
- bilan_mensuel_2010_10N.gif (9.0 KB) - added by msaad 5 years ago.
- bilan_mensuel_2010_20N.gif (11.8 KB) - added by msaad 5 years ago.
- bilan_mensuel_2010_40N.gif (7.5 KB) - added by msaad 5 years ago.
- bilan_mensuel_2010_50N.gif (7.5 KB) - added by msaad 5 years ago.
- bilan_mensuel_2010_60N.gif (7.6 KB) - added by msaad 5 years ago.
- bilan_mensuel_2010_70N.gif (7.5 KB) - added by msaad 5 years ago.
- bilan_mensuel_2010_80N.gif (7.5 KB) - added by msaad 5 years ago.
- bilan_glob_CEDS_ORCHIDEE_k2.gif (8.0 KB) - added by msaad 5 years ago.
- bilan_glob_CEDS_ORCHIDEE_k1.gif (7.1 KB) - added by msaad 5 years ago.
- bilan_glob_CEDS_ORCHIDEE_NH3_NOX.gif (9.6 KB) - added by msaad 5 years ago.
- bilan_glob_CEDS_ORCHIDEE_k_1_11_NOx.gif (12.7 KB) - added by msaad 5 years ago.
- bilan_glob_CEDS_ORCHIDEE_k_12_13_NOx.gif (8.3 KB) - added by msaad 5 years ago.
- bilan_glob_CEDS_ORCHIDEE_1861_2014.2.gif (9.0 KB) - added by msaad 5 years ago.
- bilan_glob_CEDS_ORCHIDEE_NOx_1861_k_1_11_2014.gif (12.3 KB) - added by msaad 5 years ago.
- bilan_glob_CEDS_ORCHIDEE_NOx_k_12_13_1861_2014.gif (10.5 KB) - added by msaad 5 years ago.
- bilan_glob_CEDS_ORCHIDEE_NH3_NOX_1861_2014.gif (11.6 KB) - added by msaad 5 years ago.
- bilan_glob_nh3_k_10_13_1861_2014.gif (7.6 KB) - added by msaad 5 years ago.
- bilan_glob_nh3_nox_n2o_1861_2014.gif (13.2 KB) - added by msaad 5 years ago.
- bilan_mensuel_2010_EDGAR_0.gif (6.0 KB) - added by msaad 5 years ago.
- bilan_mensuel_2010_EDGAR_10N.gif (6.0 KB) - added by msaad 5 years ago.
- bilan_mensuel_2010_EDGAR_10S.gif (6.0 KB) - added by msaad 5 years ago.
- bilan_mensuel_2010_EDGAR_20N.gif (6.6 KB) - added by msaad 5 years ago.
- bilan_mensuel_2010_EDGAR_20S.gif (6.7 KB) - added by msaad 5 years ago.
- bilan_mensuel_2010_EDGAR_30S.gif (9.1 KB) - added by msaad 5 years ago.
- bilan_mensuel_2010_EDGAR_60S.gif (5.6 KB) - added by msaad 5 years ago.
- bilan_mensuel_2010_EDGAR_70S.gif (5.6 KB) - added by msaad 5 years ago.
- bilan_mensuel_2010_EDGAR_80S.gif (5.7 KB) - added by msaad 5 years ago.
- BILAN_GLOB_CEDS_ORCHIDEE_1861_2014_NH3.gif (8.4 KB) - added by msaad 5 years ago.
- BILAN_GLOB_CEDS_ORCHIDEE_1861_2014_PFT_1-11_NH3.gif (8.2 KB) - added by msaad 5 years ago.
- BILAN_GLOB_CEDS_ORCHIDEE_1861_2014_PFT_10-13_NH3.gif (8.0 KB) - added by msaad 5 years ago.
- BILAN_GLOB_CEDS_ORCHIDEE_1861_2014_PFT_12-13_NH3.gif (7.5 KB) - added by msaad 5 years ago.
- BILAN_GLOB_CEDS_ORCHIDEE_1861_2014_NOX.gif (7.4 KB) - added by msaad 5 years ago.
- BILAN_GLOB_CEDS_ORCHIDEE_1861_2014_PFT_1-11_NOX.gif (7.4 KB) - added by msaad 5 years ago.
- BILAN_GLOB_CEDS_ORCHIDEE_1861_2014_PFT_12-13_NOX.gif (7.7 KB) - added by msaad 5 years ago.
- BILAN_GLOB_CEDS_ORCHIDEE_1861_2014_PFT_12-13_NOX.2.gif (7.7 KB) - added by msaad 5 years ago.
- BILAN_GLOB_CEDS_ORCHIDEE_1861_2014_PFT_10-13_NOX.gif (7.4 KB) - added by msaad 5 years ago.
- BILAN_GLOB_ORCHIDEE_1861_2014_N2O.gif (9.9 KB) - added by msaad 5 years ago.
- BILAN_GLOB_CEDS_ORCHIDEE_1861_2014_PFT_1-11_N2O.gif (12.2 KB) - added by msaad 5 years ago.
- BILAN_GLOB_CEDS_ORCHIDEE_1861_2014_PFT_12-13_N2O.gif (8.3 KB) - added by msaad 5 years ago.
- BILAN_GLOB_CEDS_ORCHIDEE_1861_2014_PFT_10-13_N2O.gif (9.3 KB) - added by msaad 5 years ago.
- BILAN_GLOB_CEDS_EDGAR_ORCHIDEE_1861-2014_NH3.gif (10.2 KB) - added by msaad 5 years ago.
- BILAN_GLOB_CEDS_EDGAR_ORCHIDEE_1864-2014_NOX.gif (8.6 KB) - added by msaad 5 years ago.
- BILAN_GLOB_EDGAR_ORCHIDEE_1861-2014_N2O.gif (8.3 KB) - added by msaad 5 years ago.
- bilan_mensuel_AGS_MNM_AWB_NOX_80S_2010.gif (5.6 KB) - added by msaad 5 years ago.
- bilan_mensuel_AGS_MNM_AWB_NOX_80N_2010.gif (7.5 KB) - added by msaad 5 years ago.
- bilan_mensuel_AGS_MNM_AWB_NOX_70S_2010.gif (5.6 KB) - added by msaad 5 years ago.
- bilan_mensuel_AGS_MNM_AWB_NOX_70N_2010.gif (7.5 KB) - added by msaad 5 years ago.
- bilan_mensuel_AGS_MNM_AWB_NOX_60S_2010.gif (5.6 KB) - added by msaad 5 years ago.
- bilan_mensuel_AGS_MNM_AWB_NOX_60N_2010.gif (7.5 KB) - added by msaad 5 years ago.
- bilan_mensuel_AGS_MNM_AWB_NOX_50S_2010.gif (7.6 KB) - added by msaad 5 years ago.
- bilan_mensuel_AGS_MNM_AWB_NOX_50N_2010.gif (7.5 KB) - added by msaad 5 years ago.
- bilan_mensuel_AGS_MNM_AWB_NOX_40S_2010.gif (7.6 KB) - added by msaad 5 years ago.
- bilan_mensuel_AGS_MNM_AWB_NOX_40N_2010.gif (7.6 KB) - added by msaad 5 years ago.
- bilan_mensuel_AGS_MNM_AWB_NOX_30S_2010.gif (8.6 KB) - added by msaad 5 years ago.
- bilan_mensuel_AGS_MNM_AWB_NOX_30N_2010.gif (9.1 KB) - added by msaad 5 years ago.
- bilan_mensuel_AGS_MNM_AWB_NOX_20S_2010.gif (6.6 KB) - added by msaad 5 years ago.
- bilan_mensuel_AGS_MNM_AWB_NOX_20N_2010.gif (6.6 KB) - added by msaad 5 years ago.
- bilan_mensuel_AGS_MNM_AWB_NOX_10S_2010.gif (5.9 KB) - added by msaad 5 years ago.
- bilan_mensuel_AGS_MNM_AWB_NOX_10N_2010.gif (5.9 KB) - added by msaad 5 years ago.
- bilan_mensuel_AGS_MNM_AWB_N2O_80S_2010.gif (5.6 KB) - added by msaad 5 years ago.
- bilan_mensuel_AGS_MNM_AWB_N2O_80N_2010.gif (7.5 KB) - added by msaad 5 years ago.
- bilan_mensuel_AGS_MNM_AWB_N2O_70S_2010.gif (5.6 KB) - added by msaad 5 years ago.
- bilan_mensuel_AGS_MNM_AWB_N2O_70N_2010.gif (7.5 KB) - added by msaad 5 years ago.
- bilan_mensuel_AGS_MNM_AWB_N2O_60S_2010.gif (5.6 KB) - added by msaad 5 years ago.
- bilan_mensuel_AGS_MNM_AWB_N2O_60N_2010.gif (7.6 KB) - added by msaad 5 years ago.
- bilan_mensuel_AGS_MNM_AWB_N2O_50S_2010.gif (7.5 KB) - added by msaad 5 years ago.
- bilan_mensuel_AGS_MNM_AWB_N2O_50N_2010.gif (7.5 KB) - added by msaad 5 years ago.
- bilan_mensuel_AGS_MNM_AWB_N2O_40S_2010.gif (7.5 KB) - added by msaad 5 years ago.
- bilan_mensuel_AGS_MNM_AWB_N2O_40N_2010.gif (7.5 KB) - added by msaad 5 years ago.
- bilan_mensuel_AGS_MNM_AWB_N2O_30S_2010.gif (8.6 KB) - added by msaad 5 years ago.
- bilan_mensuel_AGS_MNM_AWB_N2O_30N_2010.gif (9.2 KB) - added by msaad 5 years ago.
- bilan_mensuel_AGS_MNM_AWB_N2O_20S_2010.gif (6.5 KB) - added by msaad 5 years ago.
- bilan_mensuel_AGS_MNM_AWB_N2O_20N_2010.gif (6.7 KB) - added by msaad 5 years ago.
- bilan_mensuel_AGS_MNM_AWB_N2O_20N_2010.2.gif (6.7 KB) - added by msaad 5 years ago.
- bilan_mensuel_AGS_MNM_AWB_N2O_10S_2010.gif (6.0 KB) - added by msaad 5 years ago.
- bilan_mensuel_AGS_MNM_AWB_N2O_10N_2010.gif (5.9 KB) - added by msaad 5 years ago.
- bilan_mensuel_AGS_MNM_AWB_N2O_0_2010.gif (6.0 KB) - added by msaad 5 years ago.
- bilan_mensuel_AGS_MNM_AWB_NOX_0_2010.gif (6.0 KB) - added by msaad 5 years ago.
- bilan_mensuel_mensuel_2010_90S_90N_AGS_MNM_AWB_NOX.gif (9.1 KB) - added by msaad 5 years ago.
- bilan_mensuel_mensuel_2010_90S_30S_AGS_MNM_AWB_NOX.gif (9.7 KB) - added by msaad 5 years ago.
- bilan_mensuel_mensuel_2010_30S_30N_AGS_MNM_AWB_NOX.gif (8.3 KB) - added by msaad 5 years ago.
- bilan_mensuel_mensuel_2010_30S_0_AGS_MNM_AWB_NOX.gif (8.4 KB) - added by msaad 5 years ago.
- bilan_mensuel_mensuel_2010_30N_90N_AGS_MNM_AWB_NOX.gif (8.8 KB) - added by msaad 5 years ago.
- bilan_mensuel_mensuel_2010_0_30N_AGS_MNM_AWB_NOX.gif (8.4 KB) - added by msaad 5 years ago.
- bilan_mensuel_2010_90S_90N_AGS_MNM_AWB_N2O.gif (8.3 KB) - added by msaad 5 years ago.
- bilan_mensuel_2010_90S_30S_AGS_MNM_AWB_N2O.gif (8.3 KB) - added by msaad 5 years ago.
- bilan_mensuel_2010_30S_30N_AGS_MNM_AWB_N2O.gif (7.8 KB) - added by msaad 5 years ago.
- bilan_mensuel_2010_30S_0_AGS_MNM_AWB_N2O.gif (7.5 KB) - added by msaad 5 years ago.
- bilan_mensuel_2010_30N_90N_AGS_MNM_AWB_N2O.gif (8.6 KB) - added by msaad 5 years ago.
- bilan_mensuel_2010_0_30N_AGS_MNM_AWB_N2O.gif (7.8 KB) - added by msaad 5 years ago.
- BILAN_GLOB_EDGAR_ORCHIDEE_1861_2014_N2O.gif (8.5 KB) - added by msaad 5 years ago.
- emission_orchidee_2000_nh3_pft_12-13.gif (18.8 KB) - added by msaad 5 years ago.
- emission_orchidee_2001_nh3_pft_12-13.gif (18.9 KB) - added by msaad 5 years ago.
- emission_orchidee_2002_nh3_pft_12-13.gif (19.0 KB) - added by msaad 5 years ago.
- emission_orchidee_2003_nh3_pft_12-13.gif (18.9 KB) - added by msaad 5 years ago.
- emission_orchidee_2004_nh3_pft_12-13.gif (18.7 KB) - added by msaad 5 years ago.
- emission_orchidee_2005_nh3_pft_12-13.gif (18.8 KB) - added by msaad 5 years ago.
- emission_orchidee_2006_nh3_pft_12-13.gif (18.9 KB) - added by msaad 5 years ago.
- emission_orchidee_2007_nh3_pft_12-13.gif (19.0 KB) - added by msaad 5 years ago.
- emission_orchidee_2008_nh3_pft_12-13.gif (19.0 KB) - added by msaad 5 years ago.
- emission_orchidee_2009_nh3_pft_12-13.gif (19.0 KB) - added by msaad 5 years ago.
- emission_orchidee_2010_nh3_pft_12-13.gif (18.9 KB) - added by msaad 5 years ago.
- emission_orchidee_2011_nh3_pft_12-13.gif (18.9 KB) - added by msaad 5 years ago.
- emission_orchidee_2012_nh3_pft_12-13.gif (19.2 KB) - added by msaad 5 years ago.
- emission_orc_PFTs_2003-2012_NH3.gif (26.0 KB) - added by msaad 5 years ago.
- emission_orc_PFTs_12-13_2003-2012_NH3.gif (22.2 KB) - added by msaad 5 years ago.
- emission_ceds_2003-2012_NH3.gif (24.8 KB) - added by msaad 5 years ago.
- emission_edgar_2003-2012_NH3.gif (26.4 KB) - added by msaad 5 years ago.
- emission_orc_PFTs_2003-2012_NOX.gif (22.8 KB) - added by msaad 5 years ago.
- emission_orc_PFTs_12-13_2003-2012_NOX.gif (20.2 KB) - added by msaad 5 years ago.
- emission_ceds_2003-2012_NOX.gif (17.9 KB) - added by msaad 5 years ago.
- emission_edgar_2003-2012_NOX.gif (17.9 KB) - added by msaad 5 years ago.
- emission_orc_PFTs_2003-2012_N2O.gif (20.5 KB) - added by msaad 5 years ago.
- emission_orc_PFTs_12-13_2003-2012_N2O.gif (15.8 KB) - added by msaad 5 years ago.
- emission_edgar_2003-2012_N2O.gif (17.9 KB) - added by msaad 5 years ago.
- emission_edgar_2003-2012.NH3.gif (25.9 KB) - added by msaad 5 years ago.
- emission_edgar_2003-2012.N2O.gif (18.1 KB) - added by msaad 5 years ago.
- emission_edgar_2003-2012.NOX.gif (18.1 KB) - added by msaad 5 years ago.
- emission_orc_2003-2012_NOX.gif (43.6 KB) - added by msaad 5 years ago.
- emission_orc_PFTs_12-13_2003-2012_NOX.2.gif (35.6 KB) - added by msaad 5 years ago.
- emission_ceds_2003-2012_NOX.2.gif (30.8 KB) - added by msaad 5 years ago.
- emission_edgar_2003-2012.NOX.2.gif (33.9 KB) - added by msaad 5 years ago.
- emission_orc_2003-2012_N2O.gif (40.4 KB) - added by msaad 5 years ago.
- emission_orc_PFTs_12-13_2003-2012_N2O.2.gif (35.6 KB) - added by msaad 5 years ago.
- emission_edgar_2003-2012_N2O.2.gif (36.1 KB) - added by msaad 5 years ago.
- emission_orc_2003-2012_NH3.gif (45.1 KB) - added by msaad 5 years ago.
- emission_orc_PFTs_12-13_2003-2012_NH3.2.gif (32.5 KB) - added by msaad 5 years ago.
- emission_edgar_2003-2012_NH3.2.gif (38.6 KB) - added by msaad 5 years ago.
- emission_ceds_2003-2012_NH3.2.gif (38.7 KB) - added by msaad 5 years ago.
- emission_orc_PFTs_12-13_2003-2012_N2O.3.gif (32.3 KB) - added by msaad 5 years ago.
- emission_orc_2003-2012_N2O.2.gif (40.2 KB) - added by msaad 5 years ago.
- emission_edgar_2003-2012_NH3_AGS.gif (37.7 KB) - added by msaad 5 years ago.
- emission_edgar_2003-2012_NOX_AGS.gif (31.3 KB) - added by msaad 5 years ago.
- emission_edgar_2003-2012_N2O_AGS.gif (36.1 KB) - added by msaad 5 years ago.
- EF1_orc_2003-2012_NH3.gif (30.1 KB) - added by msaad 5 years ago.
- EF2_orc_2003-2012_NH3.gif (41.6 KB) - added by msaad 5 years ago.
- EF3_orc_2003-2012_NH3.gif (39.7 KB) - added by msaad 5 years ago.
- N_fertiliser1_orc_2003-2012_NH3.gif (27.5 KB) - added by msaad 5 years ago.
- N_fertiliser2_orc_2003-2012_NH3.gif (38.3 KB) - added by msaad 5 years ago.
- N_fertiliser3_orc_2003-2012_NH3.gif (38.1 KB) - added by msaad 5 years ago.
- N_manure1_orc_2003-2012_NH3.gif (31.4 KB) - added by msaad 5 years ago.
- N_manure2_orc_2003-2012_NH3.gif (43.1 KB) - added by msaad 5 years ago.
- N_manure3_orc_2003-2012_NH3.gif (41.7 KB) - added by msaad 5 years ago.
- FE_orc_PFTs_1-13_NH3.gif (29.8 KB) - added by msaad 5 years ago.
- FE_orc_PFTs_10-13_NH3.gif (32.9 KB) - added by msaad 5 years ago.
- FE_orc_PFTs_12-13_NH3.gif (33.8 KB) - added by msaad 5 years ago.
- FE_orc_PFTs_10-11_NH3.gif (27.6 KB) - added by msaad 5 years ago.
- N_fertiliser_orc_PFTs_1-13_NH3.gif (25.3 KB) - added by msaad 5 years ago.
- N_fertiliser_orc_PFTs_10-13_NH3.gif (25.3 KB) - added by msaad 5 years ago.
- N_fertiliser_orc_PFTs_12-13_NH3.gif (29.1 KB) - added by msaad 5 years ago.
- N_fertiliser_orc_PFTs_10-11_NH3.gif (21.6 KB) - added by msaad 5 years ago.
- N_manure_orc_PFTs_1-13_NH3.gif (23.3 KB) - added by msaad 5 years ago.
- N_manure_orc_PFTs_10-13_NH3.gif (23.3 KB) - added by msaad 5 years ago.
- N_manure_orc_PFTs_12-13_NH3.gif (20.9 KB) - added by msaad 5 years ago.
- N_manure_orc_PFTs_10-11_NH3.gif (22.1 KB) - added by msaad 5 years ago.
- N_fertiliser_orc_2000_NH3.gif (29.7 KB) - added by msaad 5 years ago.
- N_fertiliser_orc_2001_NH3.gif (29.8 KB) - added by msaad 5 years ago.
- N_fertiliser_orc_2002_NH3.gif (29.9 KB) - added by msaad 5 years ago.
- N_fertiliser_orc_2003_NH3.gif (29.8 KB) - added by msaad 5 years ago.
- N_fertiliser_orc_2004_NH3.gif (29.9 KB) - added by msaad 5 years ago.
- N_fertiliser_orc_2005_NH3.gif (29.9 KB) - added by msaad 5 years ago.
- N_fertiliser_orc_2006_NH3.gif (29.8 KB) - added by msaad 5 years ago.
- N_fertiliser_orc_2007_NH3.gif (30.1 KB) - added by msaad 5 years ago.
- N_fertiliser_orc_2008_NH3.gif (30.1 KB) - added by msaad 5 years ago.
- N_fertiliser_orc_2009_NH3.gif (30.2 KB) - added by msaad 5 years ago.
- N_fertiliser_orc_2010_NH3.gif (30.3 KB) - added by msaad 5 years ago.
- N_fertiliser_orc_2011_NH3.gif (30.5 KB) - added by msaad 5 years ago.
- N_fertiliser_orc_2012_NH3.gif (30.6 KB) - added by msaad 5 years ago.
- N_fertiliser_orc_2013_NH3.gif (30.5 KB) - added by msaad 5 years ago.
- N_fertiliser_orc_2014_NH3.gif (30.6 KB) - added by msaad 5 years ago.
- N_fertiliser_orc_2015_NH3.gif (30.6 KB) - added by msaad 5 years ago.
- N_fertiliser_orc_2016_NH3.gif (30.6 KB) - added by msaad 5 years ago.
- N_fertiliser_orc_JANVIER_2016_NH3.gif (30.4 KB) - added by msaad 5 years ago.
- N_fertiliser_orc_FEVRIER_2016_NH3.gif (30.5 KB) - added by msaad 5 years ago.
- N_fertiliser_orc_MARS_2016_NH3.gif (30.4 KB) - added by msaad 5 years ago.
- N_fertiliser_orc_AVRIL_2016_NH3.gif (30.4 KB) - added by msaad 5 years ago.
- N_fertiliser_orc_MAI_2016_NH3.gif (30.4 KB) - added by msaad 5 years ago.
- N_fertiliser_orc_JUIN_2016_NH3.gif (30.4 KB) - added by msaad 5 years ago.
- N_fertiliser_orc_JUILLET_2016_NH3.gif (30.4 KB) - added by msaad 5 years ago.
- N_fertiliser_orc_AOUT_2016_NH3.gif (30.4 KB) - added by msaad 5 years ago.
- N_fertiliser_orc_SEPTEMBRE_2016_NH3.gif (30.5 KB) - added by msaad 5 years ago.
- N_fertiliser_orc_OCTOBRE_2016_NH3.gif (30.4 KB) - added by msaad 5 years ago.
- N_fertiliser_orc_NOVEMBRE_2016_NH3.gif (30.4 KB) - added by msaad 5 years ago.
- N_fertiliser_orc_DECEMBRE_2016_NH3.gif (30.4 KB) - added by msaad 5 years ago.
- emission_orc_2000_NH3.gif (23.0 KB) - added by msaad 5 years ago.
- emission_orc_2001_NH3.gif (26.9 KB) - added by msaad 5 years ago.
- emission_orc_2002_NH3.gif (27.4 KB) - added by msaad 5 years ago.
- emission_orc_2003_NH3.gif (27.5 KB) - added by msaad 5 years ago.
- emission_orc_2004_NH3.gif (26.9 KB) - added by msaad 5 years ago.
- emission_orc_2005_NH3.gif (27.1 KB) - added by msaad 5 years ago.
- emission_orc_2006_NH3.gif (27.2 KB) - added by msaad 5 years ago.
- emission_orc_2007_NH3.gif (27.1 KB) - added by msaad 5 years ago.
- emission_orc_2008_NH3.gif (27.0 KB) - added by msaad 5 years ago.
- emission_orc_2009_NH3.gif (27.0 KB) - added by msaad 5 years ago.
- emission_orc_2010_NH3.gif (27.0 KB) - added by msaad 5 years ago.
- emission_orc_2012_NH3.gif (27.7 KB) - added by msaad 5 years ago.
- emission_orc_2011_NH3.gif (27.1 KB) - added by msaad 5 years ago.
- emission_orc_2013_NH3.gif (27.8 KB) - added by msaad 5 years ago.
- emission_orc_2014_NH3.gif (27.5 KB) - added by msaad 5 years ago.
- emission_orc_2015_NH3.gif (28.0 KB) - added by msaad 5 years ago.
- emission_orc_2016_NH3.gif (27.9 KB) - added by msaad 5 years ago.
- FE_orc_2000_NH3.gif (28.5 KB) - added by msaad 5 years ago.
- FE_orc_2001_NH3.gif (28.7 KB) - added by msaad 5 years ago.
- FE_orc_2002_NH3.gif (28.4 KB) - added by msaad 5 years ago.
- FE_orc_2003_NH3.gif (28.4 KB) - added by msaad 5 years ago.
- FE_orc_2004_NH3.gif (28.8 KB) - added by msaad 5 years ago.
- FE_orc_2005_NH3.gif (28.6 KB) - added by msaad 5 years ago.
- FE_orc_2006_NH3.gif (28.4 KB) - added by msaad 5 years ago.
- FE_orc_2007_NH3.gif (28.8 KB) - added by msaad 5 years ago.
- FE_orc_2008_NH3.gif (28.6 KB) - added by msaad 5 years ago.
- FE_orc_2009_NH3.gif (28.6 KB) - added by msaad 5 years ago.
- FE_orc_2010_NH3.gif (28.9 KB) - added by msaad 5 years ago.
- FE_orc_2011_NH3.gif (28.7 KB) - added by msaad 5 years ago.
- FE_orc_2012_NH3.gif (28.7 KB) - added by msaad 5 years ago.
- FE_orc_2013_NH3.gif (28.6 KB) - added by msaad 5 years ago.
- FE_orc_2014_NH3.gif (28.6 KB) - added by msaad 5 years ago.
- FE_orc_2015_NH3.gif (28.5 KB) - added by msaad 5 years ago.
- FE_orc_2016_NH3.gif (28.7 KB) - added by msaad 5 years ago.
- bilan_glob_ceds_orc_fert_manure_NH3.gif (9.0 KB) - added by msaad 5 years ago.
- N_fert_manu_orc_2000_NH3.gif (32.0 KB) - added by msaad 5 years ago.
- N_fert_manu_orc_2001_NH3.gif (32.0 KB) - added by msaad 5 years ago.
- N_fert_manu_orc_2002_NH3.gif (32.1 KB) - added by msaad 5 years ago.
- N_fert_manu_orc_2003_NH3.gif (32.3 KB) - added by msaad 5 years ago.
- N_fert_manu_orc_2004_NH3.gif (32.2 KB) - added by msaad 5 years ago.
- N_fert_manu_orc_2005_NH3.gif (32.3 KB) - added by msaad 5 years ago.
- N_fert_manu_orc_2006_NH3.gif (32.1 KB) - added by msaad 5 years ago.
- N_fert_manu_orc_2007_NH3.gif (32.4 KB) - added by msaad 5 years ago.
- N_fert_manu_orc_2008_NH3.gif (32.5 KB) - added by msaad 5 years ago.
- FE_orc_2000_NH3.2.gif (23.9 KB) - added by msaad 5 years ago.
- FE_orc_2001_NH3.2.gif (23.9 KB) - added by msaad 5 years ago.
- FE_orc_2002_NH3.2.gif (24.1 KB) - added by msaad 5 years ago.
- FE_orc_2003_NH3.2.gif (24.0 KB) - added by msaad 5 years ago.
- FE_orc_2004_NH3.2.gif (23.8 KB) - added by msaad 5 years ago.
- FE_orc_2005_NH3.2.gif (23.9 KB) - added by msaad 5 years ago.
- FE_orc_2006_NH3.2.gif (24.1 KB) - added by msaad 5 years ago.
- FE_orc_2007_NH3.2.gif (24.2 KB) - added by msaad 5 years ago.
- FE_orc_2008_NH3.2.gif (24.5 KB) - added by msaad 5 years ago.
- FE_orc_2009_NH3.2.gif (24.2 KB) - added by msaad 5 years ago.
- FE_orc_2010_NH3.2.gif (24.1 KB) - added by msaad 5 years ago.
- FE_orc_2011_NH3.2.gif (24.1 KB) - added by msaad 5 years ago.
- FE_orc_2012_NH3.2.gif (24.5 KB) - added by msaad 5 years ago.
- FE_orc_2013_NH3.2.gif (24.3 KB) - added by msaad 5 years ago.
- FE_orc_2014_NH3.2.gif (24.5 KB) - added by msaad 5 years ago.
- FE_orc_2015_NH3.2.gif (24.8 KB) - added by msaad 5 years ago.
- FE_orc_2016_NH3.2.gif (24.5 KB) - added by msaad 5 years ago.
- FE_orc_PFTs_10-13_2000_NH3.gif (22.9 KB) - added by msaad 5 years ago.
- FE_orc_PFTs_10-13_2001_NH3.gif (22.8 KB) - added by msaad 5 years ago.
- FE_orc_PFTs_10-13_2002_NH3.gif (22.9 KB) - added by msaad 5 years ago.
- FE_orc_PFTs_10-13_2003_NH3.gif (22.9 KB) - added by msaad 5 years ago.
- FE_orc_PFTs_10-13_2004_NH3.gif (15.2 KB) - added by msaad 5 years ago.
- FE_orc_PFTs_10-13_2005_NH3.gif (22.8 KB) - added by msaad 5 years ago.
- FE_orc_PFTs_10-13_2006_NH3.gif (22.9 KB) - added by msaad 5 years ago.
- FE_orc_PFTs_10-13_2007_NH3.gif (22.9 KB) - added by msaad 5 years ago.
- FE_orc_PFTs_10-13_2008_NH3.gif (23.1 KB) - added by msaad 5 years ago.
- FE_orc_PFTs_10-13_2009_NH3.gif (23.0 KB) - added by msaad 5 years ago.
- FE_orc_PFTs_10-13_2010_NH3.gif (22.9 KB) - added by msaad 5 years ago.
- FE_orc_PFTs_10-13_2011_NH3.gif (22.9 KB) - added by msaad 5 years ago.
- FE_orc_PFTs_10-13_2012_NH3.gif (23.1 KB) - added by msaad 5 years ago.
- FE_orc_PFTs_10-13_2013_NH3.gif (23.1 KB) - added by msaad 5 years ago.
- FE_orc_PFTs_10-13_2014_NH3.gif (23.1 KB) - added by msaad 5 years ago.
- FE_orc_PFTs_10-13_2015_NH3.gif (23.3 KB) - added by msaad 5 years ago.
- FE_orc_PFTs_10-13_2016_NH3.gif (23.1 KB) - added by msaad 5 years ago.
- emission_PFTs_1-13_2000_nh3.gif (25.7 KB) - added by msaad 5 years ago.
- emission_PFTs_10-13_2000_nh3.gif (24.2 KB) - added by msaad 5 years ago.
- emission_PFTs_12-13_2000_nh3.gif (22.3 KB) - added by msaad 5 years ago.
- N_fert_PFTs_1-13_2000_nh3.gif (29.2 KB) - added by msaad 5 years ago.
- N_fert_PFTs_10-13_2000_nh3.gif (29.2 KB) - added by msaad 5 years ago.
- N_fert_PFTs_12-13_2000_nh3.gif (28.8 KB) - added by msaad 5 years ago.
- FE_ORC_2000_NH3.gif (29.4 KB) - added by msaad 5 years ago.
- FE_ORC_PFTs_10-13_2000_NH3.gif (28.0 KB) - added by msaad 5 years ago.
- emission_PFTs_1-9_2000.gif (21.5 KB) - added by msaad 5 years ago.
- N_fert_PFTs_1-9_2000.gif (20.4 KB) - added by msaad 5 years ago.
- N_fert_PFTs_1-9_2000.2.gif (20.4 KB) - added by msaad 5 years ago.
- N_manure_PFTs_1-13_2000.gif (28.5 KB) - added by msaad 5 years ago.
- N_manure_PFTs_10-13_2000.gif (28.4 KB) - added by msaad 5 years ago.
- N_manure_PFTs_12-13_2000.gif (25.1 KB) - added by msaad 5 years ago.
- N_manure_PFTs_1-9_2000.gif (20.4 KB) - added by msaad 5 years ago.
- Annuaire_Script.pdf (28.9 KB) - added by msaad 4 years ago.
.gif)
.gif)
.gif)
.gif)
.gif)
.gif)