| Version 20 (modified by taudoux, 7 years ago) (diff) |
|---|
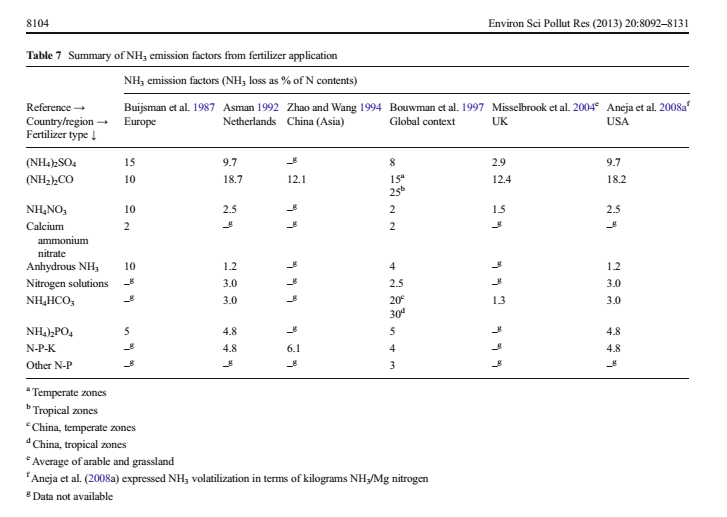
NH3
r4164
Evaluation of ammonia emissions results calculated by the model (Fertilizer =0)
- Sites and PFT :
| PFT | Sites |
|---|---|
| 2 | BR-Sa3 ; ID-Pag |
| 4 | IL-Yat ; ES-ES1 ; IT-SRo ; US-Blo ; US-Me4 ; US-SP2 ; US-SP3 ; US-SP4 ; DE-Bay ; DE-Tha ; FR-LBr |
| 5 | FR-Pue ; IT-Cpz ; IT-Lec ; PT-Esp ; PT-Mi1 ; AU-Tum ; AU-Wac |
| 6 | IT-Col ; IT-Non ; IT-PT1 ; IT-Ro2 ; US-MMS ; US-MOz ; DK-Sor ; FR-Fon ; UK-PL3 ; IS-Gun ; IT-Ro1 ; US-WBW ; DE-Hai ; FR-Hes ; UK-Ham ; US-Bar ; US-Ha1 ; US-Oho ; US-UMB ; US-WCr |
| 7 | CA-Man ; CA-NS2 ; CA-NS4 ; CA-Qcu ; CA-Qfo ; CA-SF1 ; CA-SF2 ; FI-Hyy ; FI-Sod ; SE-Fla |
| 12 | FR-Gri ; DK-Ris ; NL-Lut |
| 13 | NL-Lan ; US-Bo1 ; US-Ne1 ; US-Ne2 ; US-Ne3 |
Sites we have not looked at :
AT-Neu ; CA-NS1 ; CA-NS3 ; CA-NS5 ; CH-Oe1 ; CZ-BK1 ; DE-Gri ; DE-Meh ; DE-Wet ; DK-Lva ; ES-VDA ; FR-Lq1 ; FR-Lqr2 ; HU-Bug ; ID-Dri ; IT-Amp ; IT-Lav ; IT-Lma ; IT-Lmal ; IT-Mbor ; IT-Ren ; NL-Ca1 ; NL-Haar ; NL-Hor ; NL-Loo ; PT-Mi2 ; RU-Fyo ; RU-Ha1 ; RU-Ha2 ; RU-Ha3 ; RU-Zot ; SE-Nor ; SE-SK1 ; SE-Sk2 ; SK-Tat ; UK-EBu ; UK-Gri ; UK-Tad ; US-Aud ; US-Bkg ; US-FPe ; US-Goo ; US-Ho1 ; US-Ho2 ; US-SP1 ; US-Var ; US-Wci0 ; US-Wi1 ; US-Wi2 ; US-Wi4 ; US-Wi5 ; US-Wi8 ; US-Wi9
- Parameters studied
Temperature, Humidity and pH
path : /home/users/taudoux/documents/Results/Parameters/
Nitrogen Pools (Soil_NH4, Soil_NO3, Soil_NOX and Soil_N2O)
path : /home/users/taudoux/documents/Results/Pools/
Emissions (NH3) and Depositions (NHX)
path : /home/users/taudoux/documents/Results/Emission-Deposition/
- Files
. The script "script_calcul_parameters.ksh" used in order to create files of Temperature, Humidity and pH of each site in function of time listed in :
/home/users/taudoux/documents/Results/Parameters/T2M/SITES/;
/home/users/taudoux/documents/Results/Parameters/LITTERHUM/SITES/;
/home/users/taudoux/documents/Results/Parameters/pH/SITES/.
. The script "script_calcul_pools.ksh" used in order to create files of soil_NH4+, Soil_NO3-, Soil_NOX and Soil_N2O for each site in function of time listed in :
/home/users/taudoux/documents/Results/Pools/SOIL_NH4/SITES/ ;
/home/users/taudoux/documents/Results/Pools/SOIL_NO3/SITES/ ;
/home/users/taudoux/documents/Results/Pools/SOIL_NOX/SITES/ ;
/home/users/taudoux/documents/Results/Pools/SOIL_N2O/SITES/ .
. The Script "script_calcul_emission-deposition.ksh" used in order to create files of NH3 emission and NHX deposition for each site in function of time in :
/home/users/taudoux/documents/Results/Emission-Deposition/NH3_EMISSION/Sites/ ;
/home/users/taudoux/documents/Results/Emission-Deposition/NHX_DEPOSITION/Sites/.
For each parameter are listed :
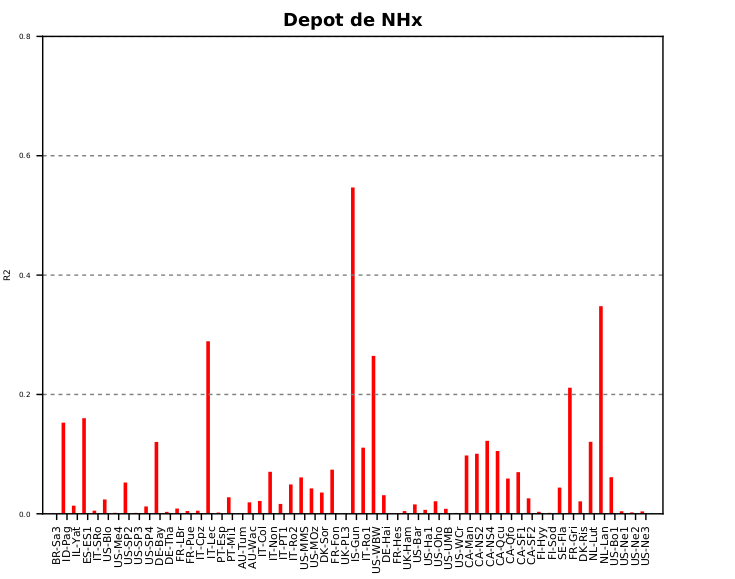
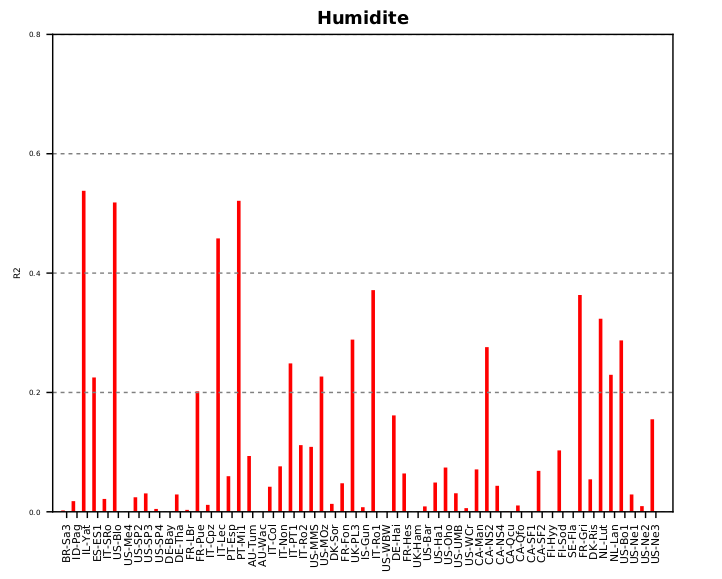
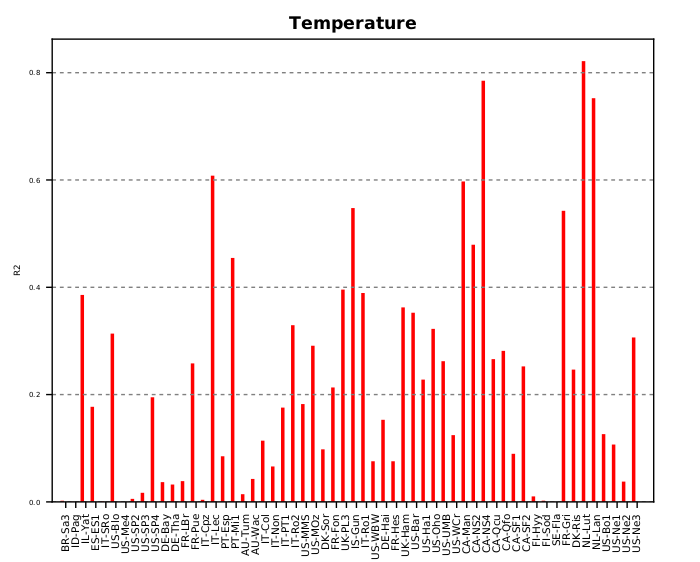
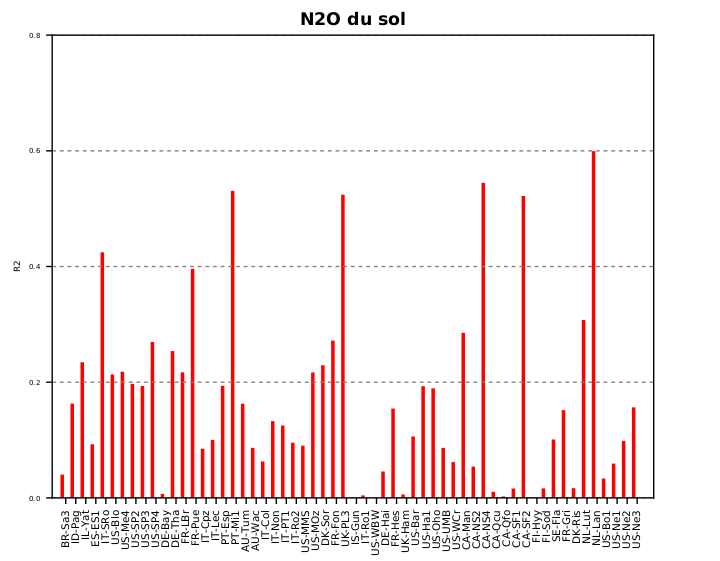
. Figure of correlation with NH3 emissions (except pH) obtained using "script_calcul_r2.ksh" to obtain the R2 and then bar_plot.py in order to create the figure ;
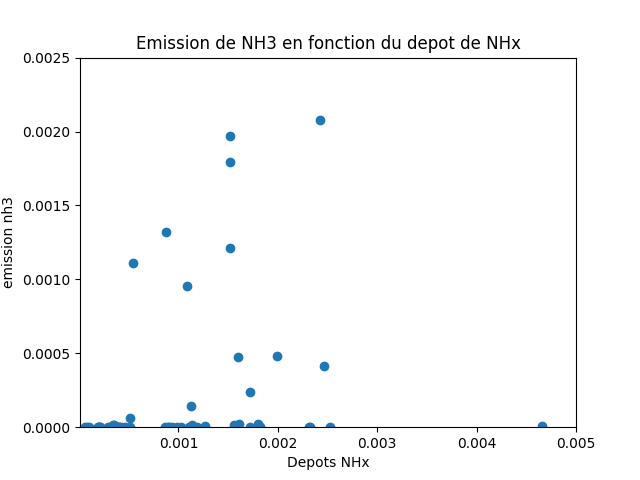
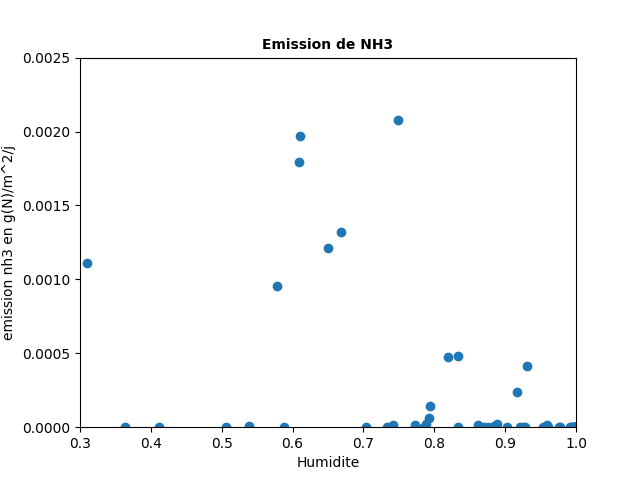
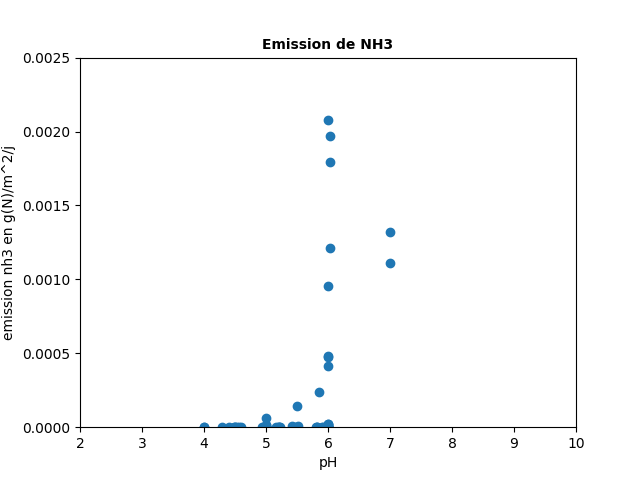
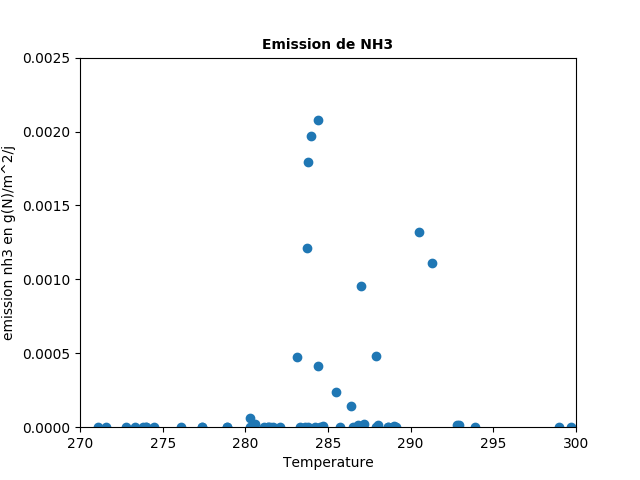
. Average emission of ammonia on each site in function of the parameter studied using "scatterplot.py" ;
. Text documents in which are listed the different values.
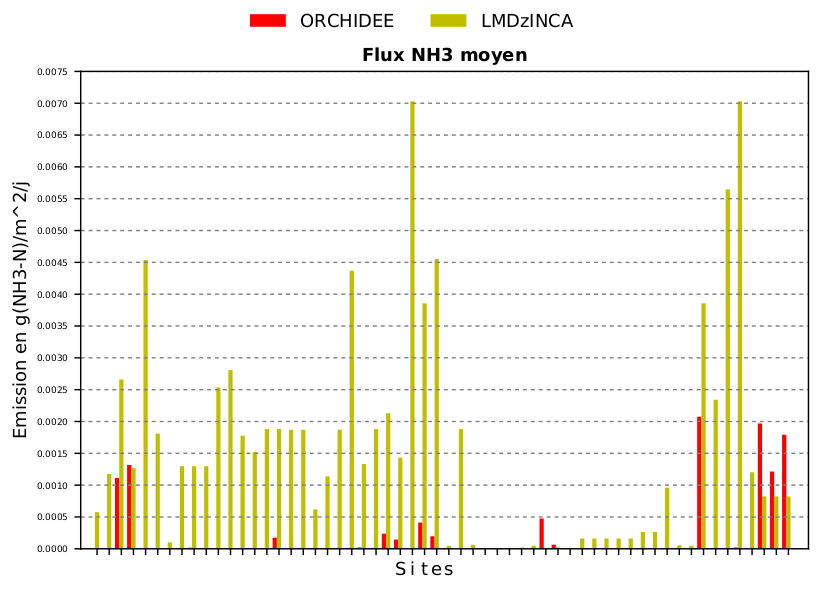
- Comparison with data used by LMDz-INCA model
path : /home/users/taudoux/documents/Results/Comparison/
Figure, created using "bar_plot_donnees.py", in which for each site are listed the average emission of NH3 for both model.
| Average emission of ammonia (g(NH3-N).m⁻².day⁻¹) on each site in function of the parameter considered | |||
|---|---|---|---|
| Temperature (K) | Humidity (-) | pH (-) | Deposition g(NHx).m-2 |
 |  |  | 
|
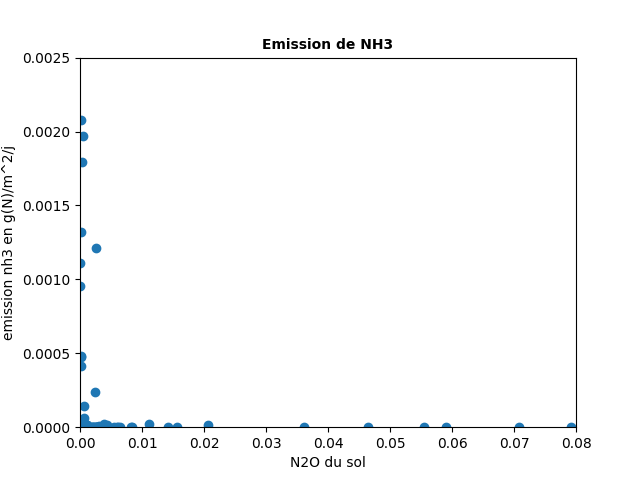
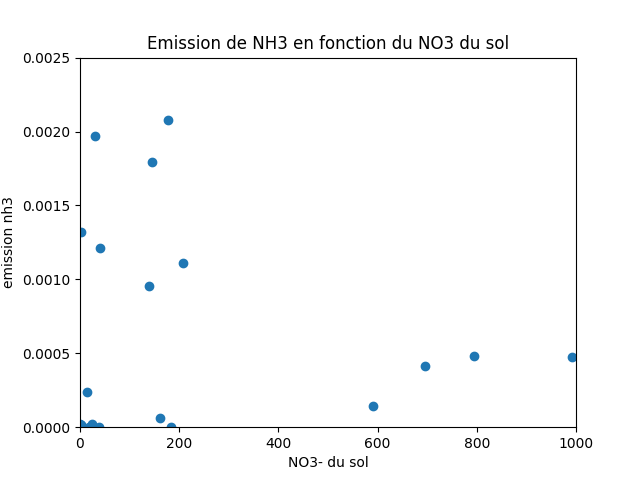
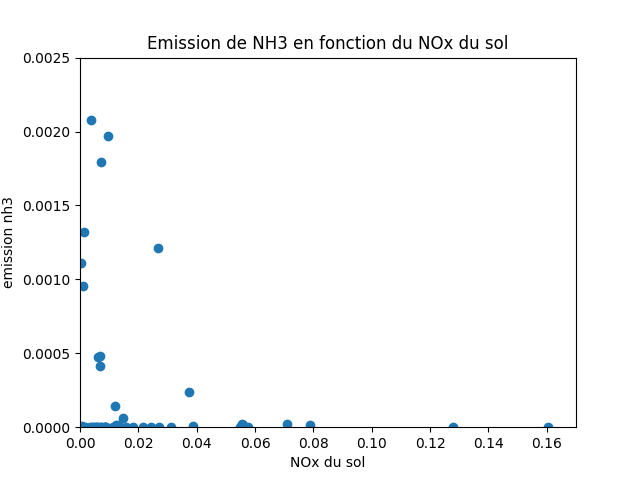
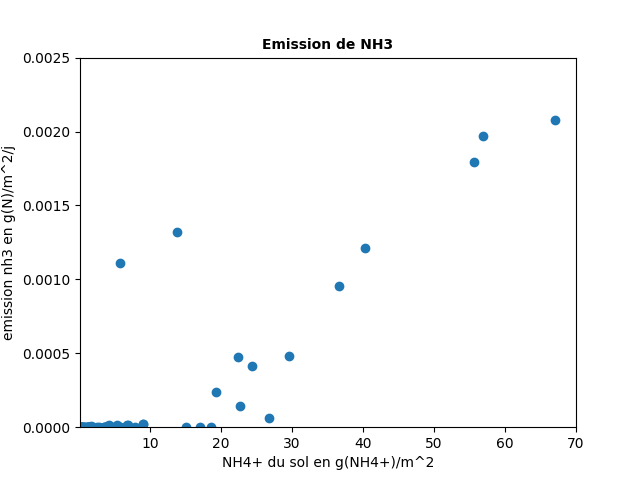
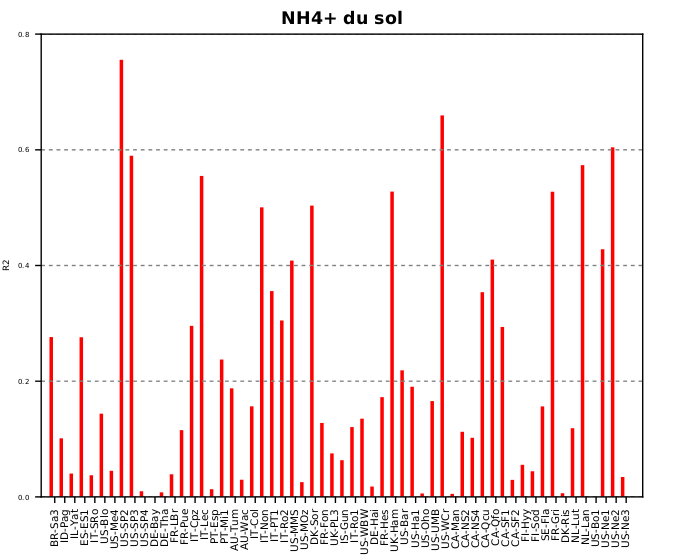
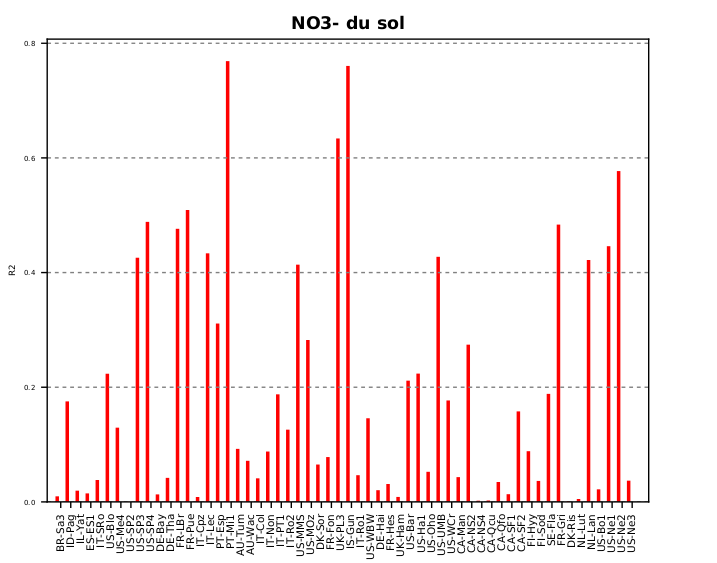
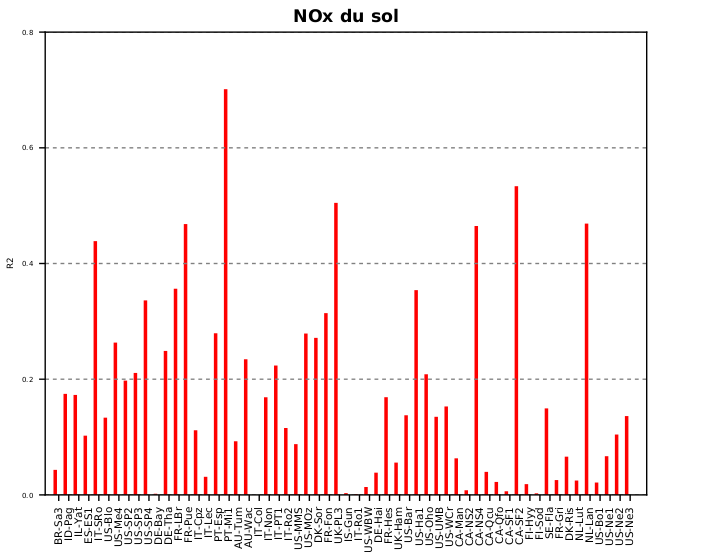
| SOIL NH4 g(NH4).m-2 | SOIL N2O g(N2O).m-2 | SOIL NOX g(NOx).m-2 | SOIL NO3 g(NO3).m-2 |
 |  |  | 
|
| Correlation with NH3 emissions (g(NH3-N).m⁻².day⁻¹) | |||
|---|---|---|---|
| Temperature (K) | Humidity (-) | Deposition g(NHx).m-2 | |
 |  |  | |
| SOIL NH4 g(NH4).m-2 | SOIL N2O g(N2O).m-2 | SOIL NOX g(NOx).m-2 | SOIL NO3 g(NO3).m-2 |
 |  |  | 
|
| Comparison with LMDz-INCA model's data |
|---|

|
Evaluation of ammonia emissions results calculated by the model (Fertilizer added)
Code was changed : separation of nitrogen input. Initially fertilizer, bnf and atmospheric deposition were in the same loop.
Multiple simulations were run with different amount of fertilizer (0 , 0.015, 0.0225, 0.03, 0.0375, 0.045 , 0.0525, 0.06 and 0.1 g.m-2.day-1). Each simulation were run with two different ratio of NH4 in the fertilizer : 0.5 and 0.8.
We obtain same results when nfert=0 or when nfert is not precised.
- Sites we looked at and their PFT :
| PFT | Sites |
|---|---|
| 12 | FR-Gri ; DK-Ris ; NL-Lut |
| 13 | NL-Lan ; US-Bo1 ; US-Ne1 ; US-Ne2 ; US-Ne3 |
- Parameters studied
General path : path : /home/users/taudoux/documents/Results/B/Simul_ratio0.5_v1/ or /home/users/taudoux/documents/Results/B/Simul_ratio0.8_v1/
Temperature, Humidity in the folder Parameters/
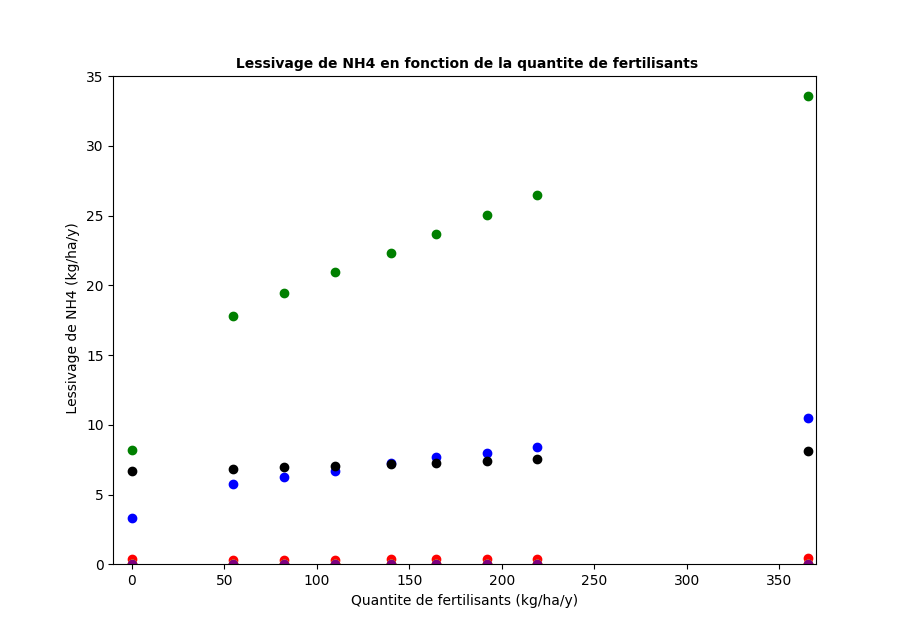
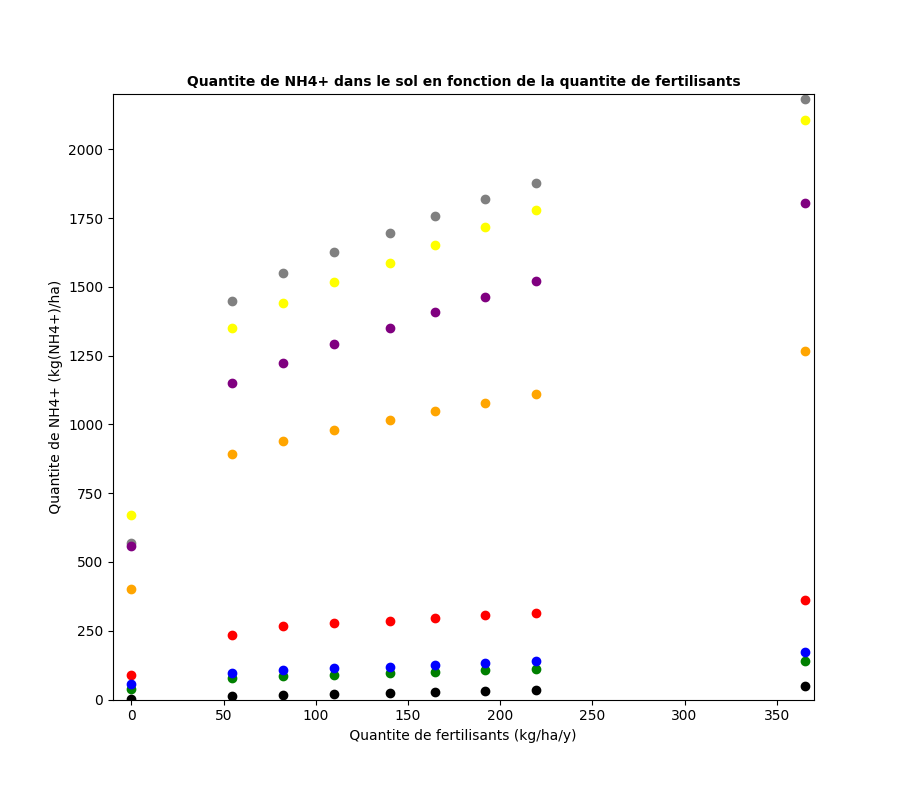
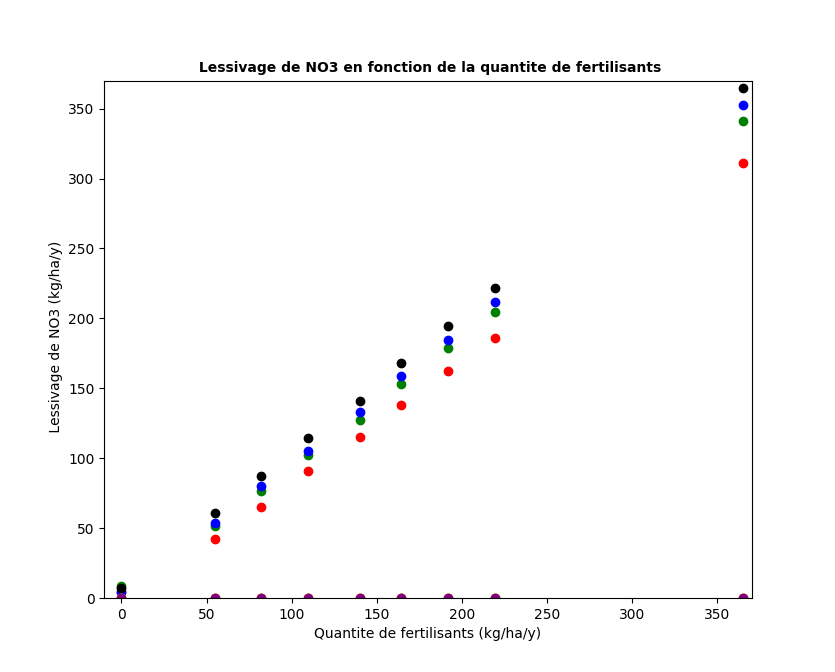
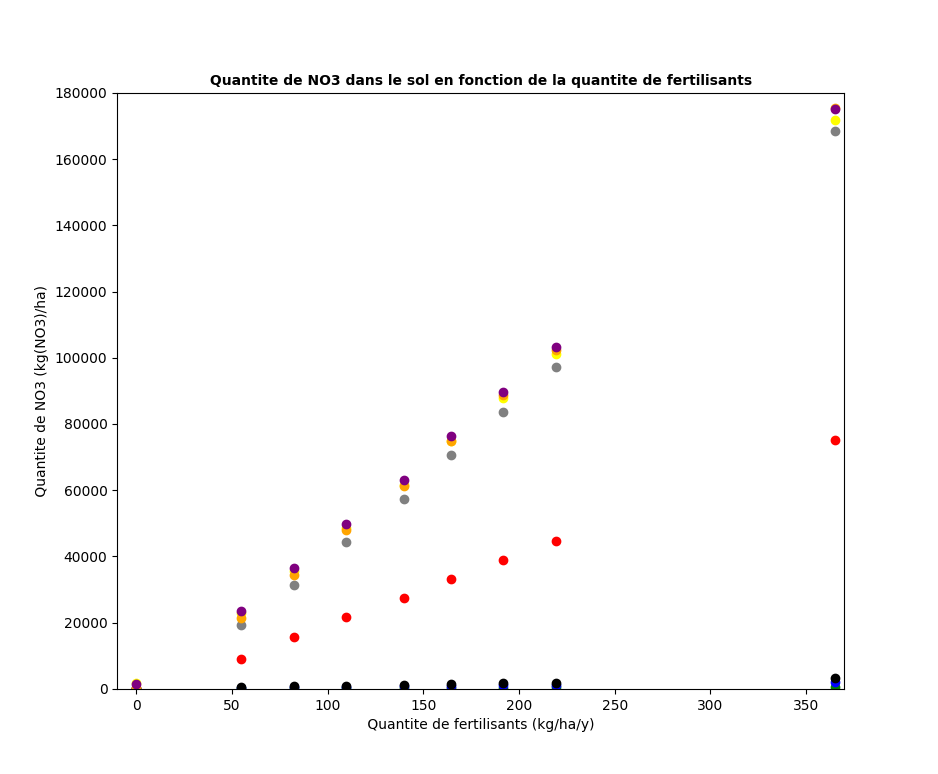
Nitrogen Pools (Soil_NH4, Soil_NO3, Soil_NOX and Soil_N2O) and Leaching (NH4 and NO3) in the folder Pools_fluxes/
Emissions (NH3, N2, N2O, NOx) in the folder NH3_EM/
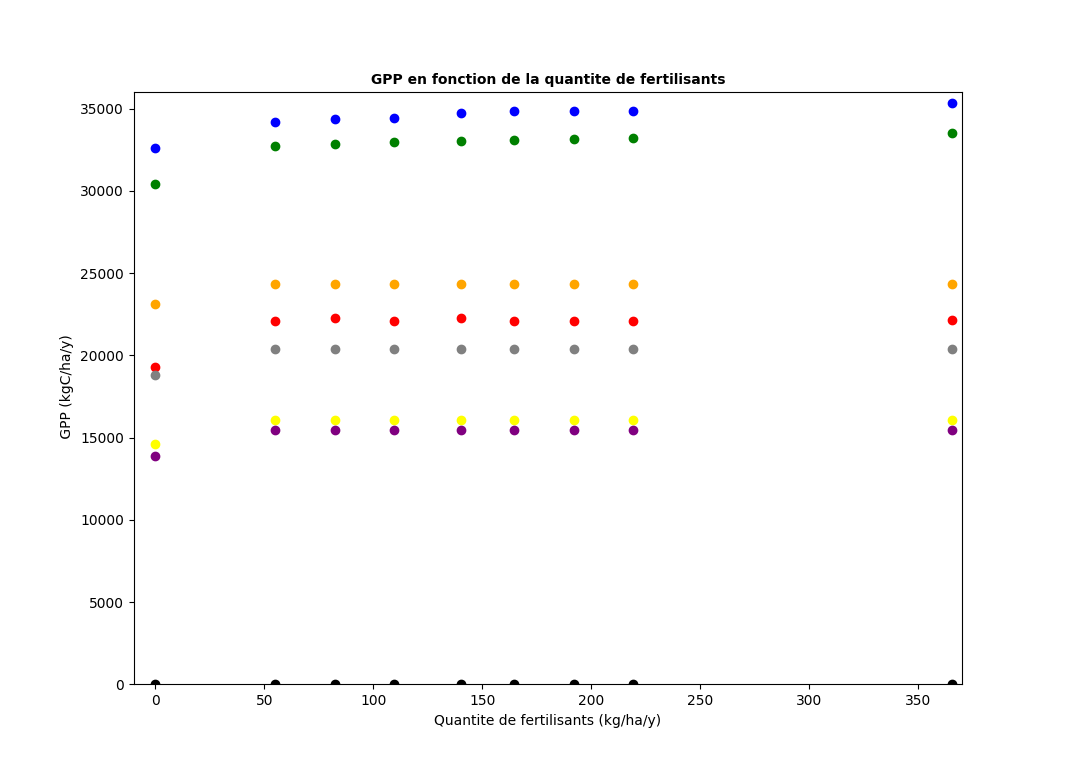
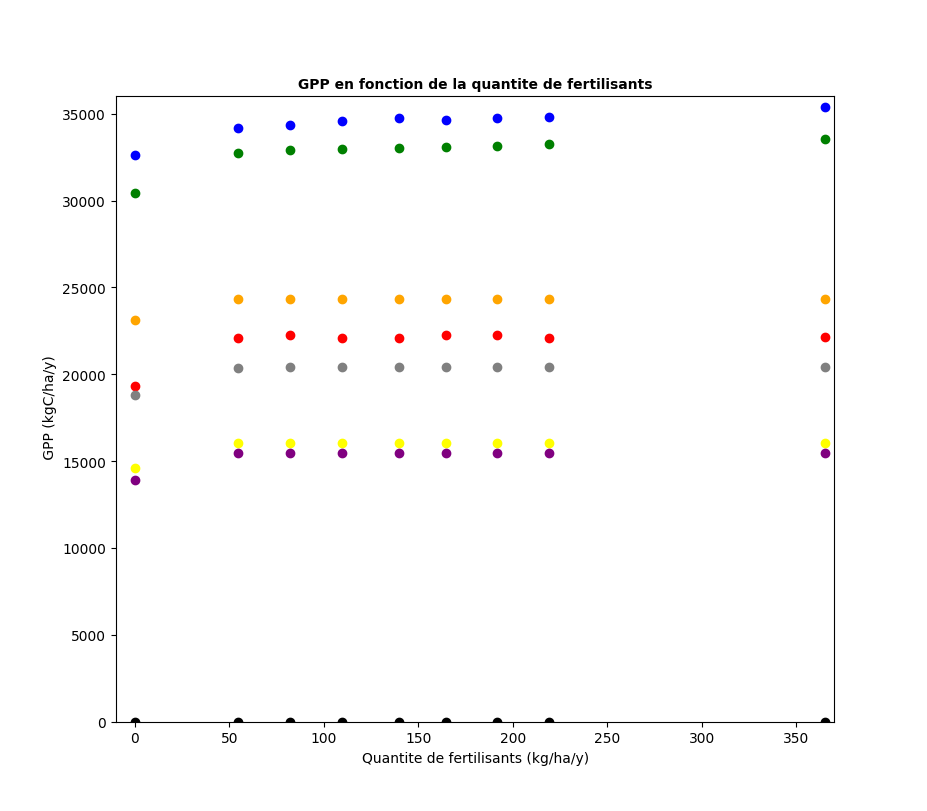
GPP in the folder GPP/
Nitrogen input summed (fertiliser, NHx and NOx depositions) in the folder DEP_FERT/
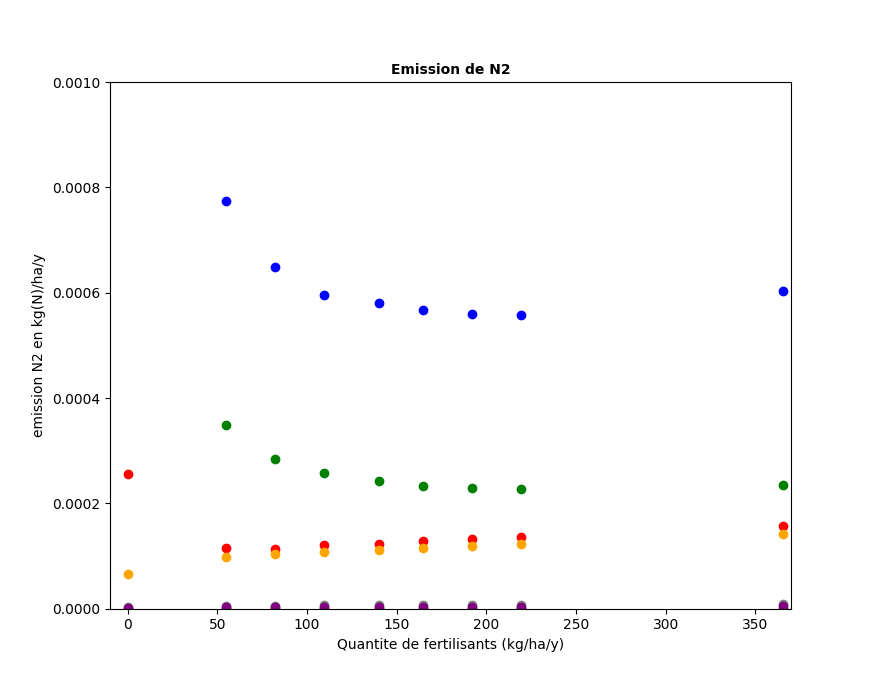
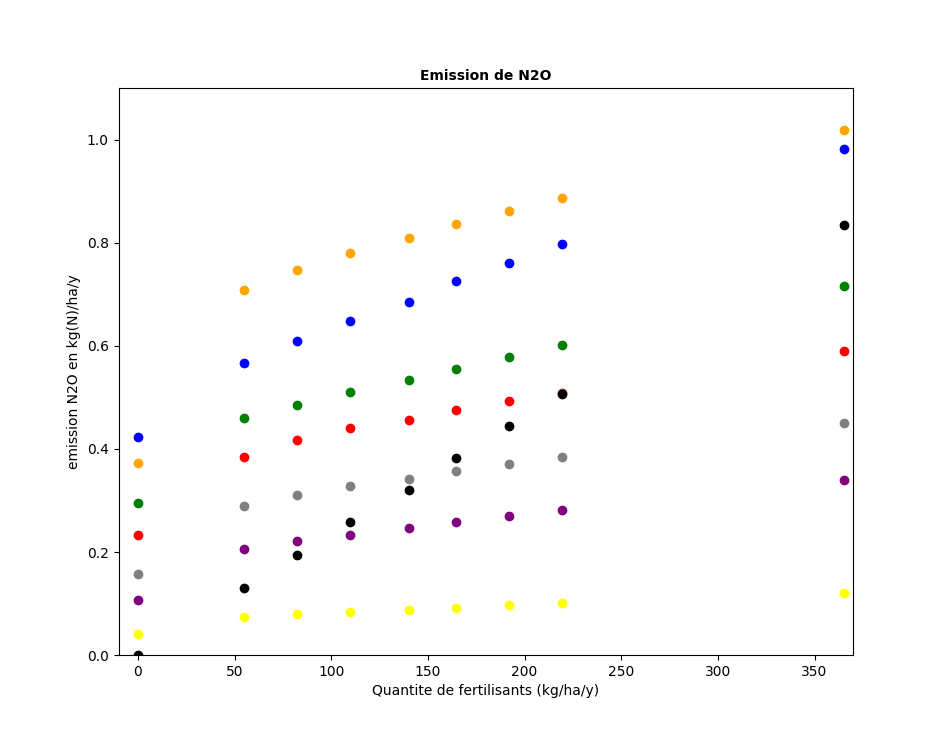
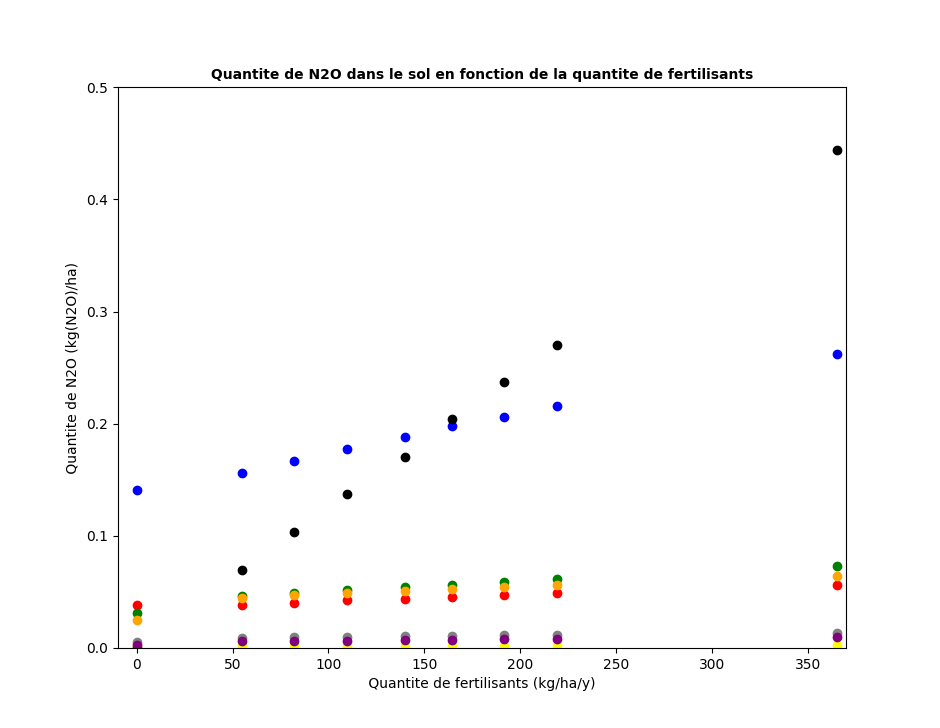
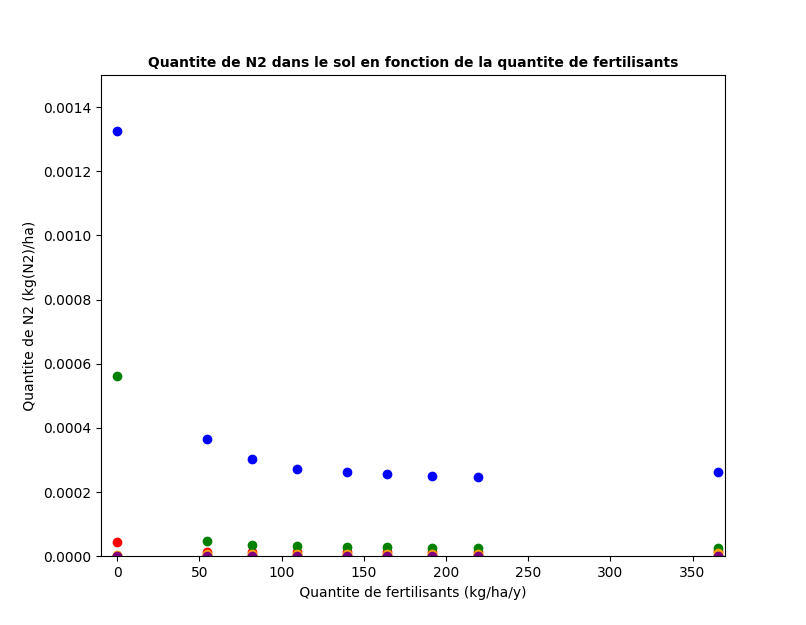
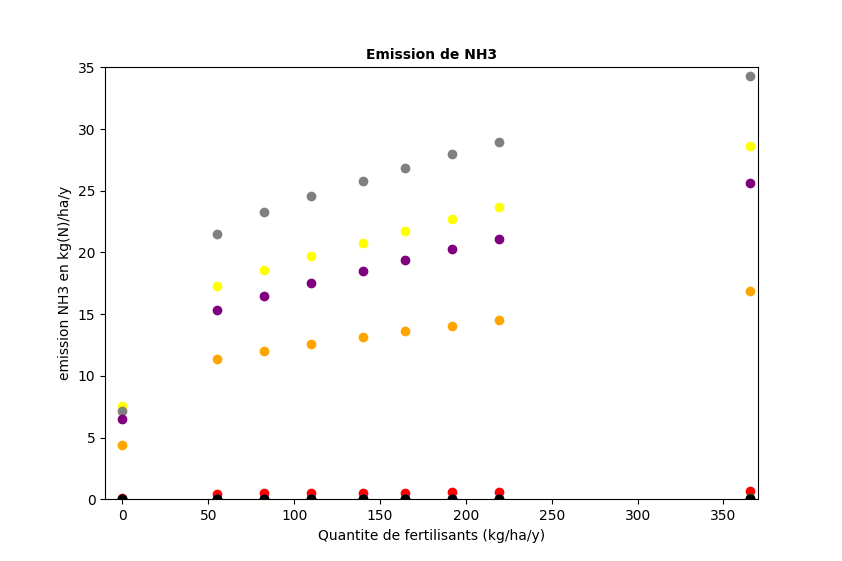
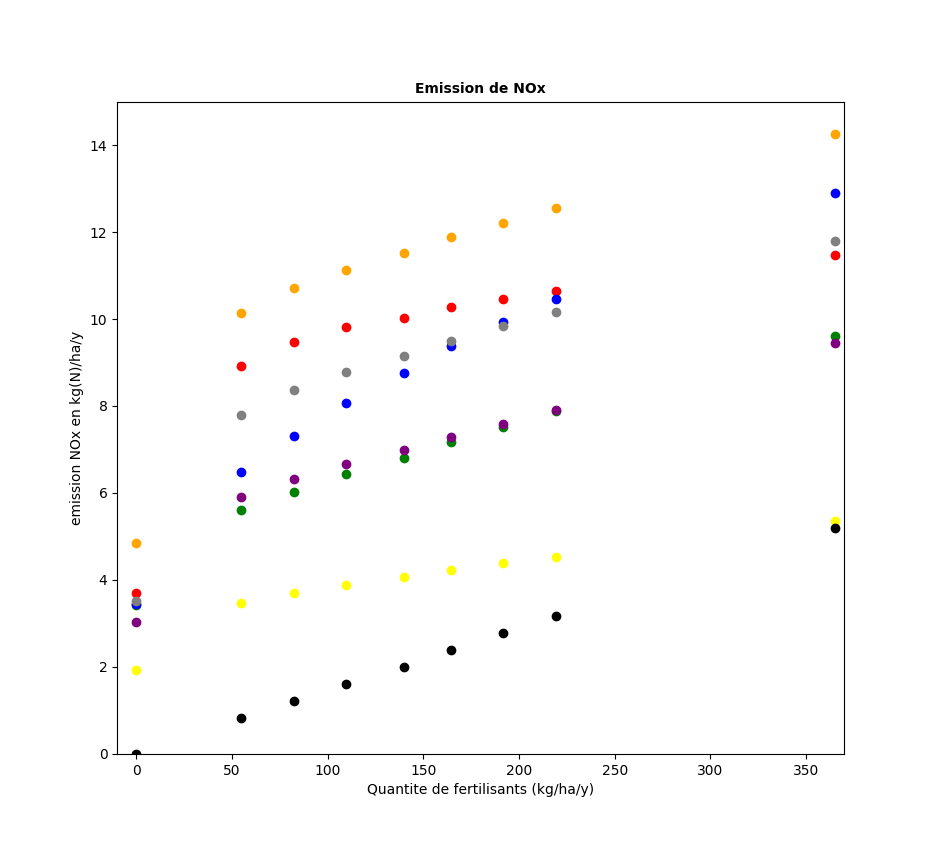
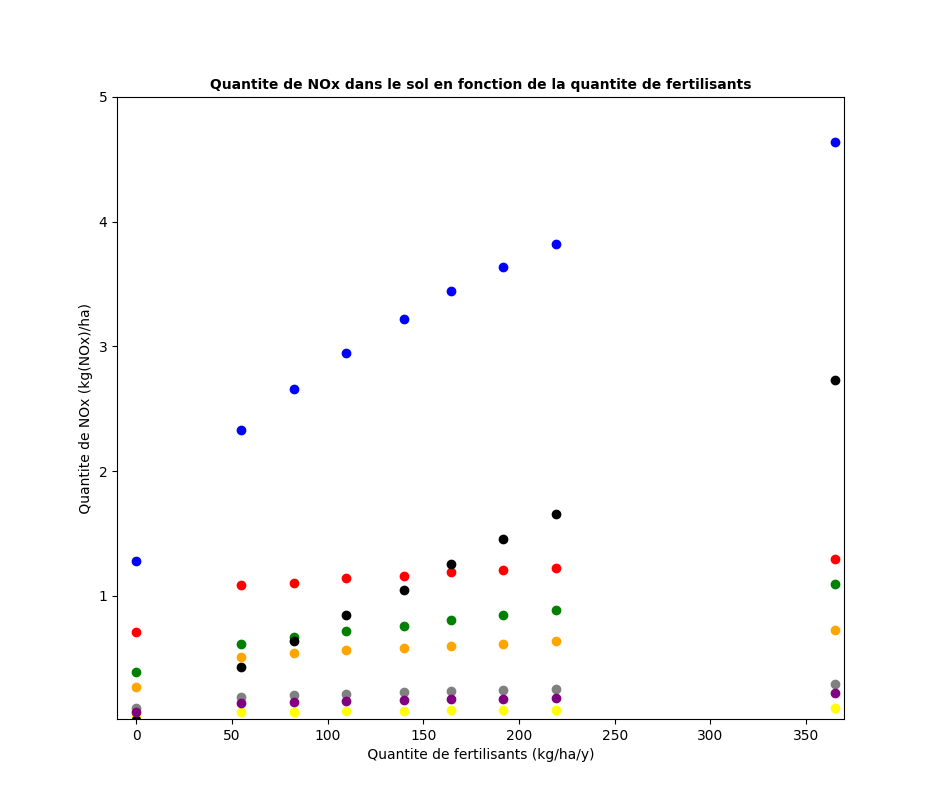
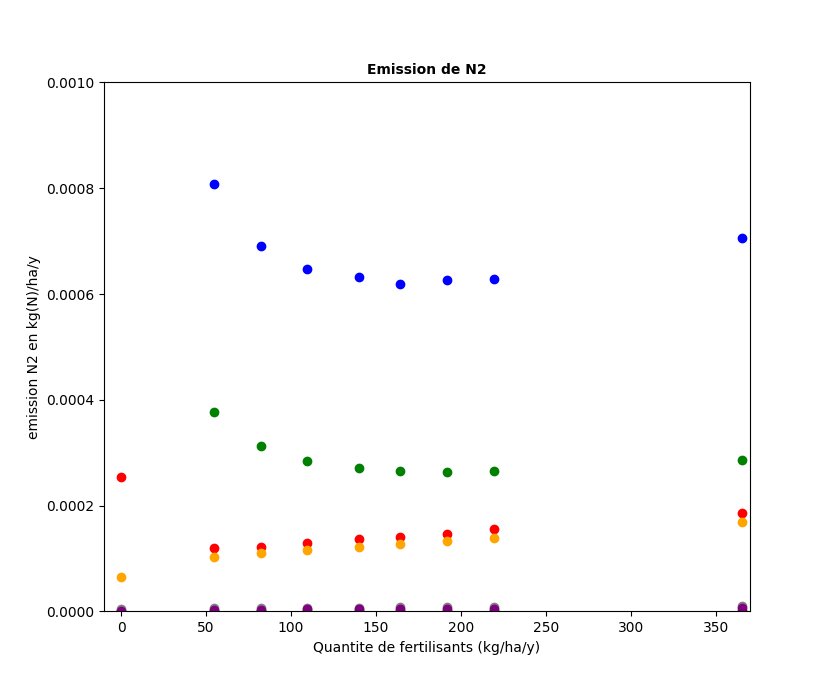
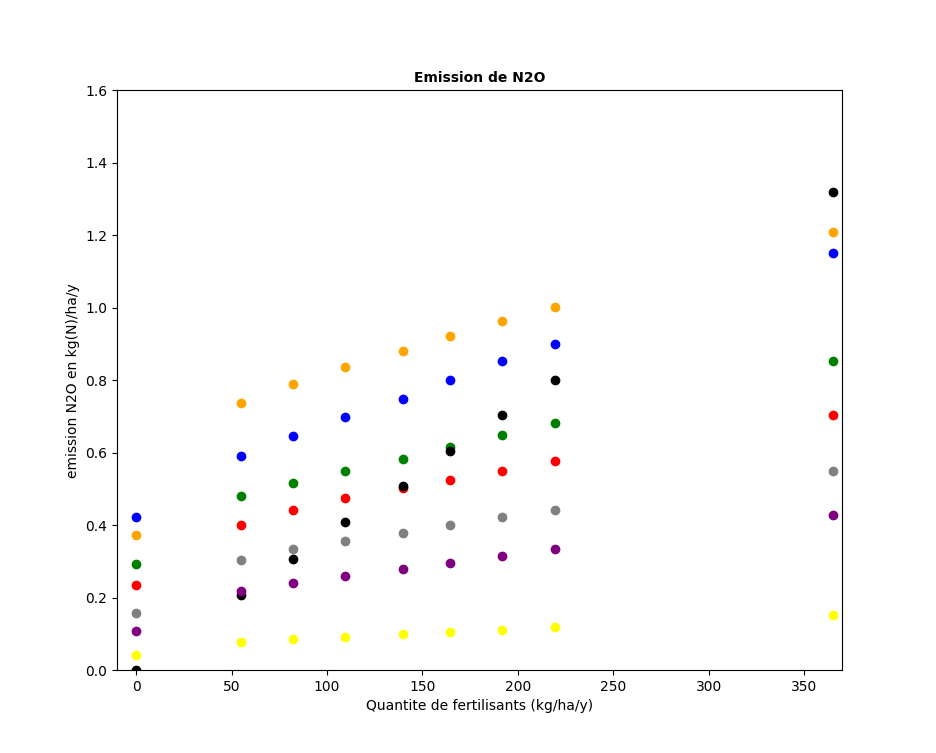
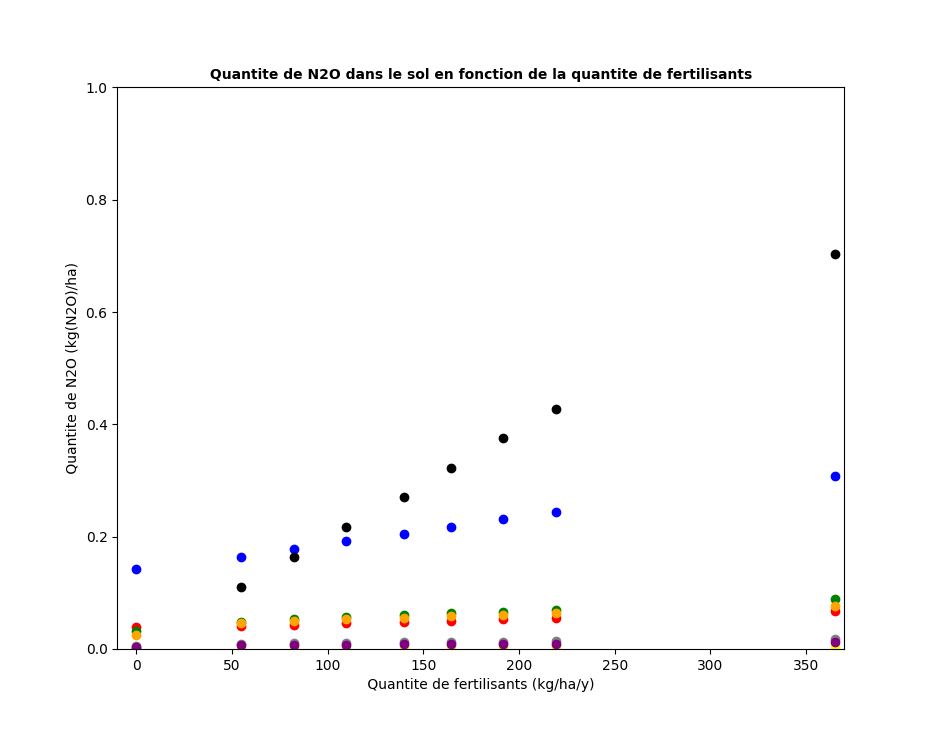
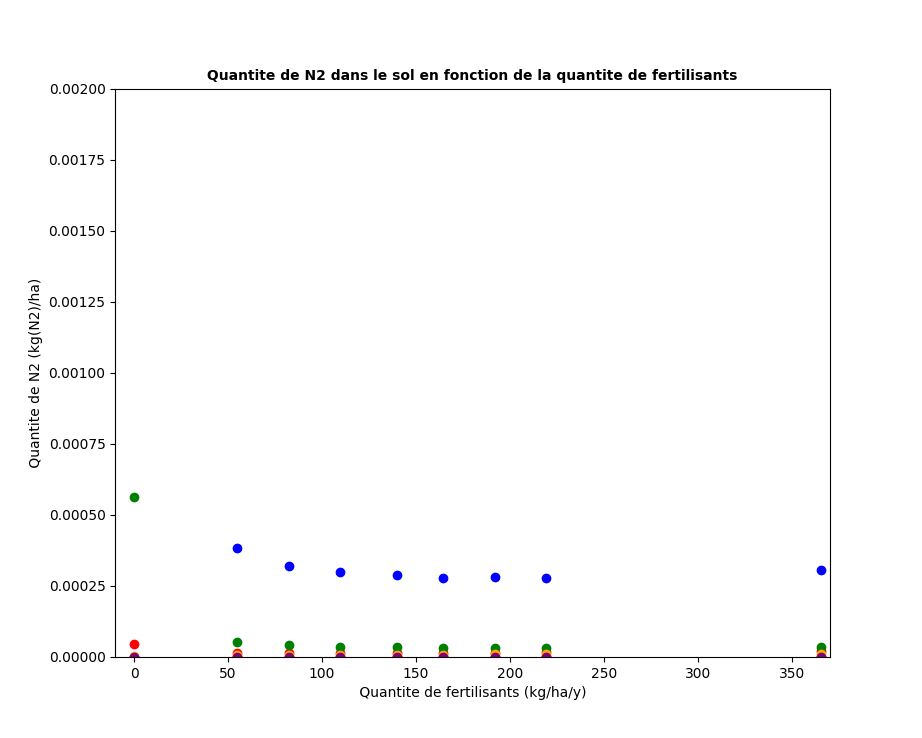
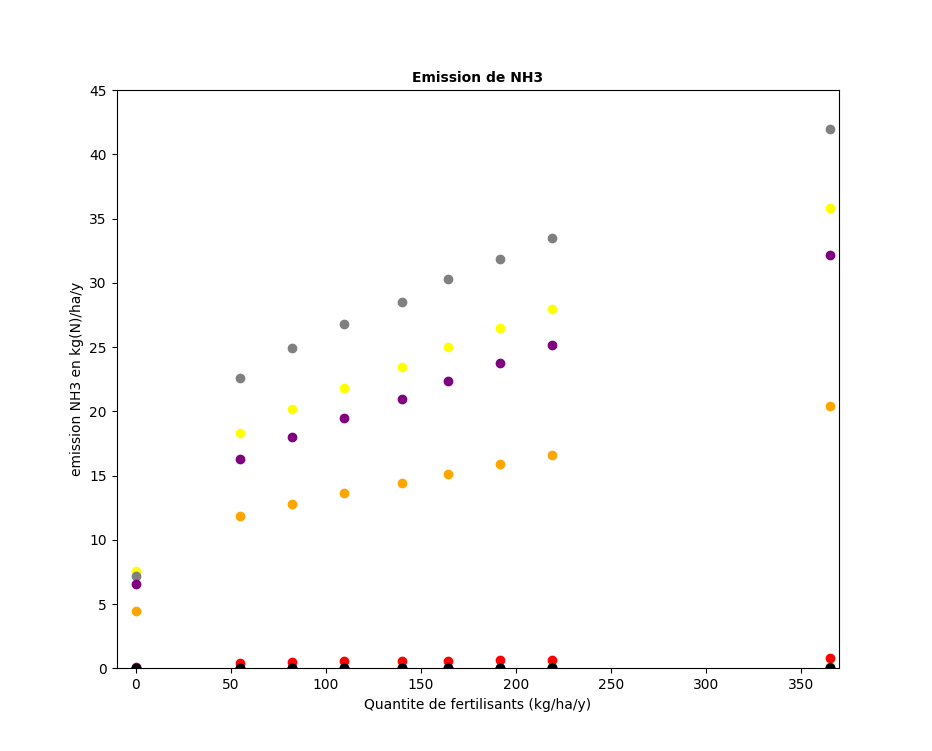
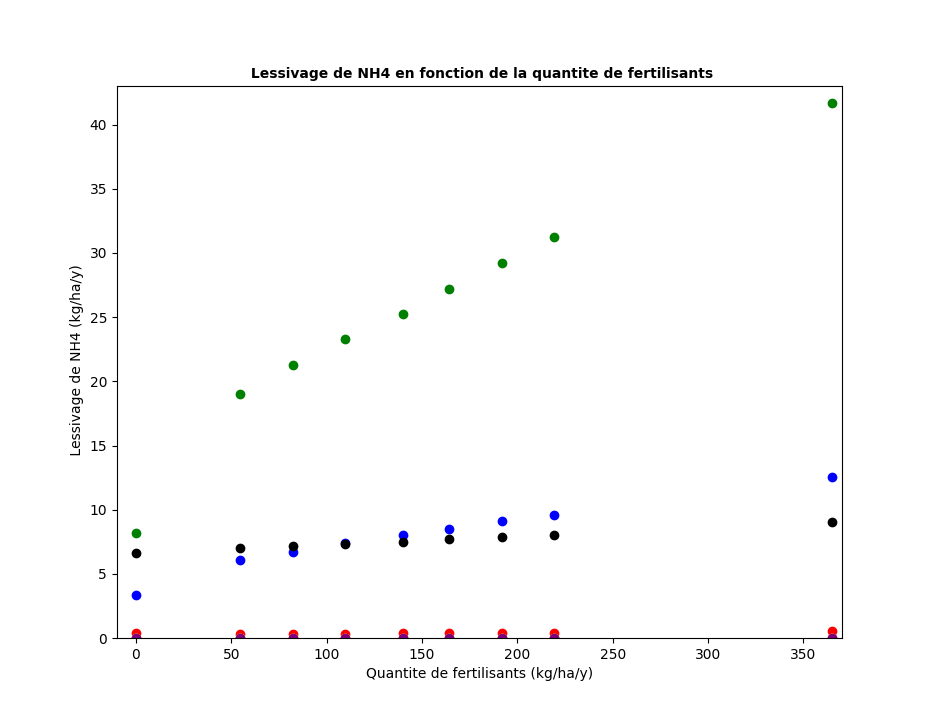
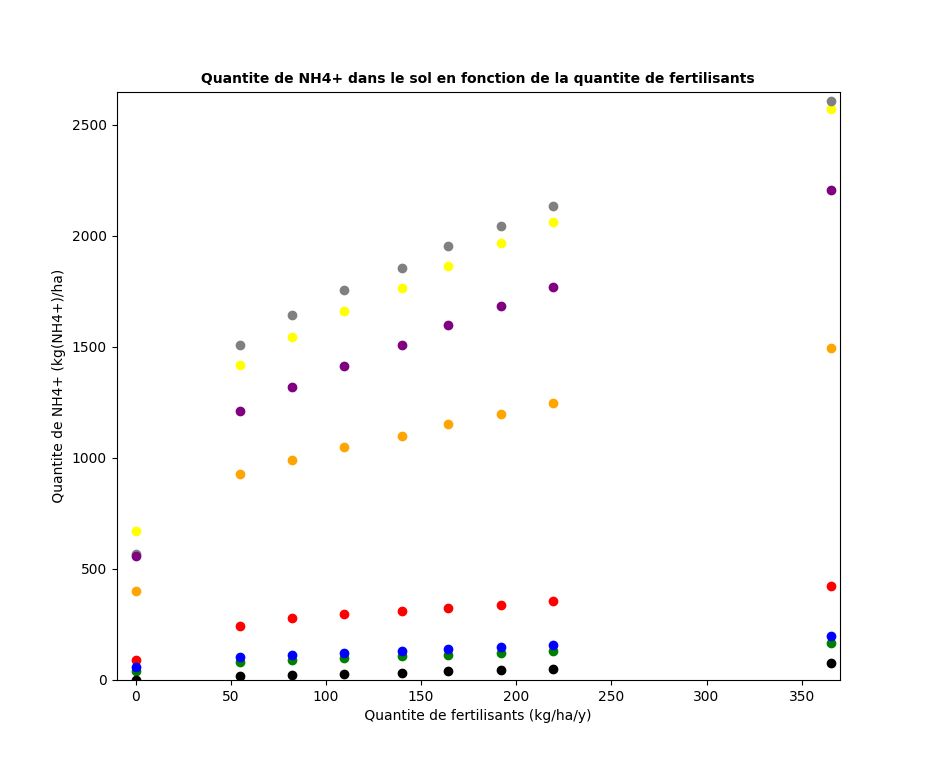
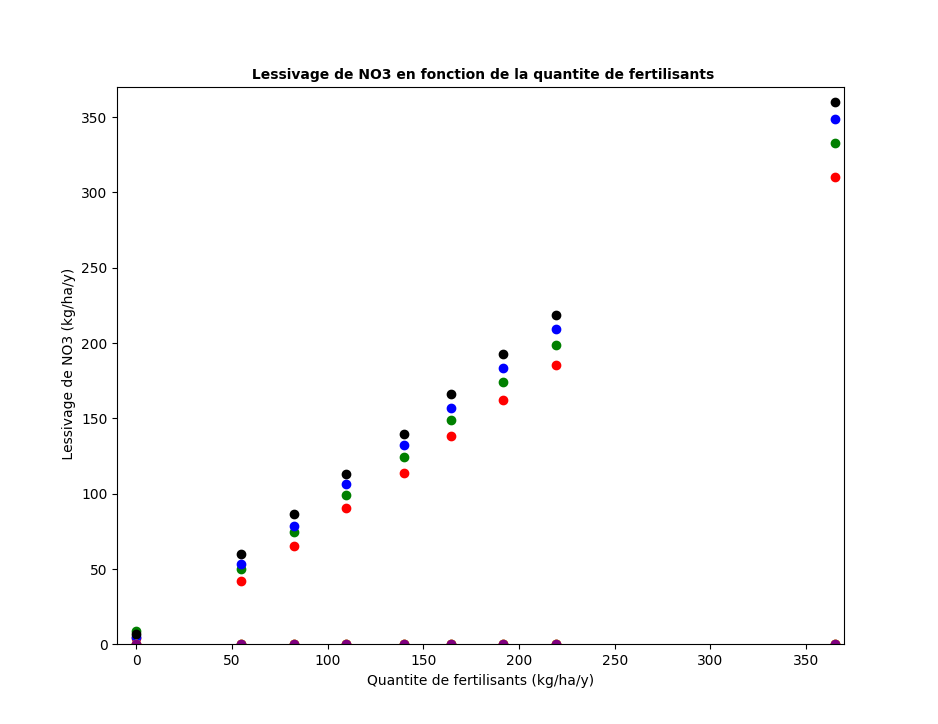
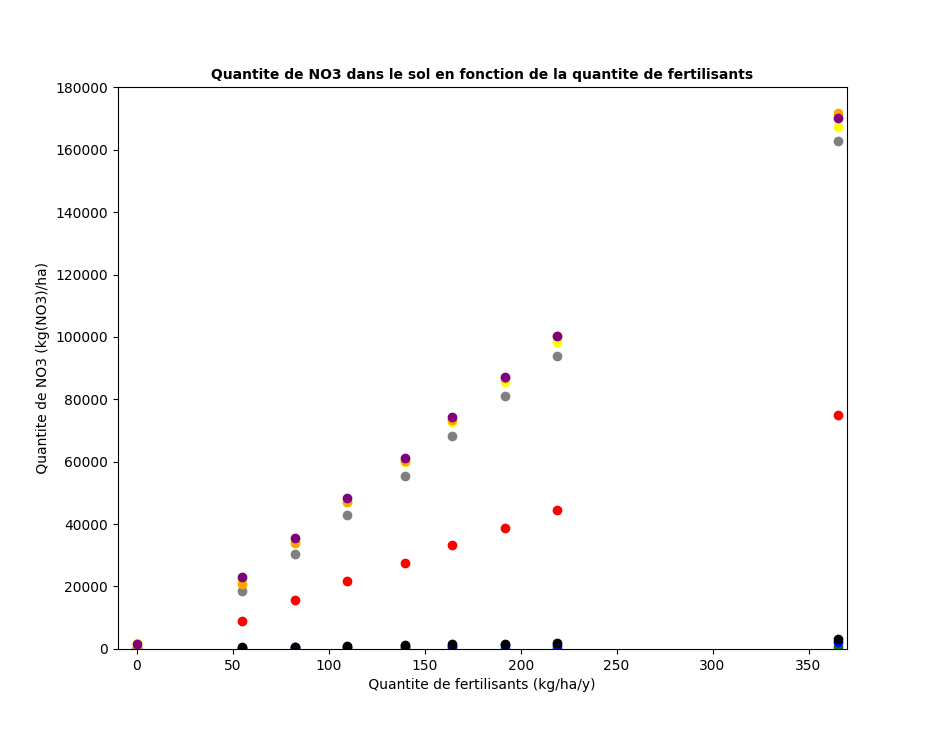
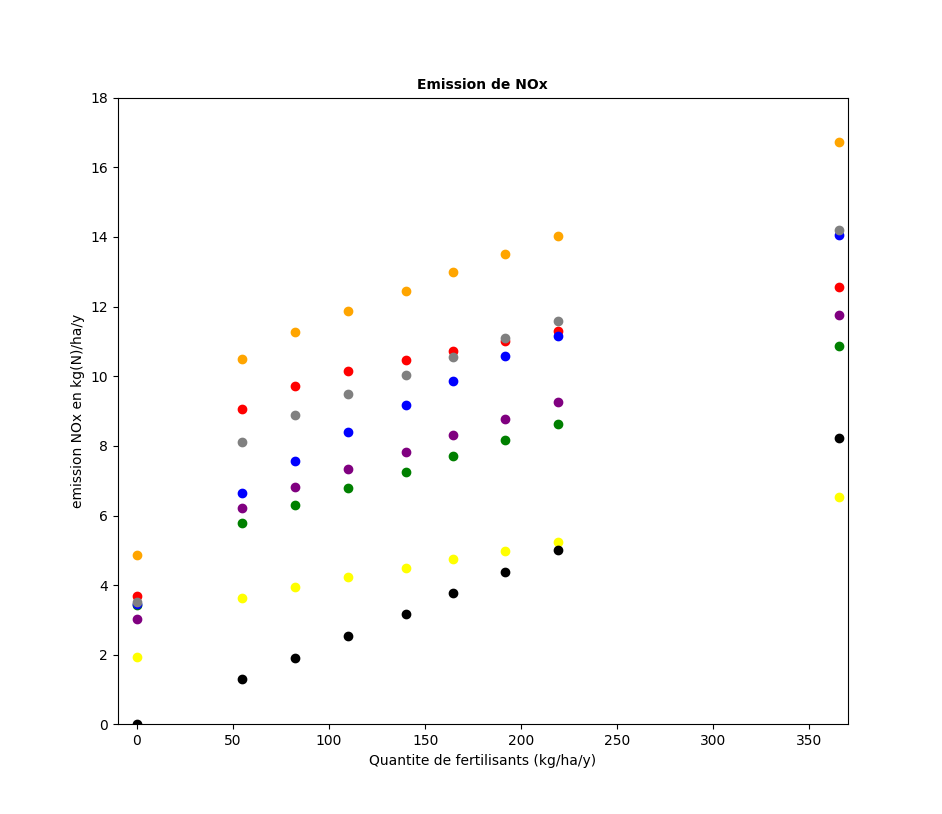
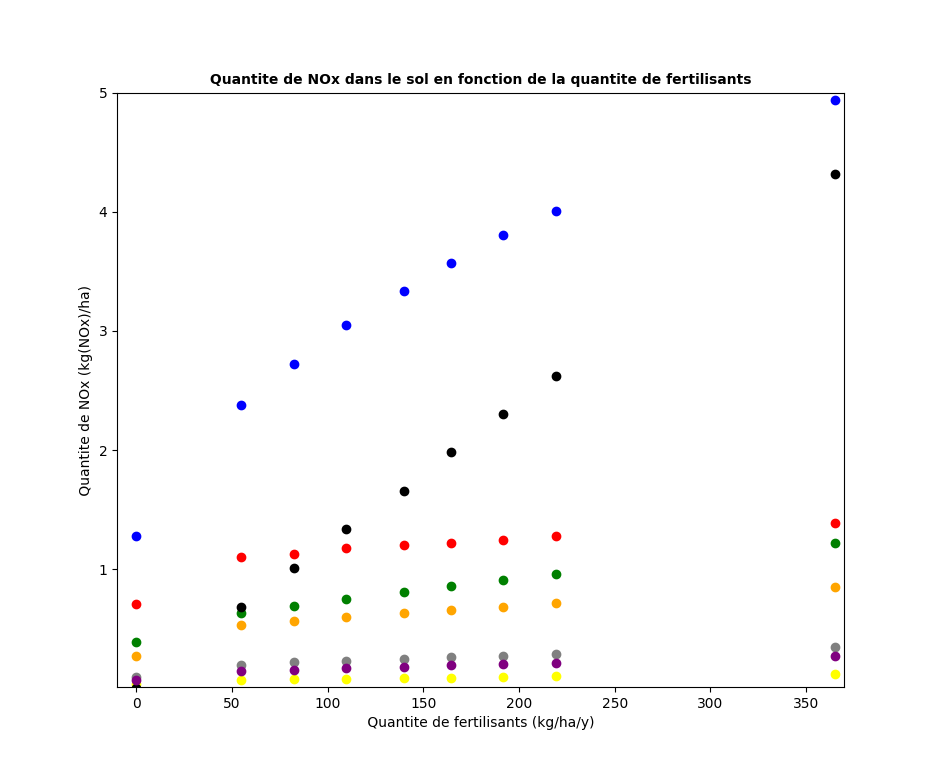
We looked at how those parameters evolved in each site with the amount of fertilizer with both of ammonium's percentage in the fertilizer (0.5 and 0.8).
Script used : scatterplot_X.py in the folders
/home/users/taudoux/documents/Results/B/Simuls_ratio0.5_v1/Graph/
/home/users/taudoux/documents/Results/B/Simuls_ratio0.8_v1/Graph/
X = em_n2 ; em_n2o ; em_nh3 ; em_nox ; GPP ; leaching_nh4 ; leaching_no3 ; pools_n2 ; pools_n2o ; pools_nh4 ; pools_no3 ; pools_nox.
| N2 emission | N2O emission | NH3 emission | NOx emission | ||||
|---|---|---|---|---|---|---|---|
| 0.5 | 0.8 | 0.5 | 0.8 | 0.5 | 0.8 | 0.5 | 0.8 |
 |  |  |  |  |  |  | 
|
| Soil N2 | Soil N2O | Soil NH4 | Soil NOx | ||||
| 0.5 | 0.8 | 0.5 | 0.8 | 0.5 | 0.8 | 0.5 | 0.8 |
 |  |  |  |  |  |  | 
|
| NH4 leaching | NO3 leaching | Soil NO3 | GPP | ||||
| 0.5 | 0.8 | 0.5 | 0.8 | 0.5 | 0.8 | 0.5 | 0.8 |
 |  |  |  |  |  |  | 
|
Legend :
. Red = DK-Ris
. Yellow = FR-Gri
. Green = NL-Lan
. Blue= NL-Lut
. Black= US-Bo1
. Gray = US-Ne1
. Orange = US-Ne2
. Purple = US-Ne3
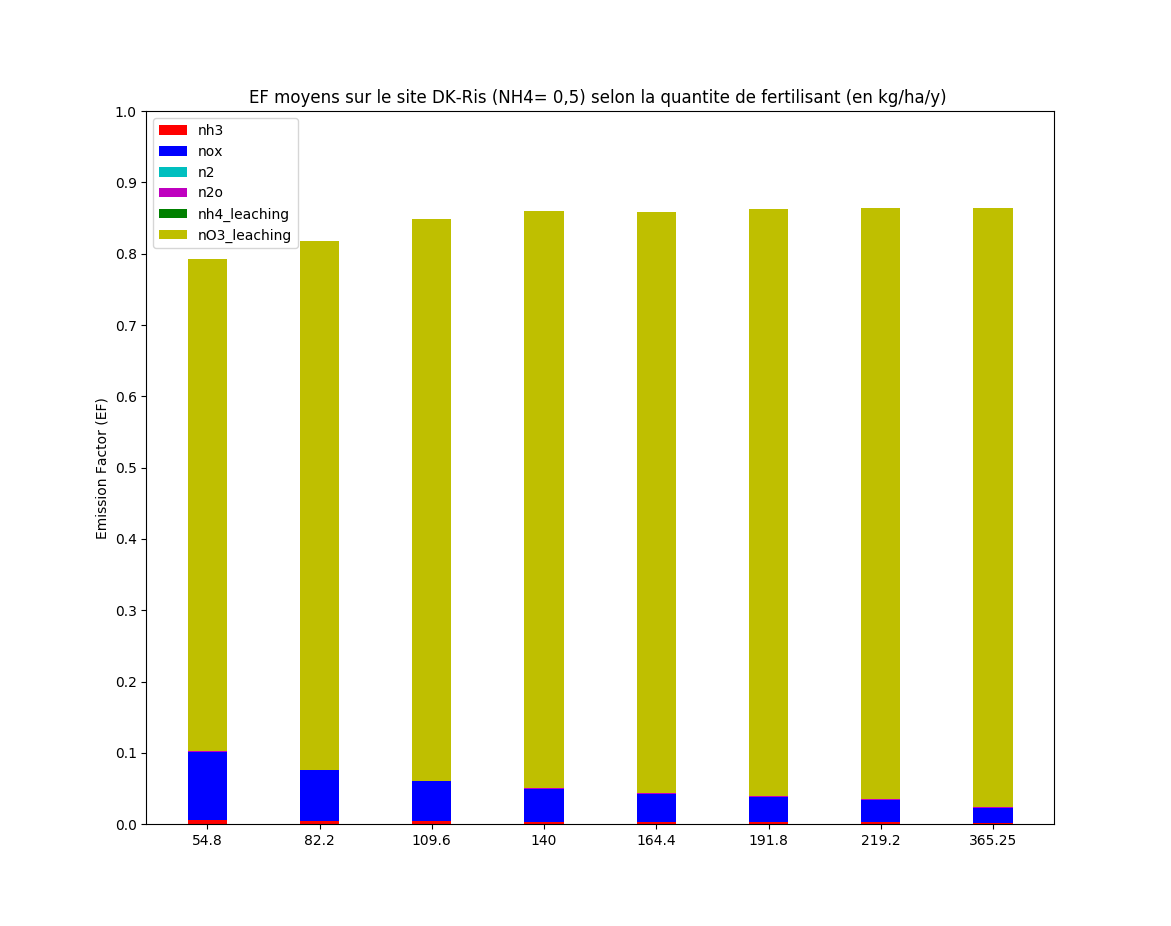
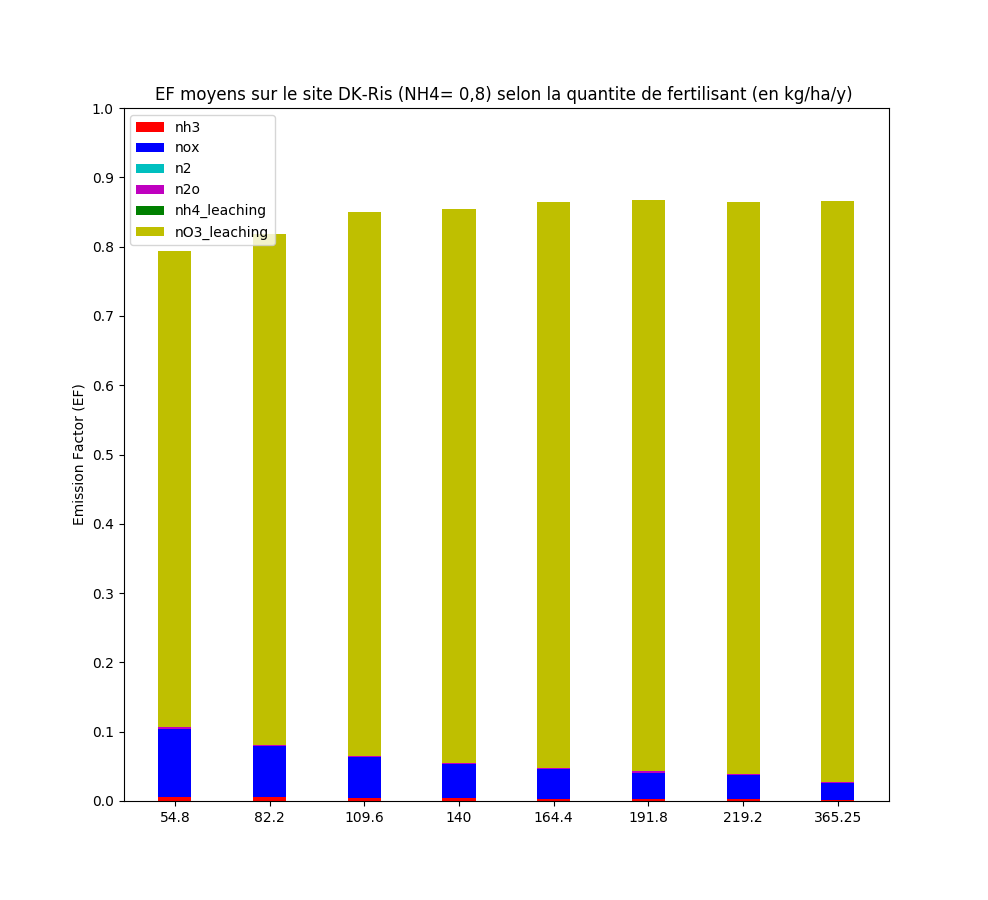
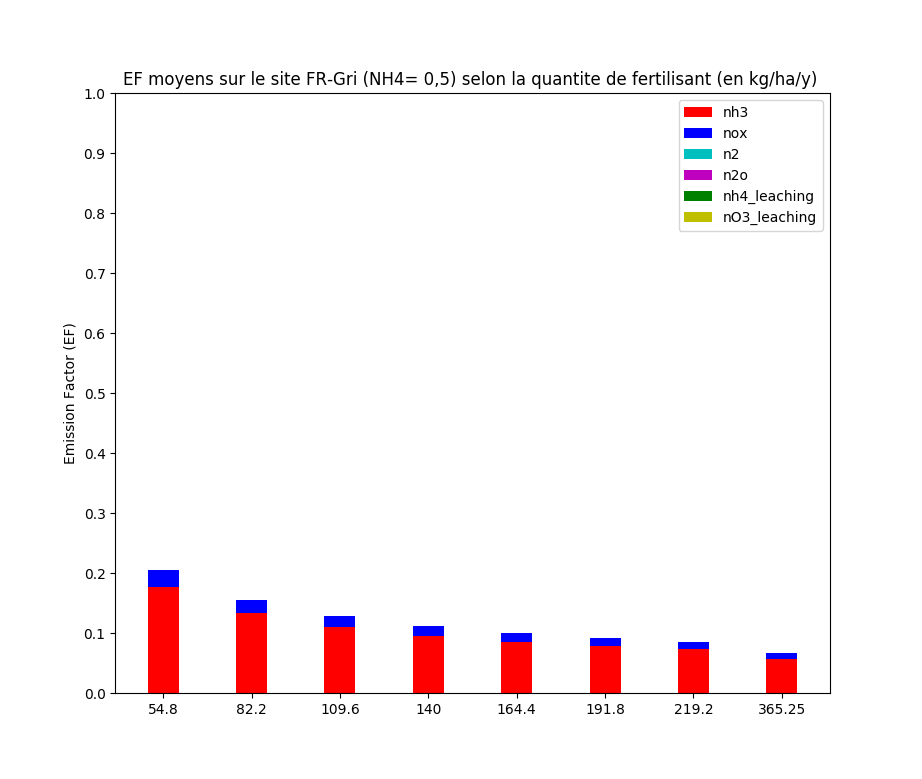
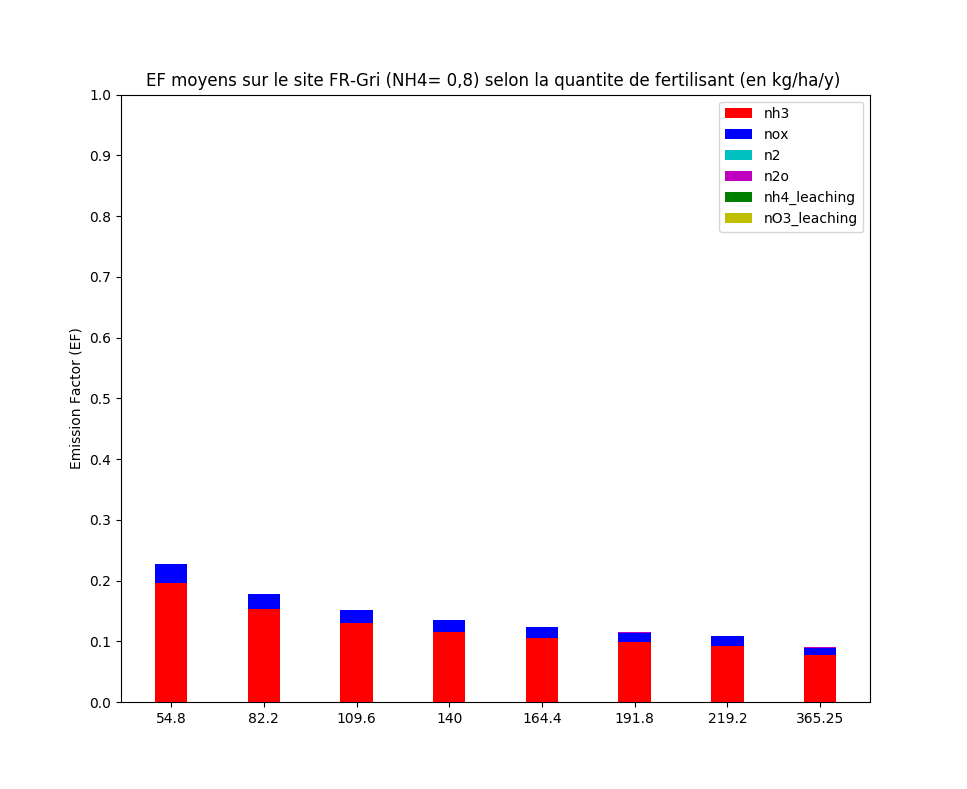
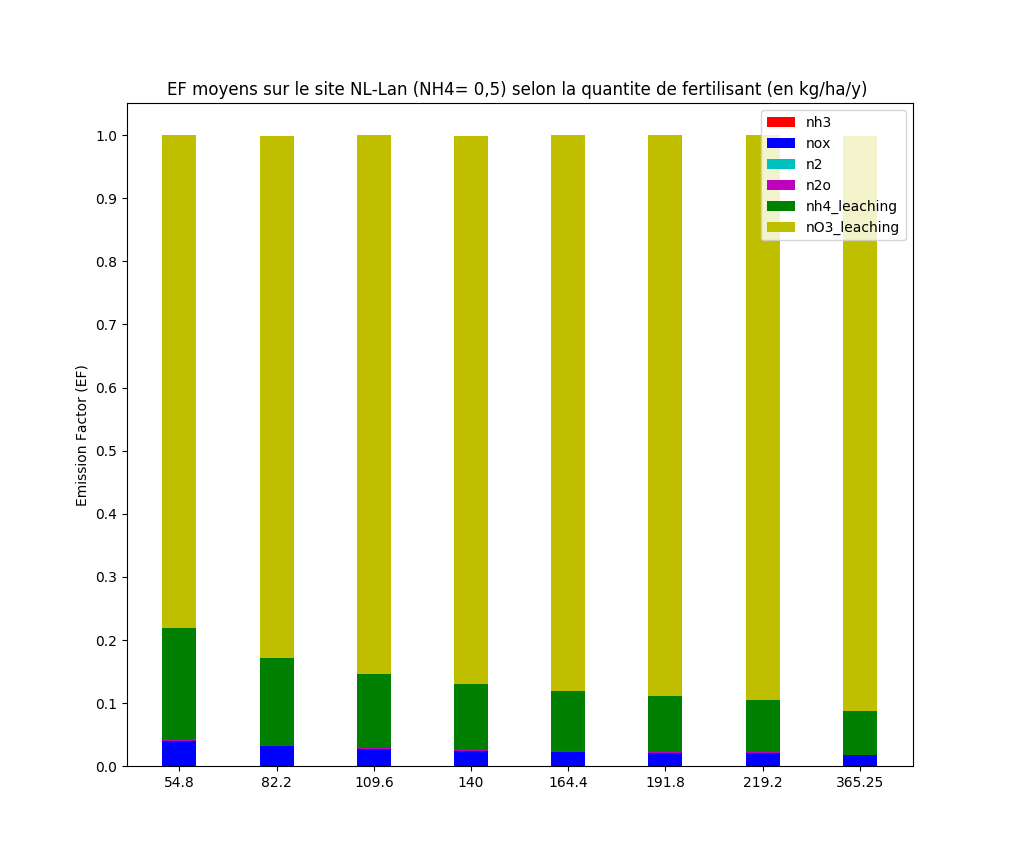
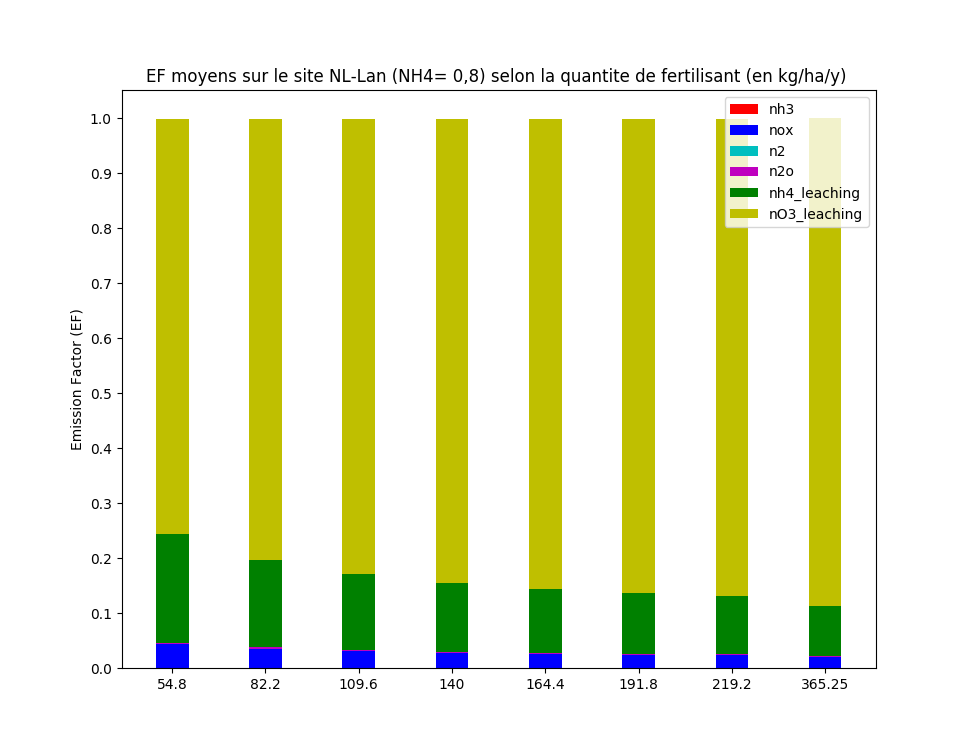
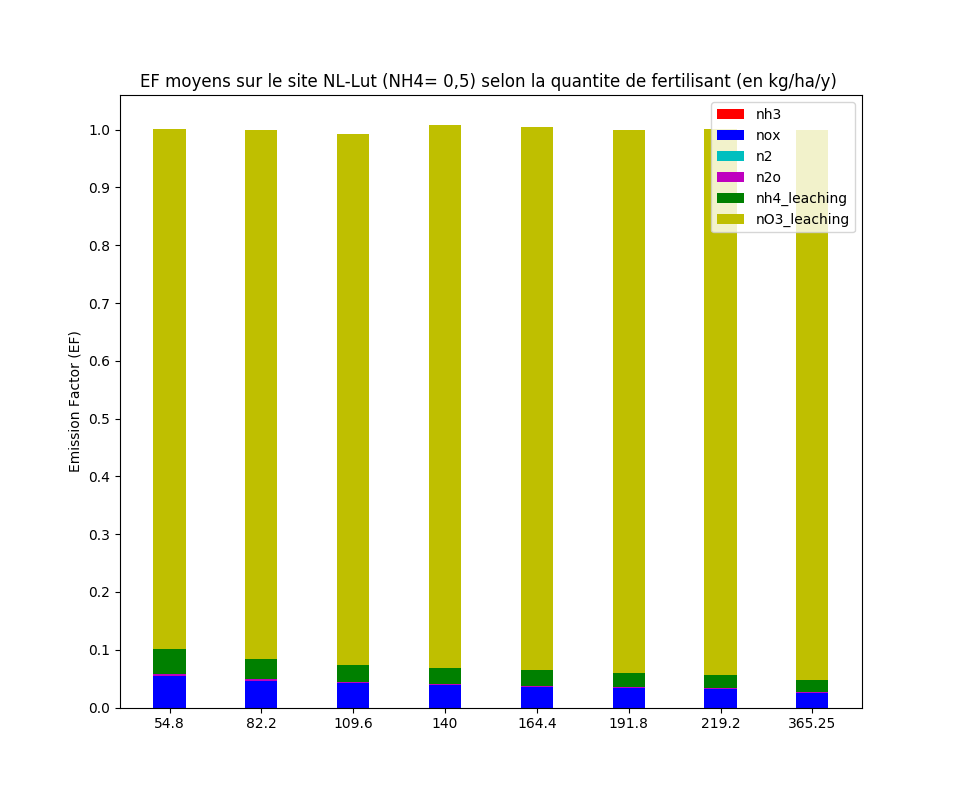
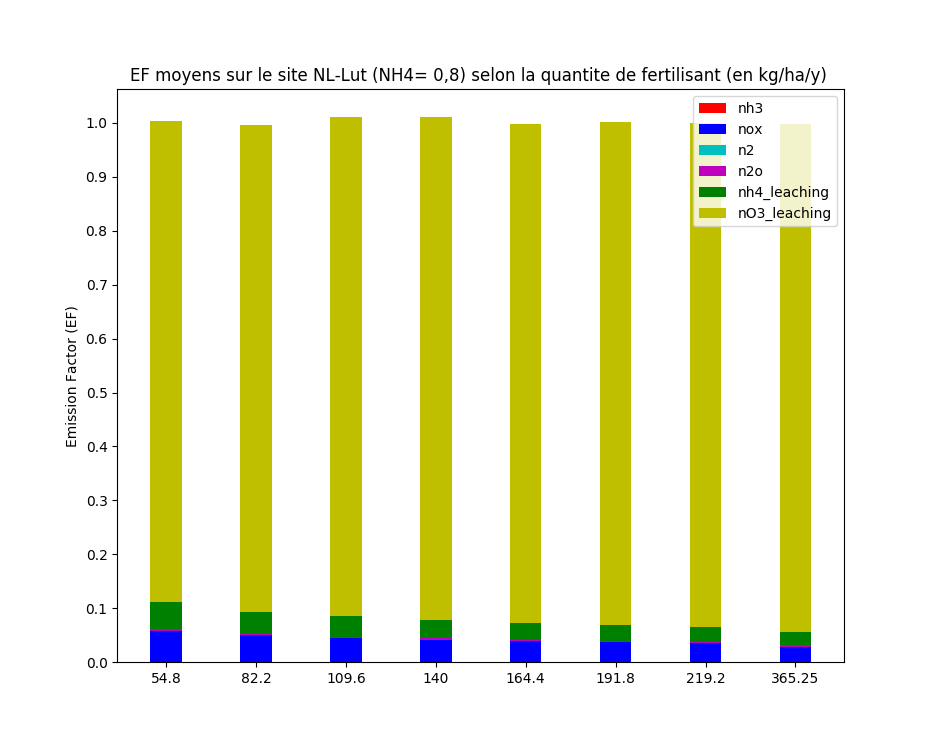
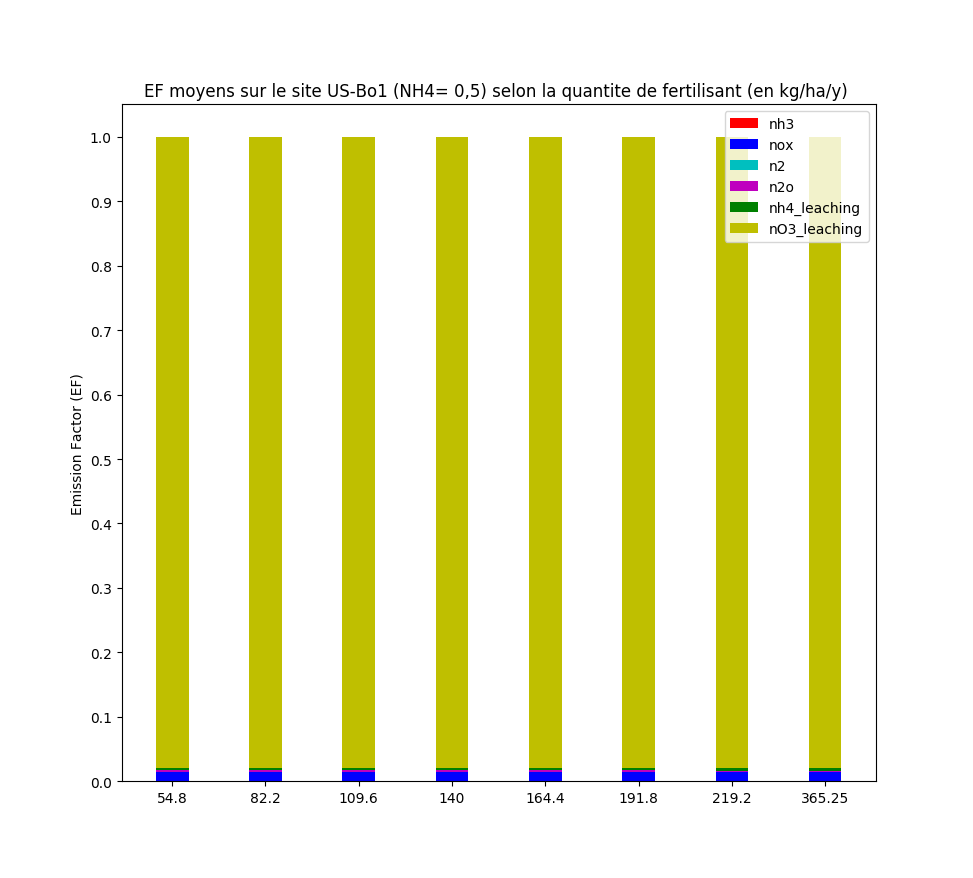
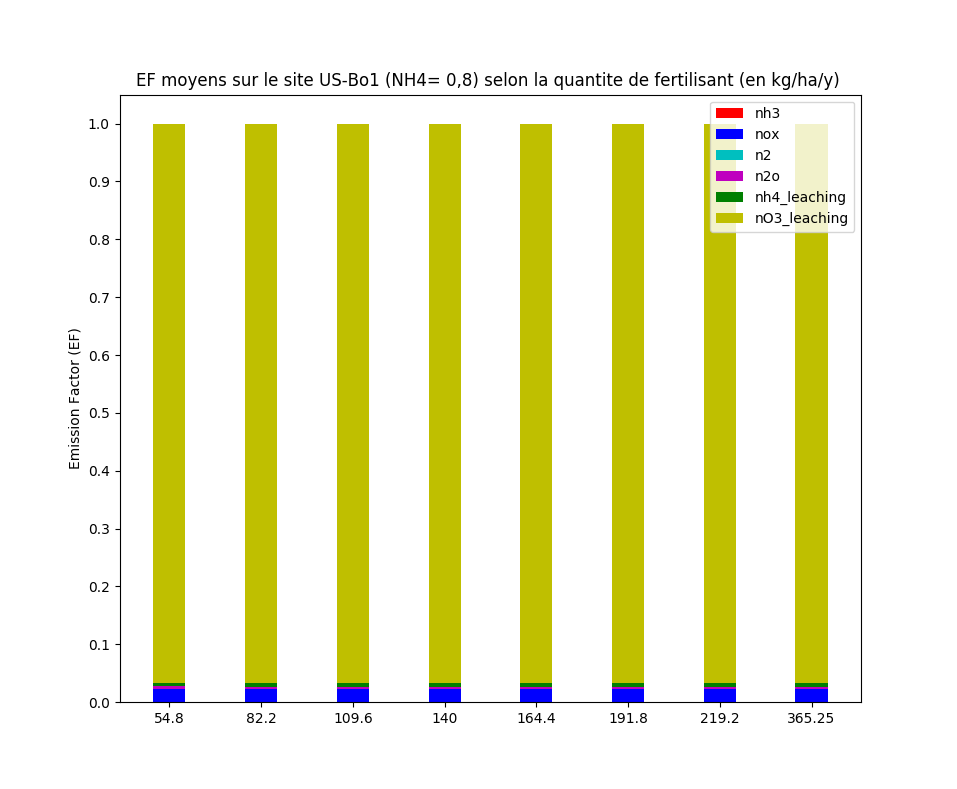
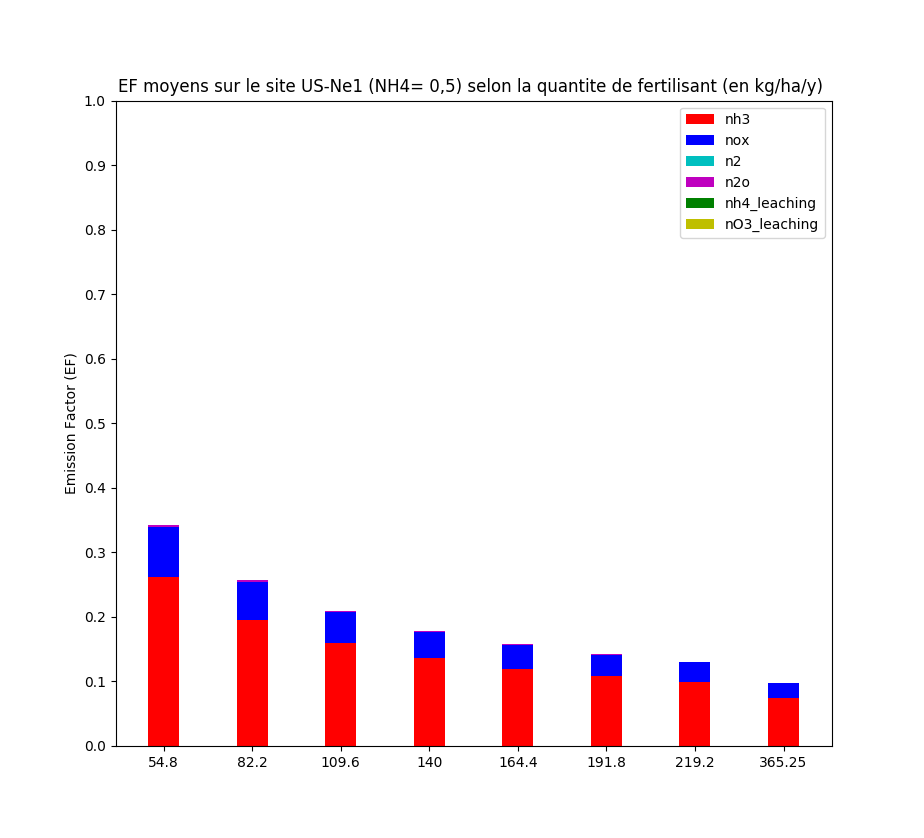
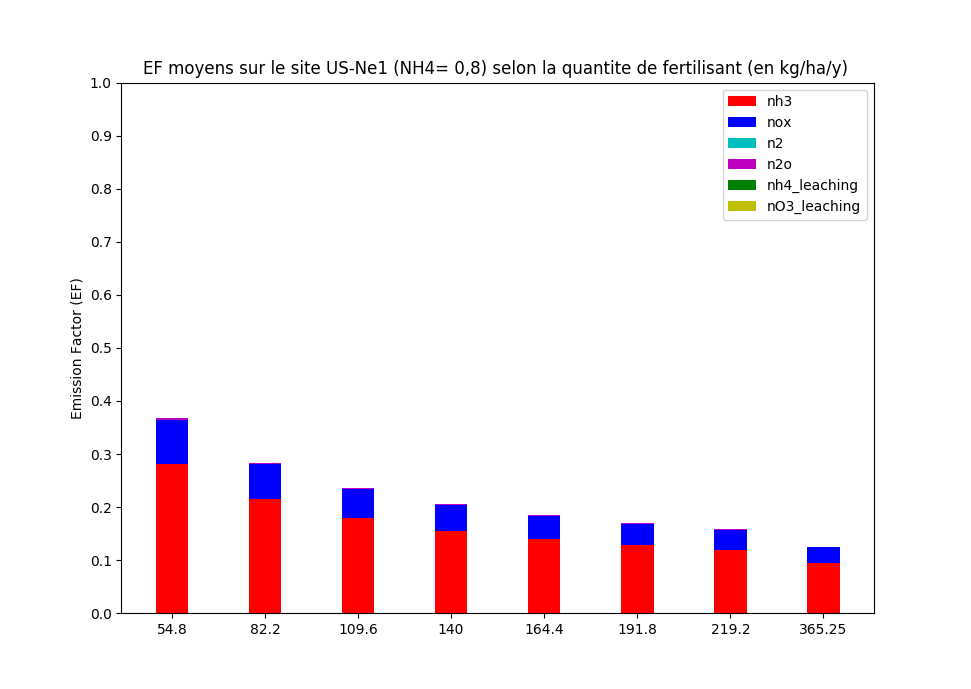
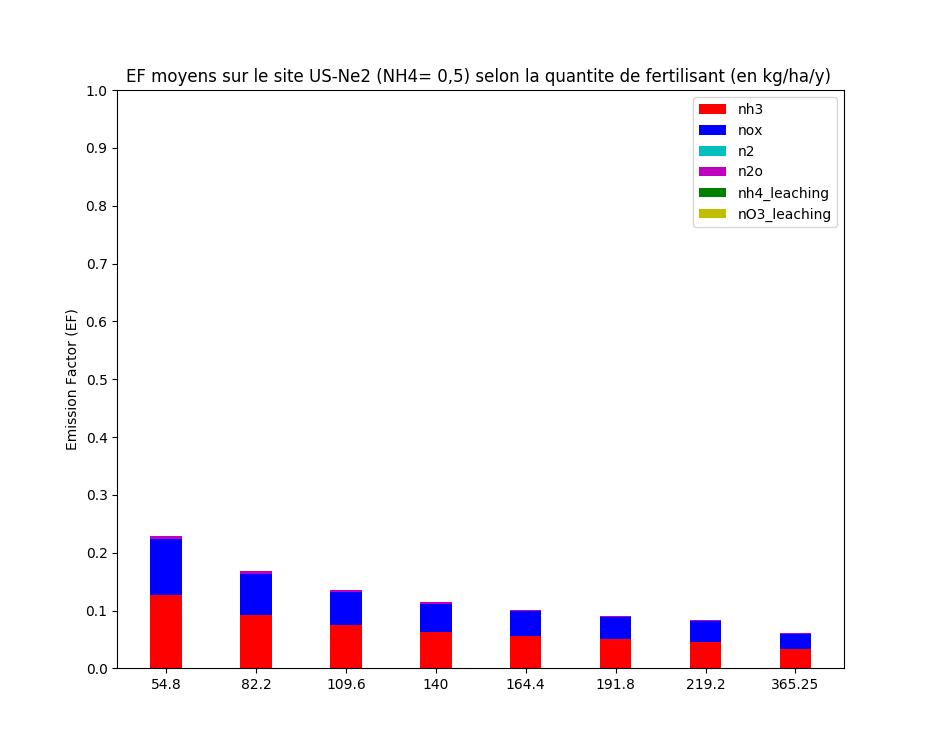
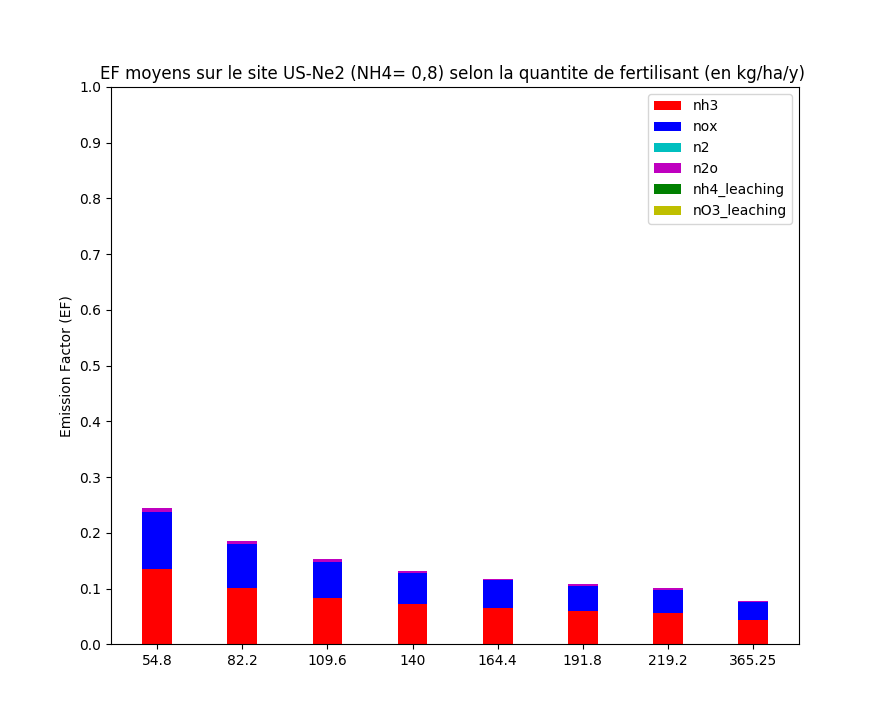
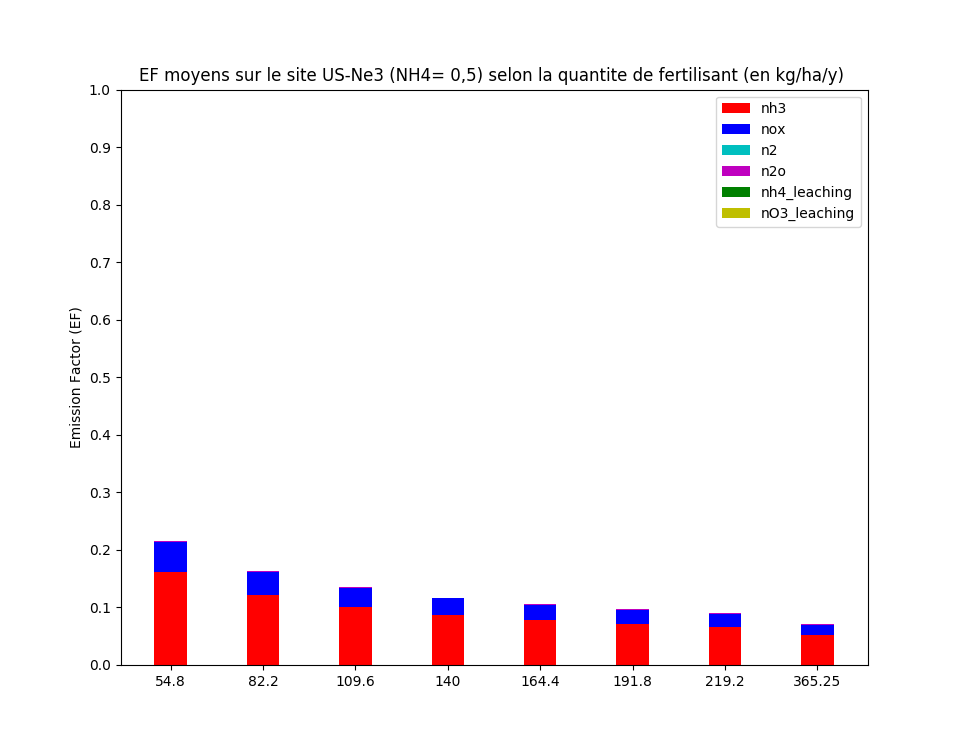
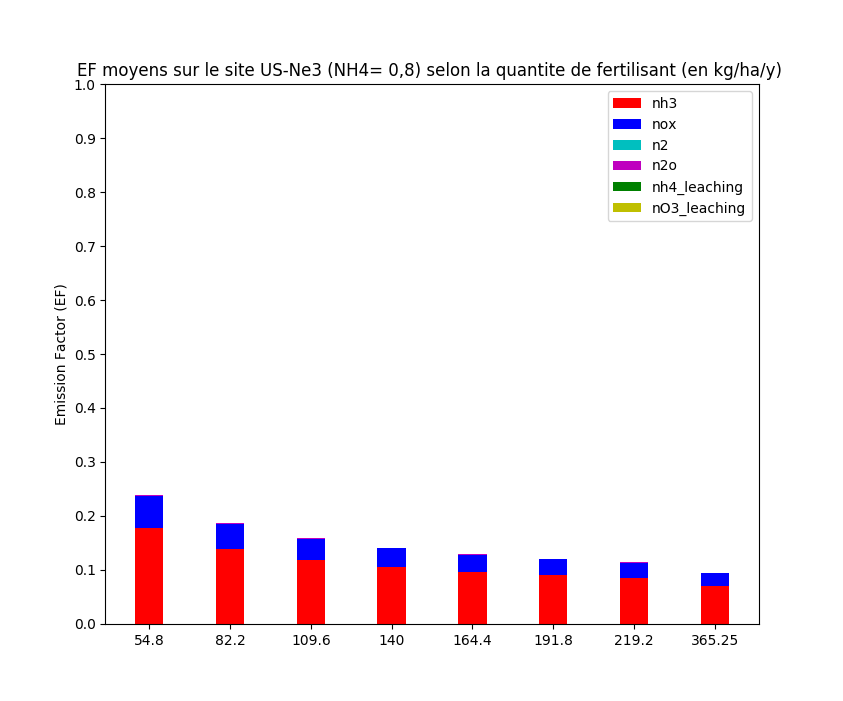
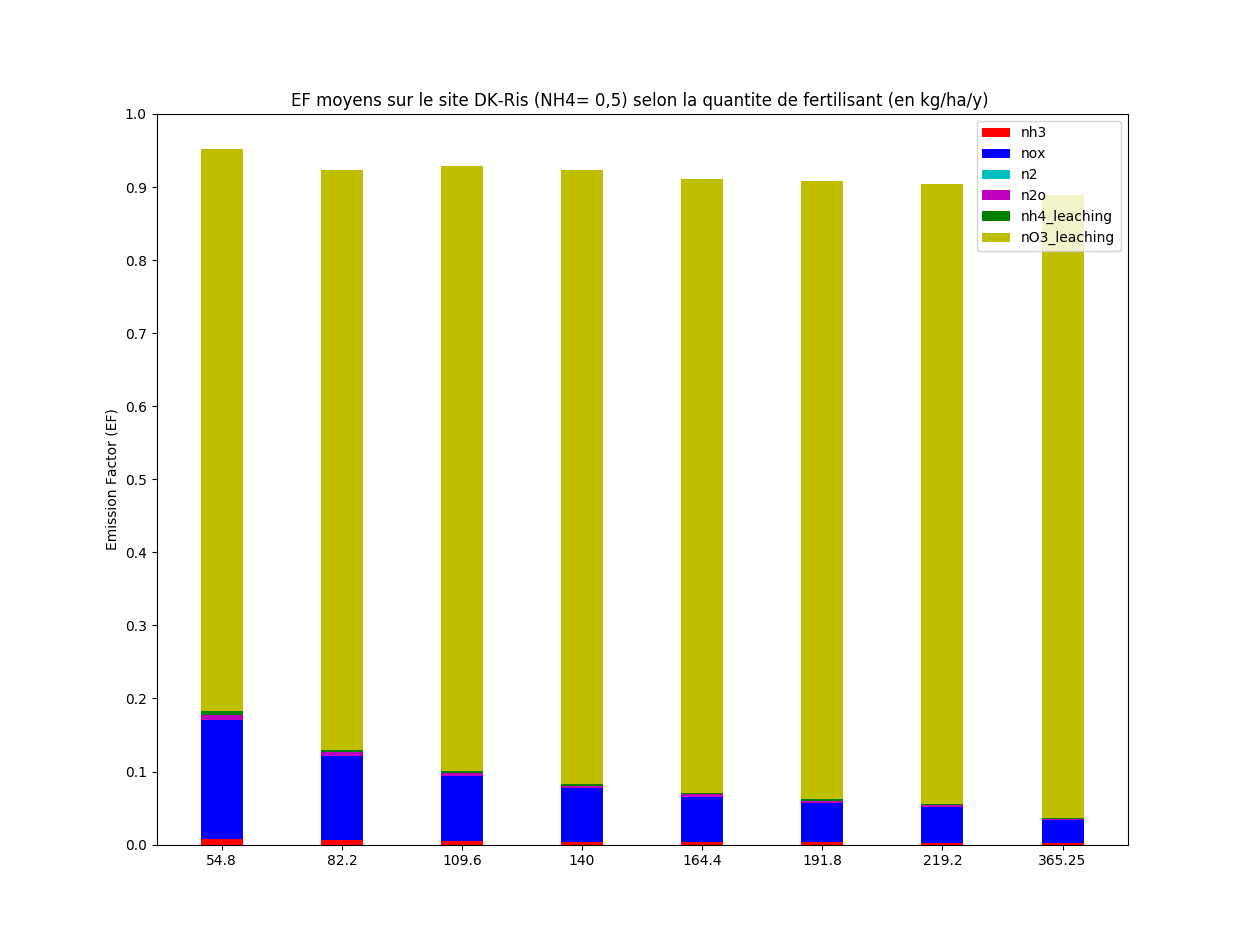
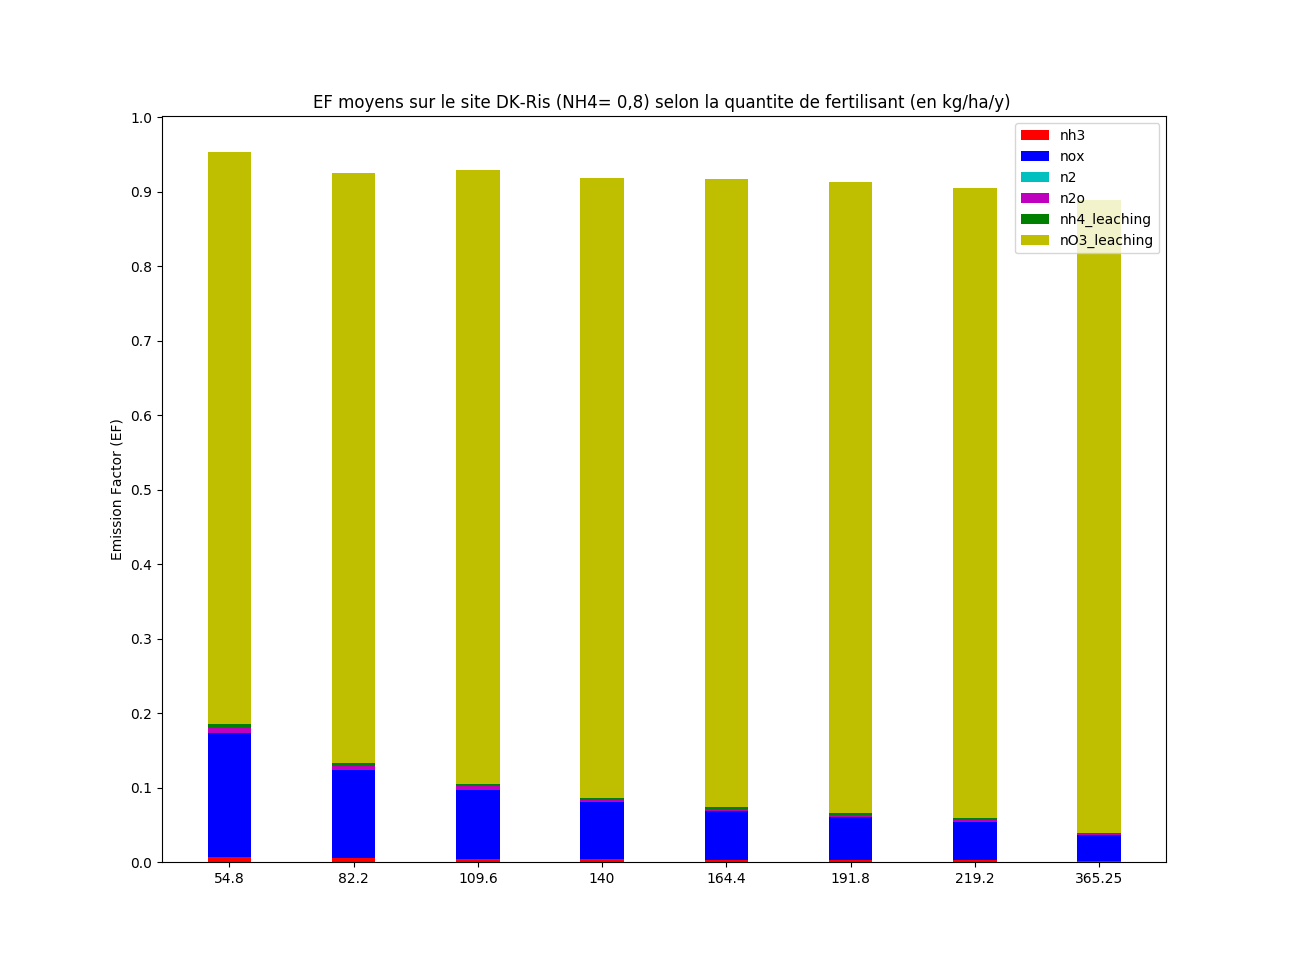
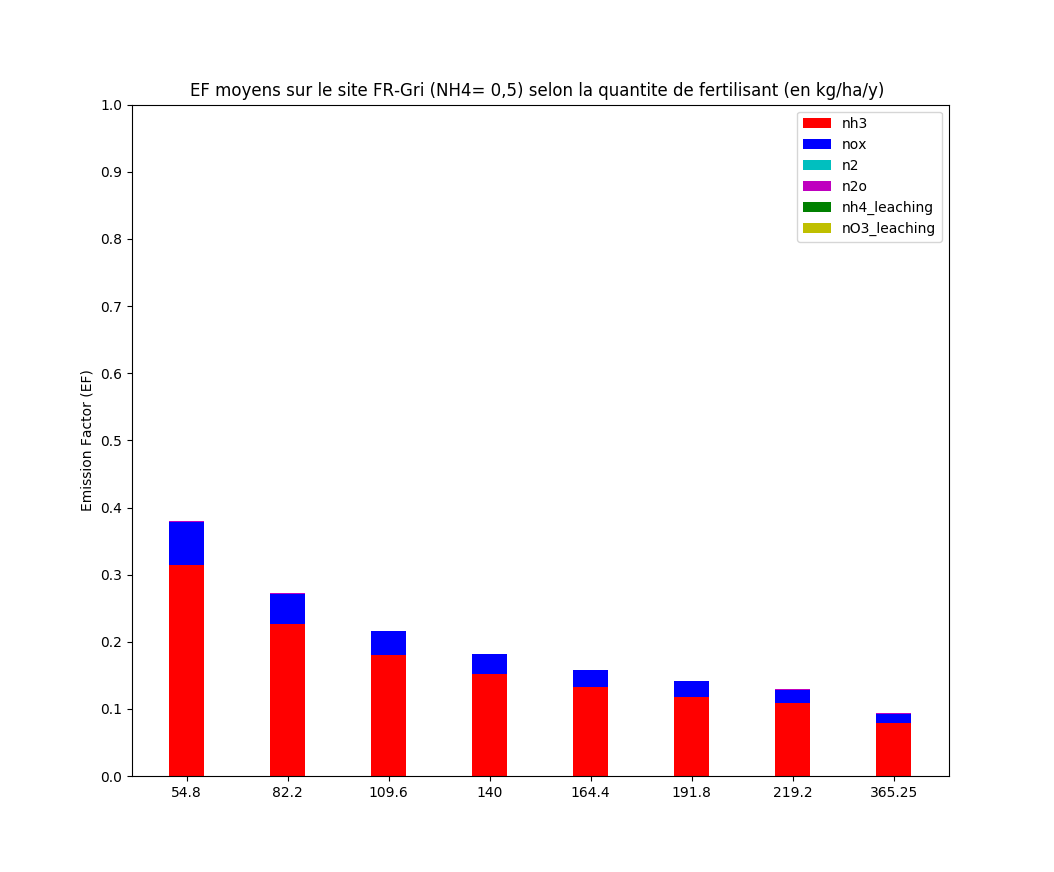
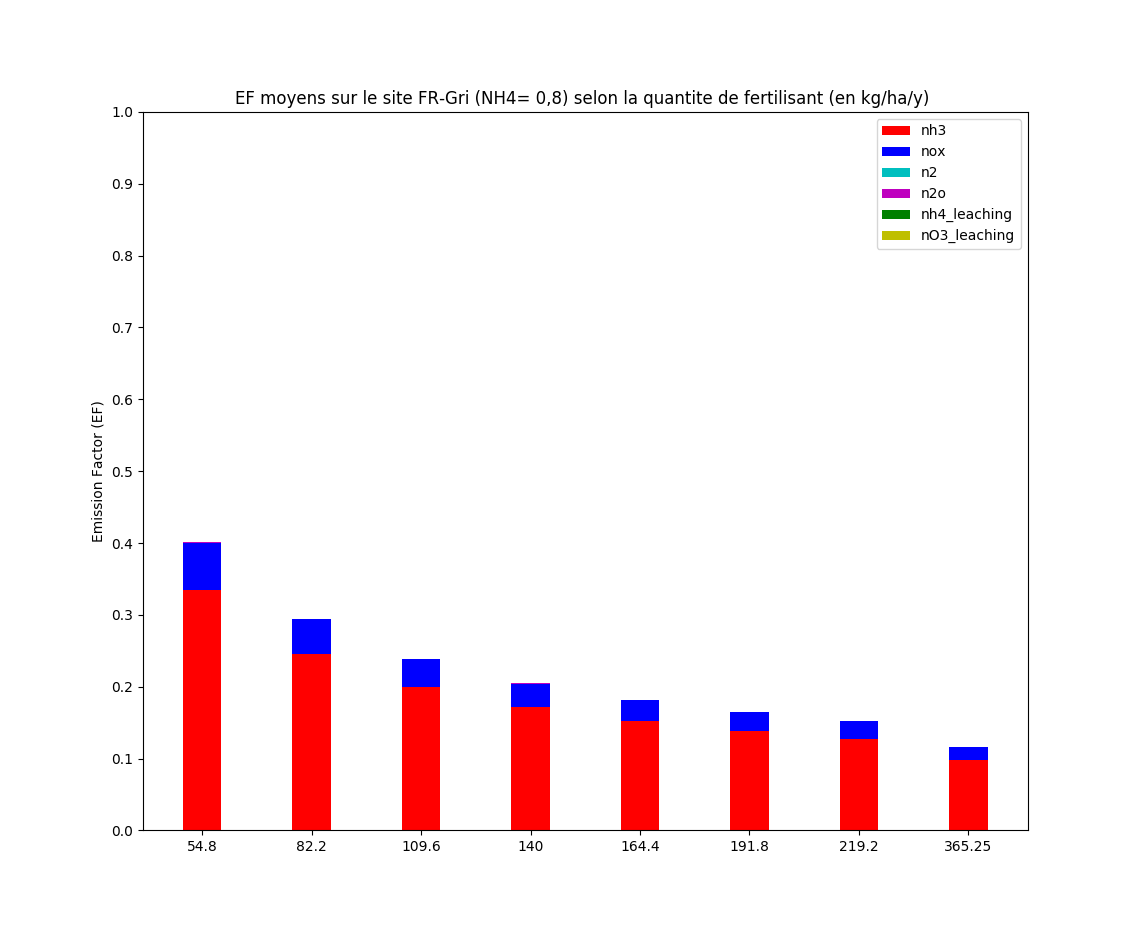
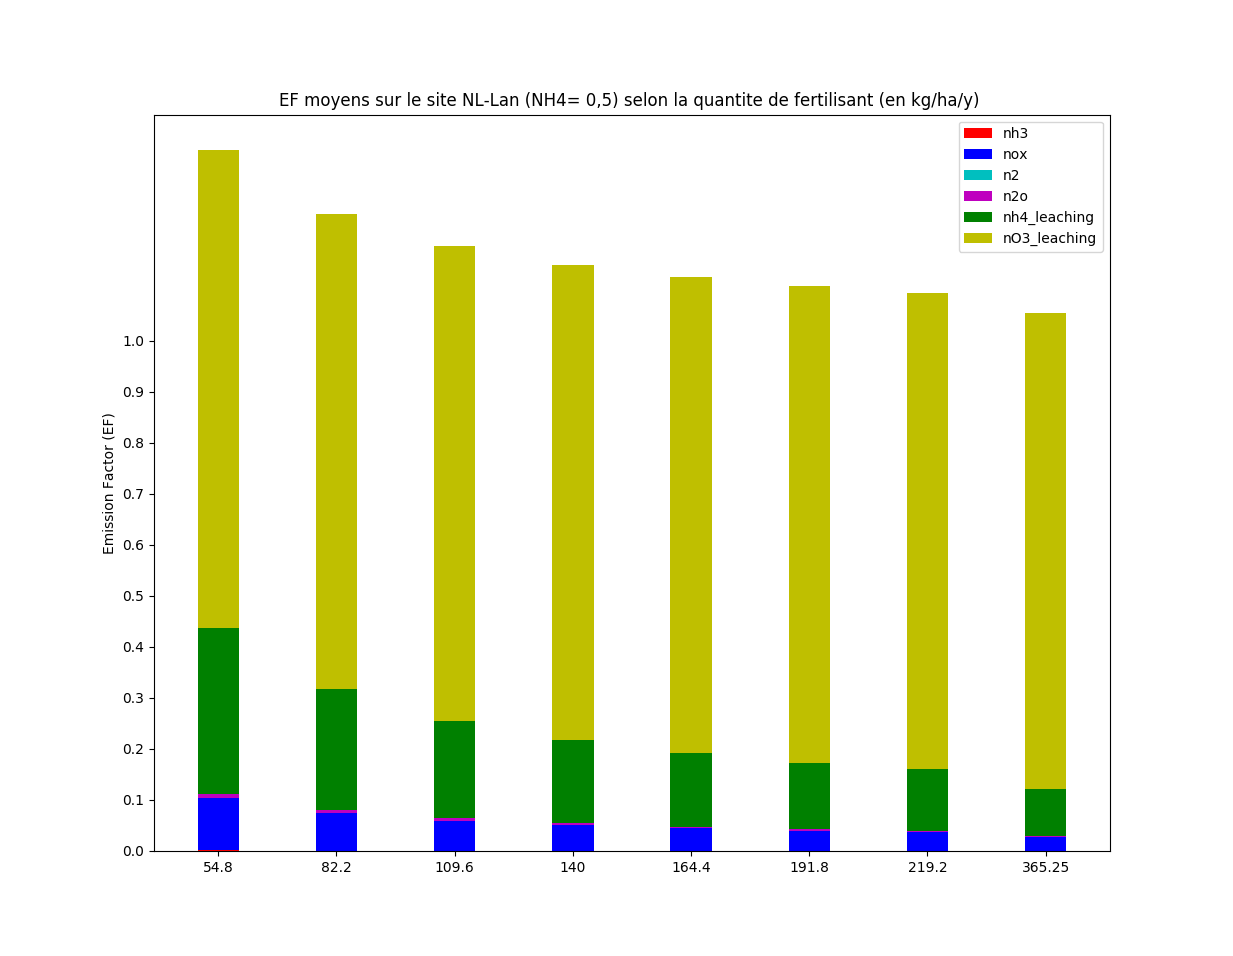
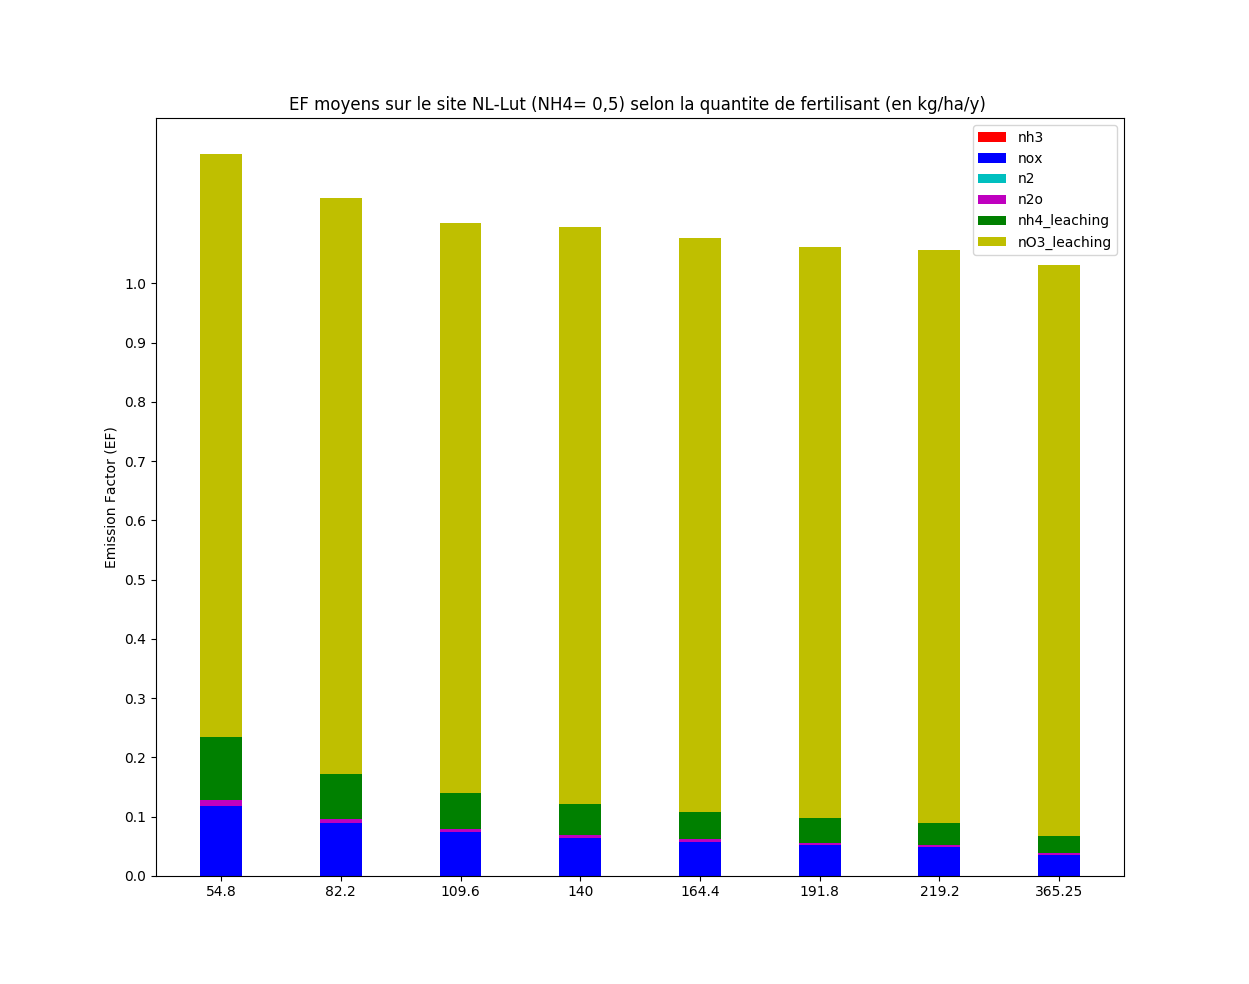
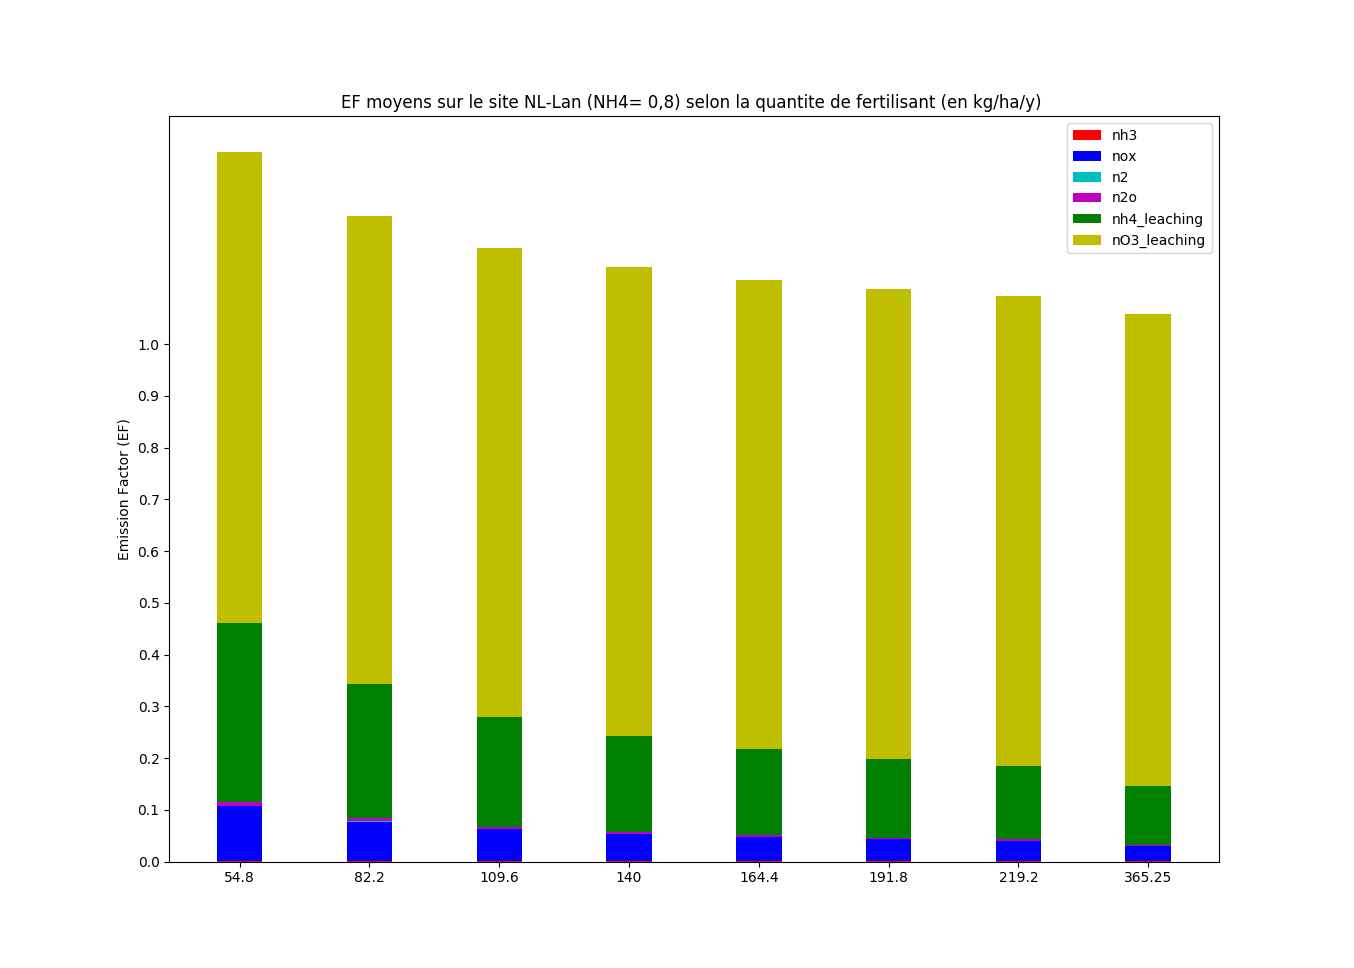
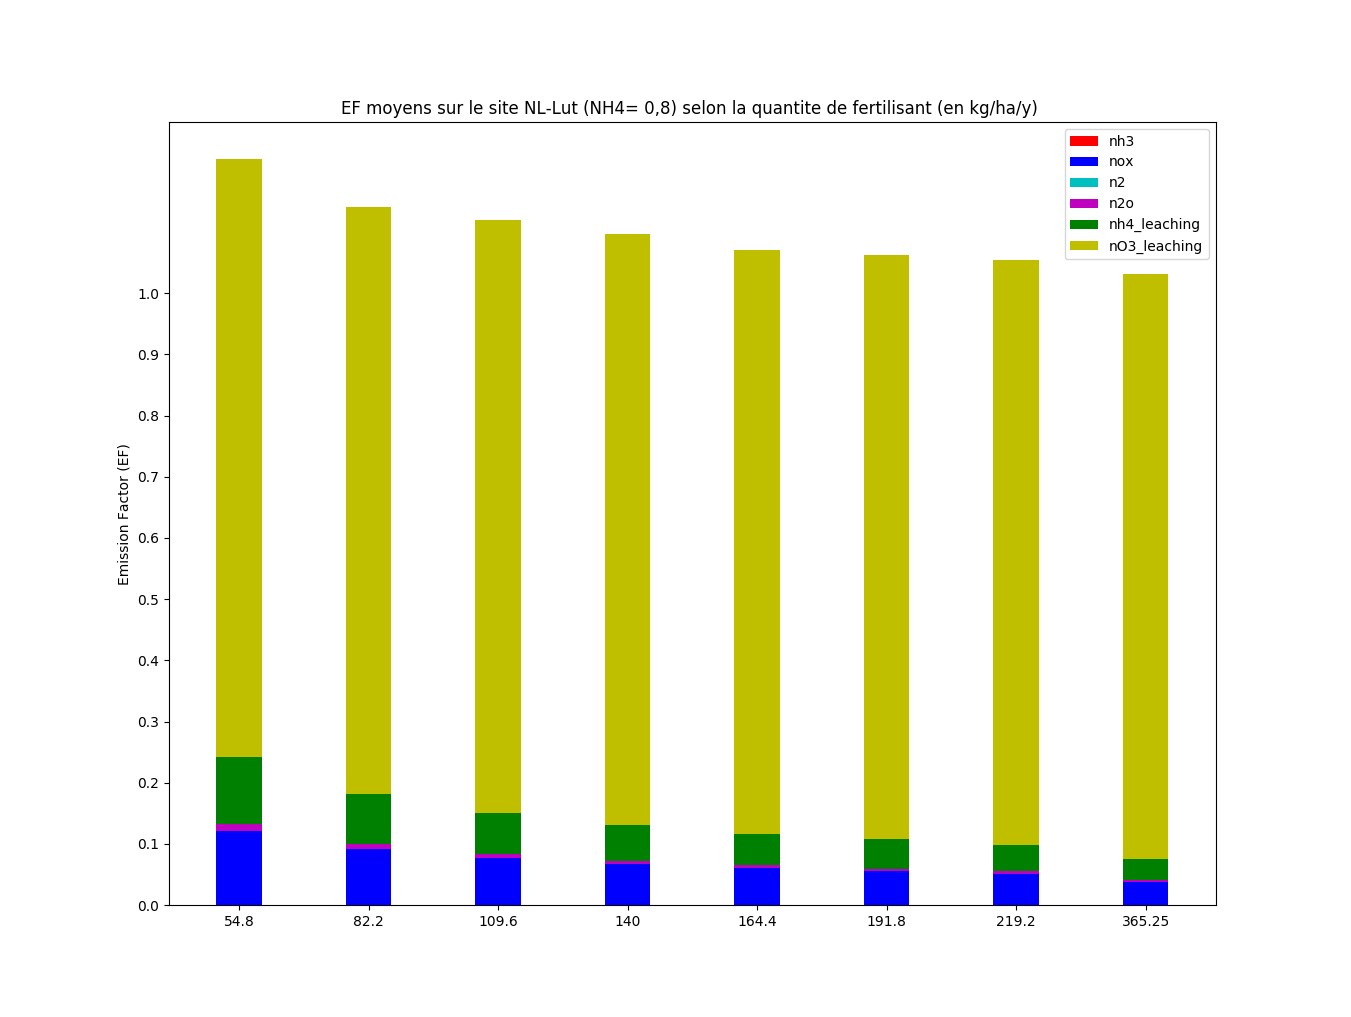
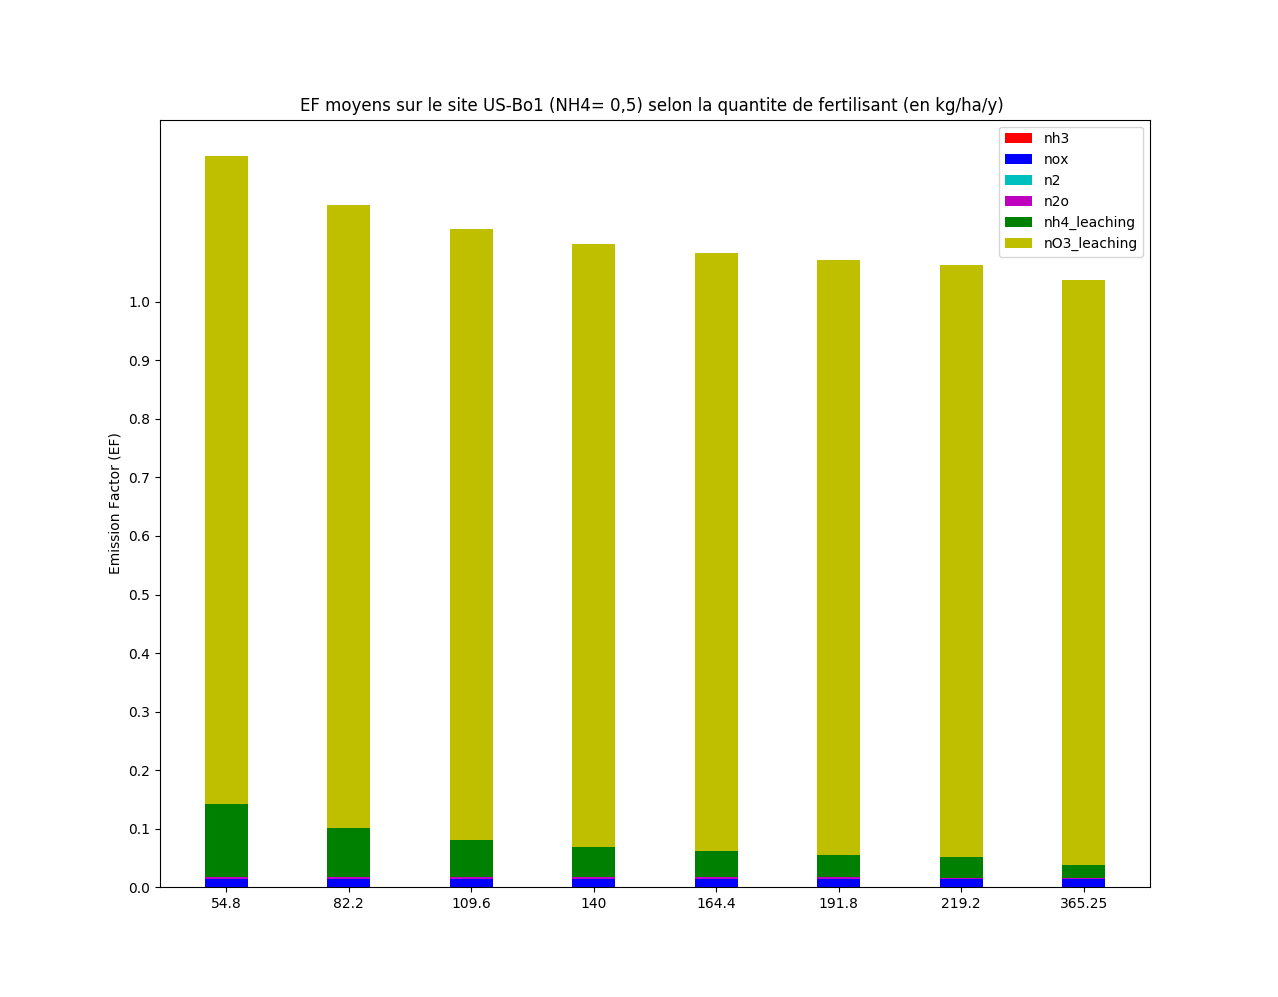
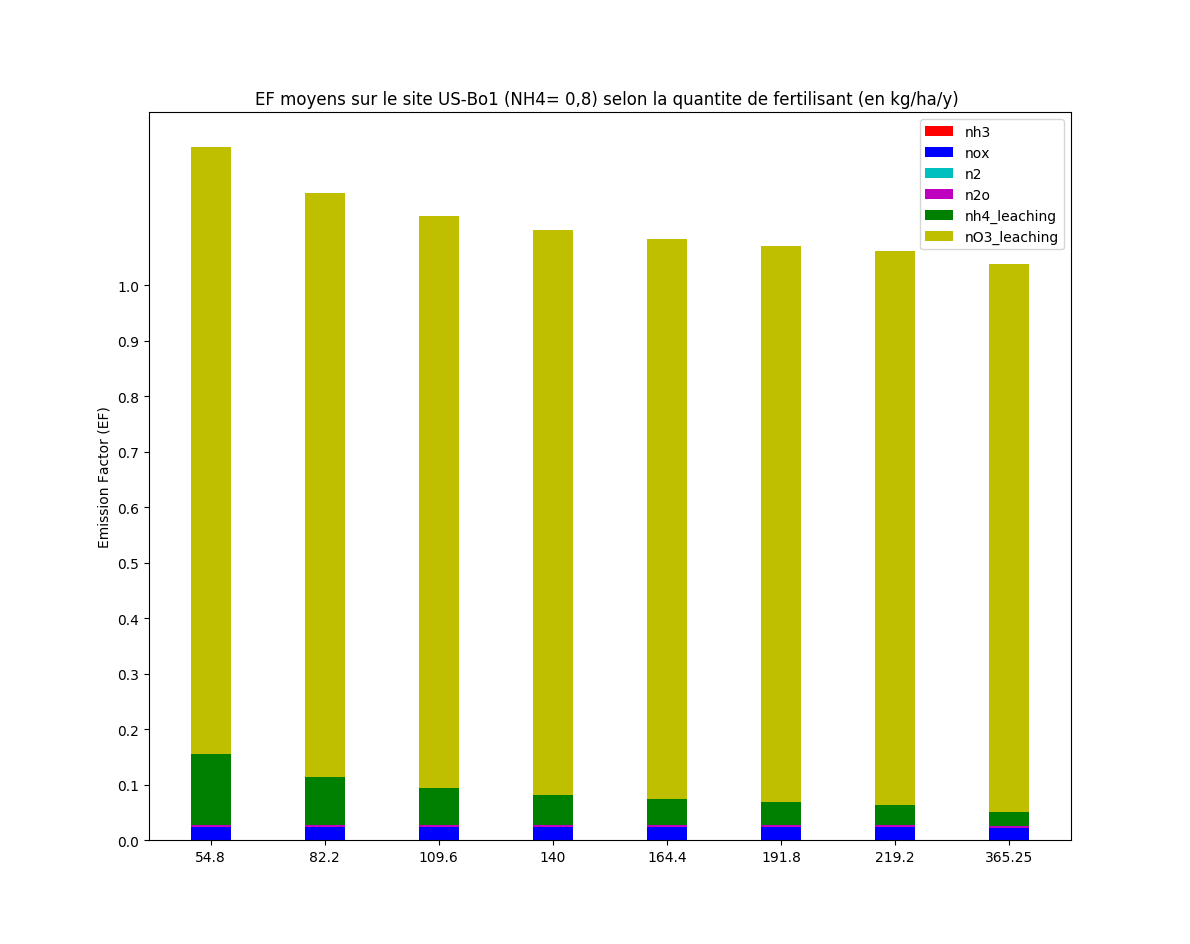
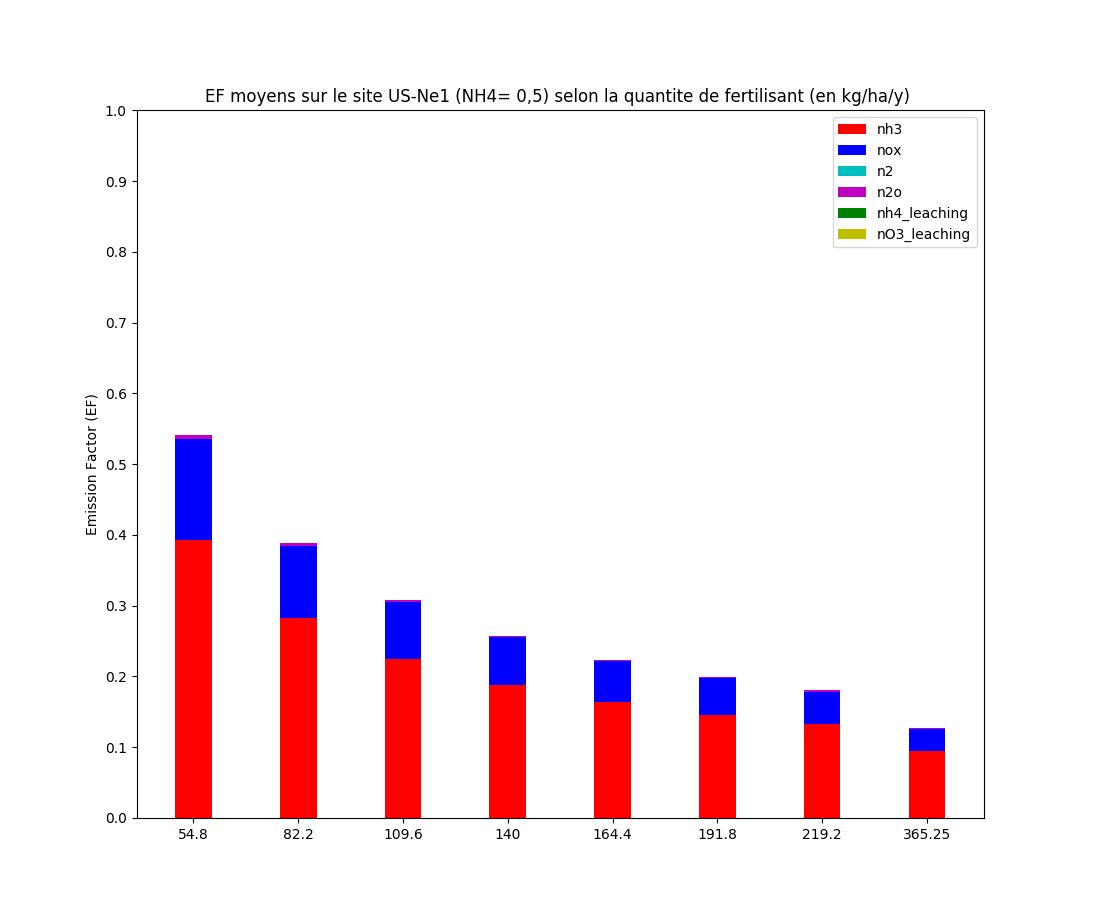
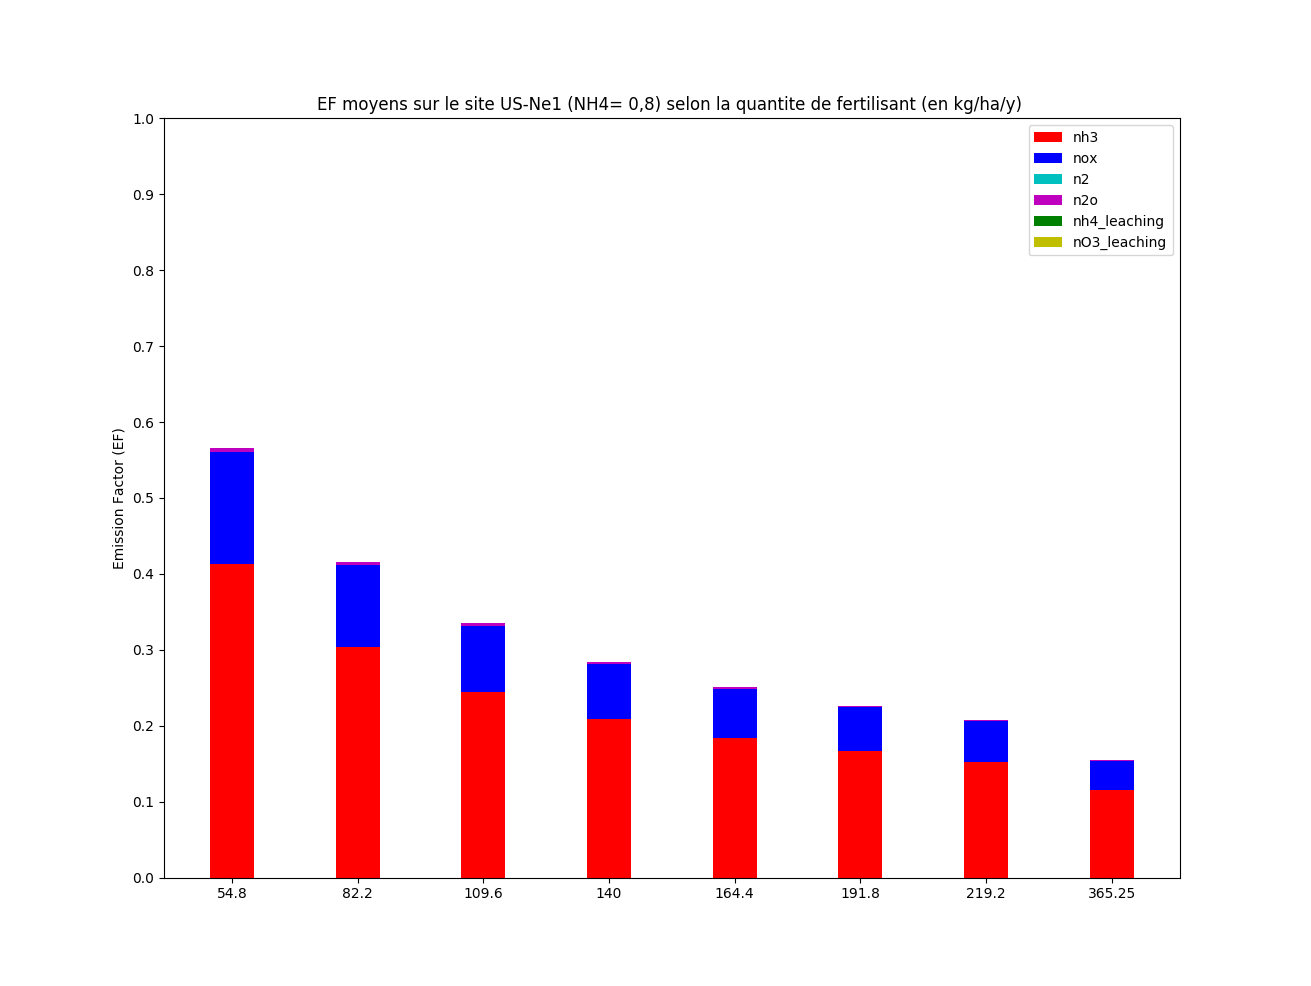
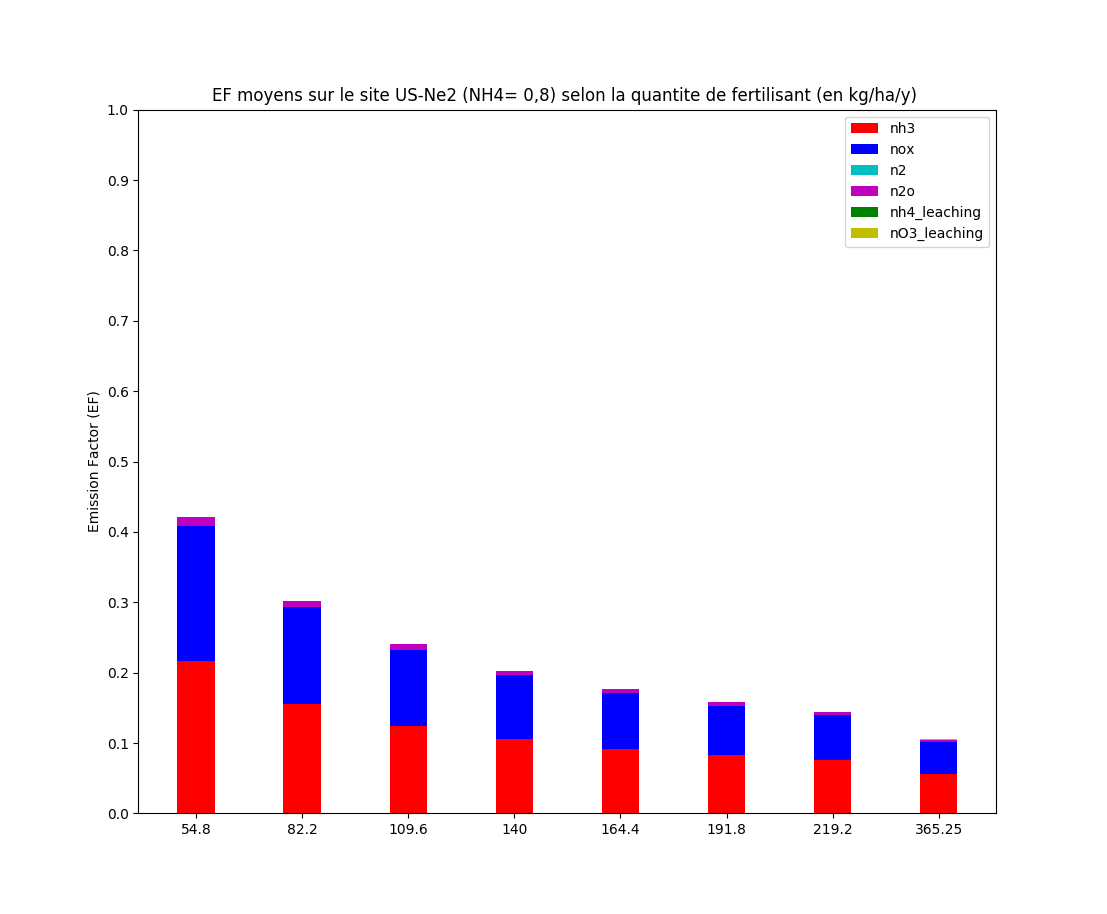
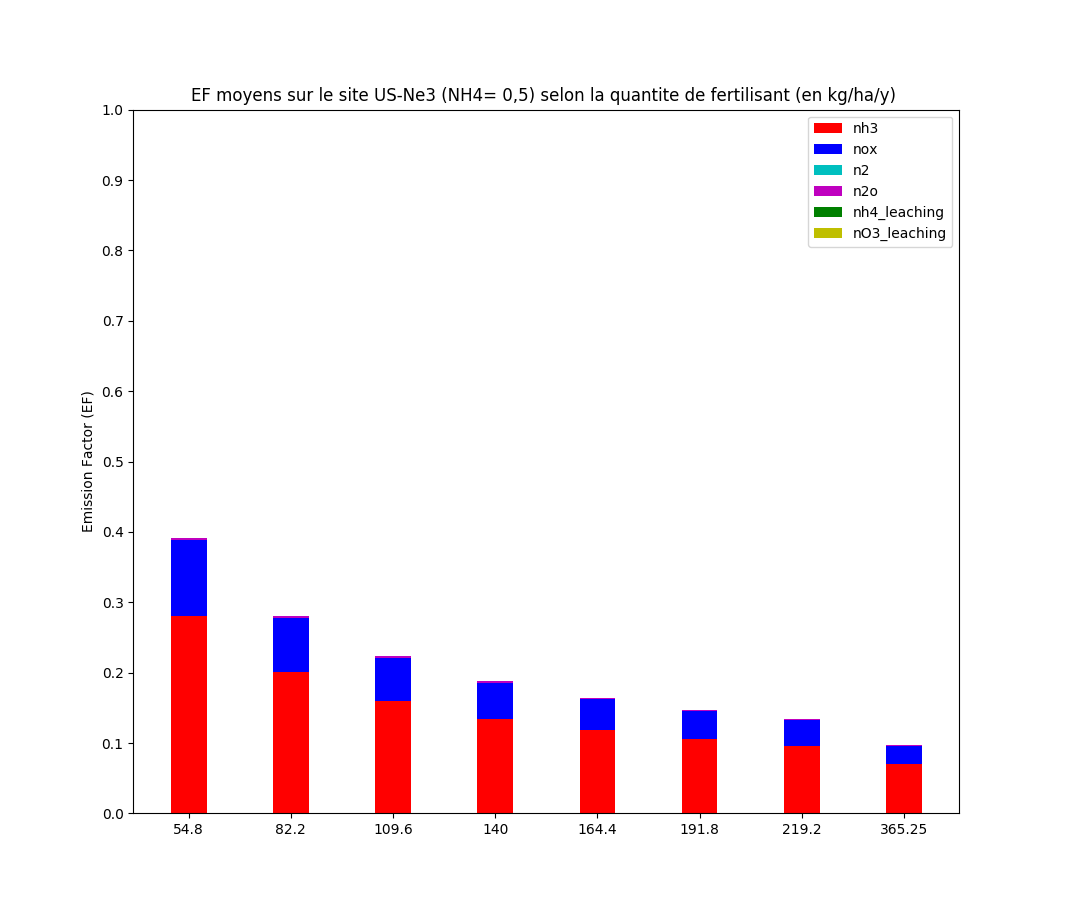
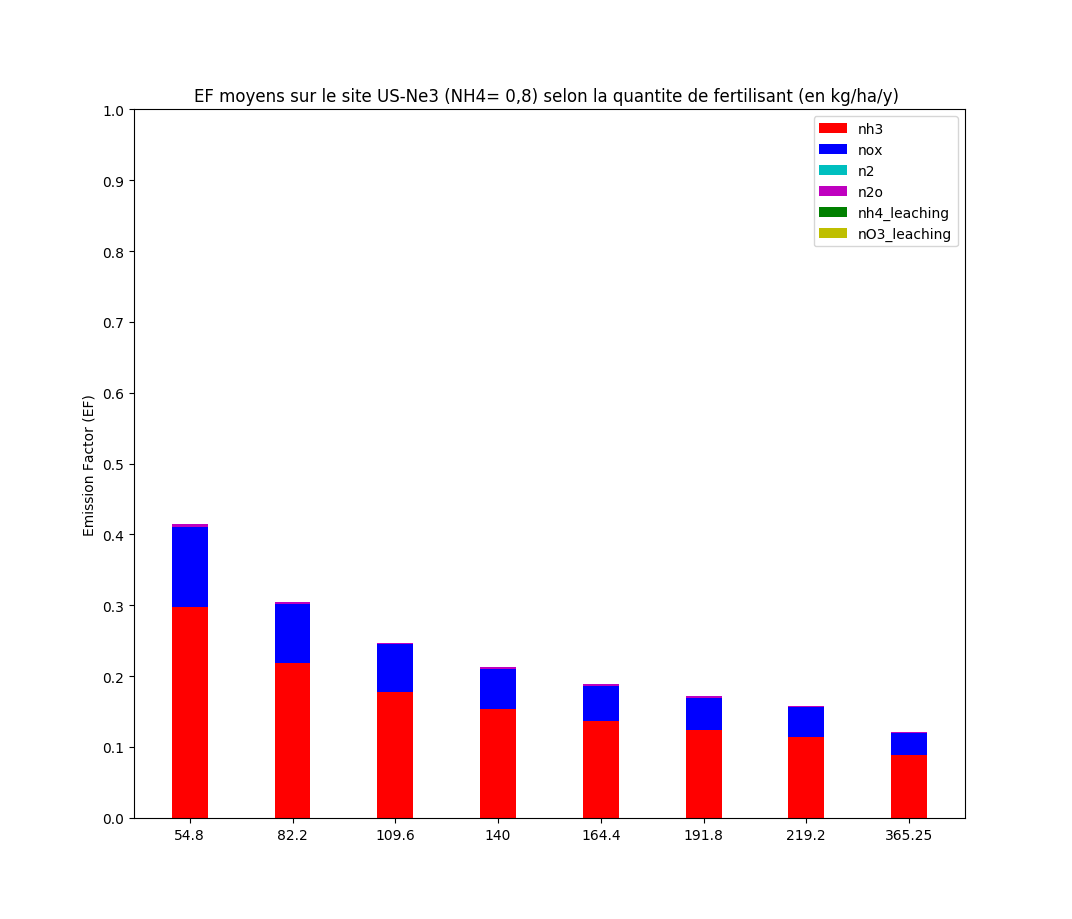
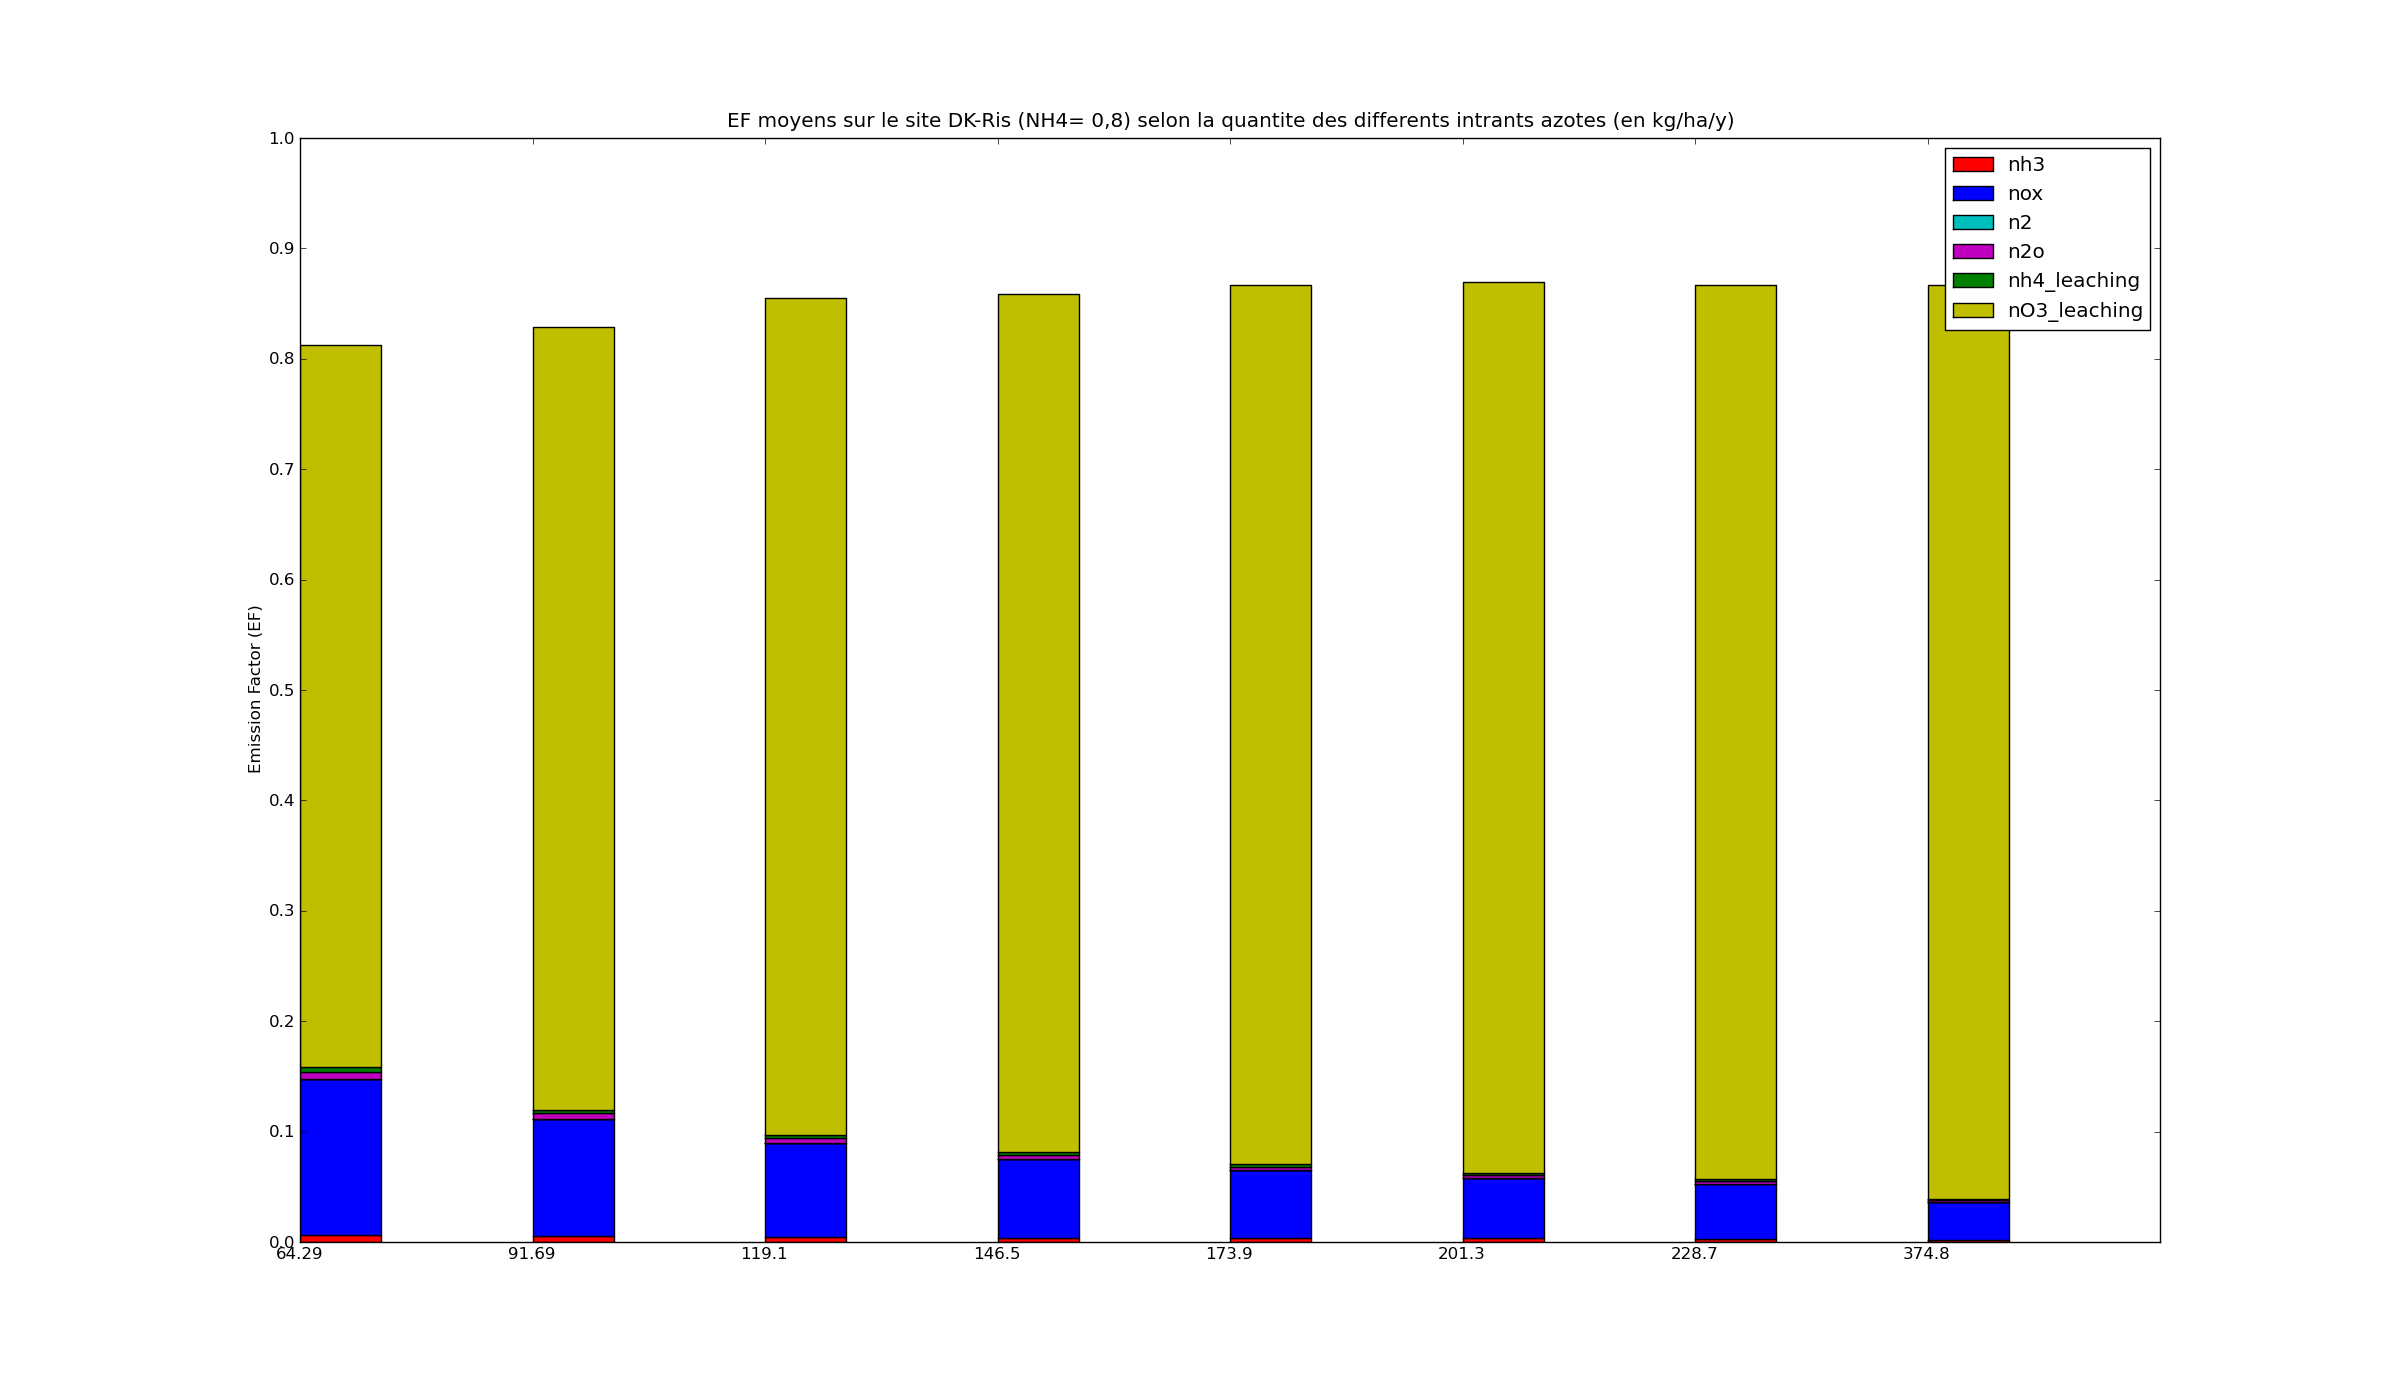
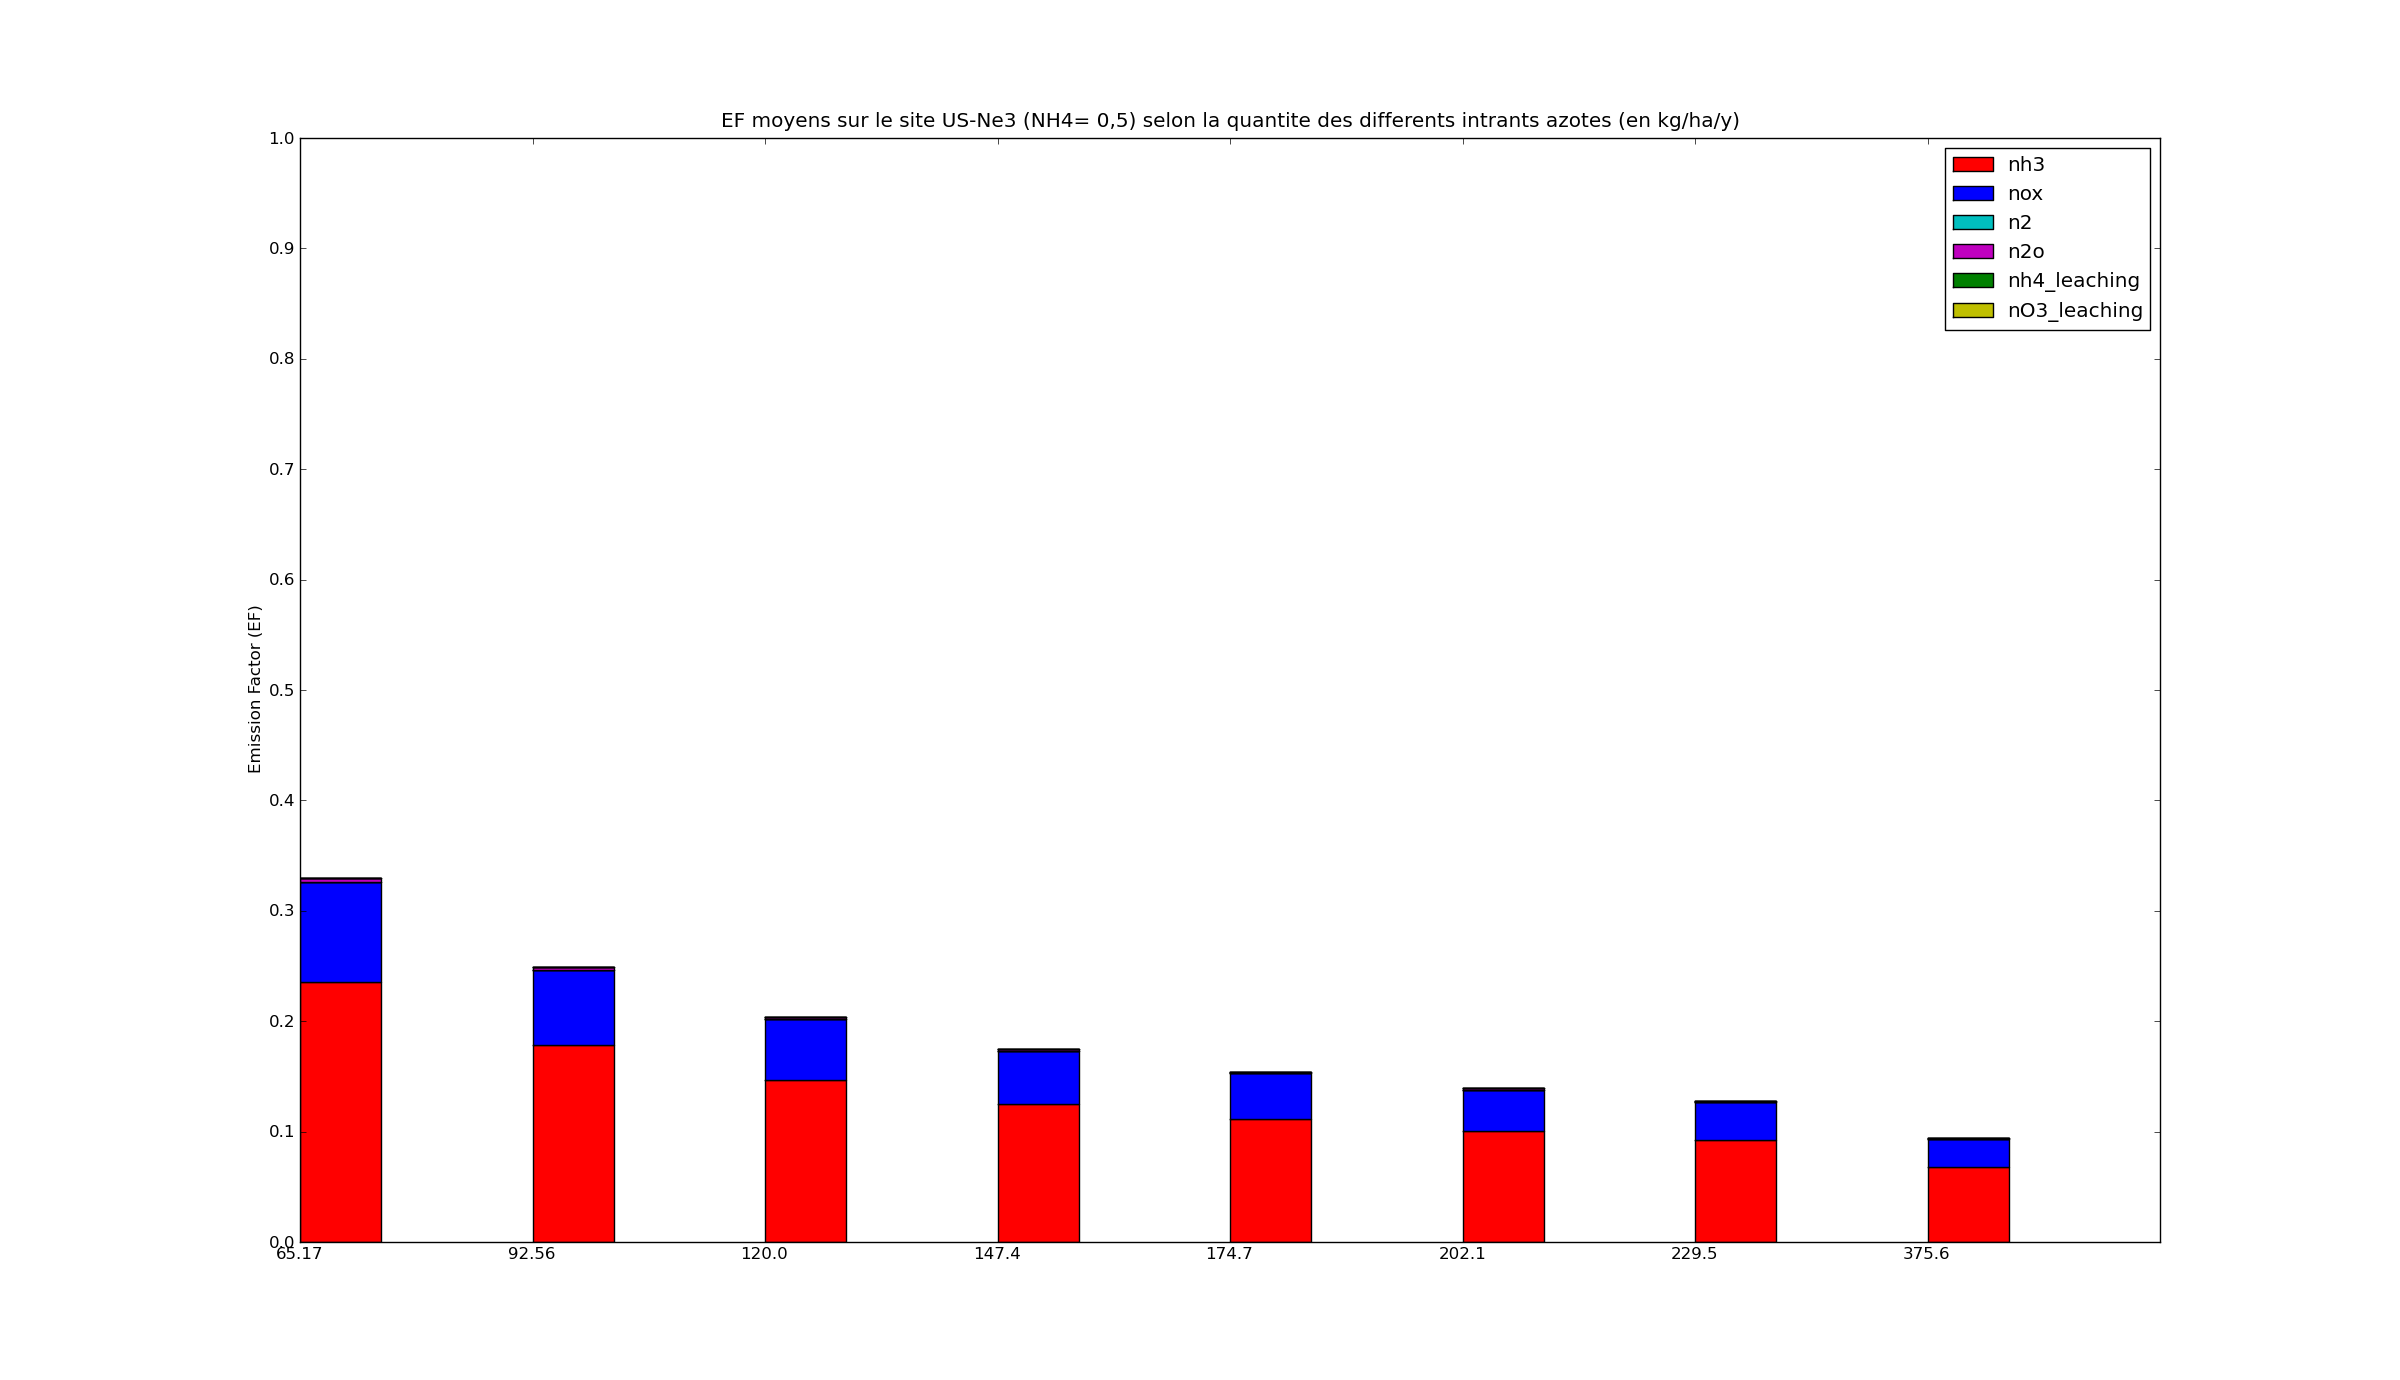
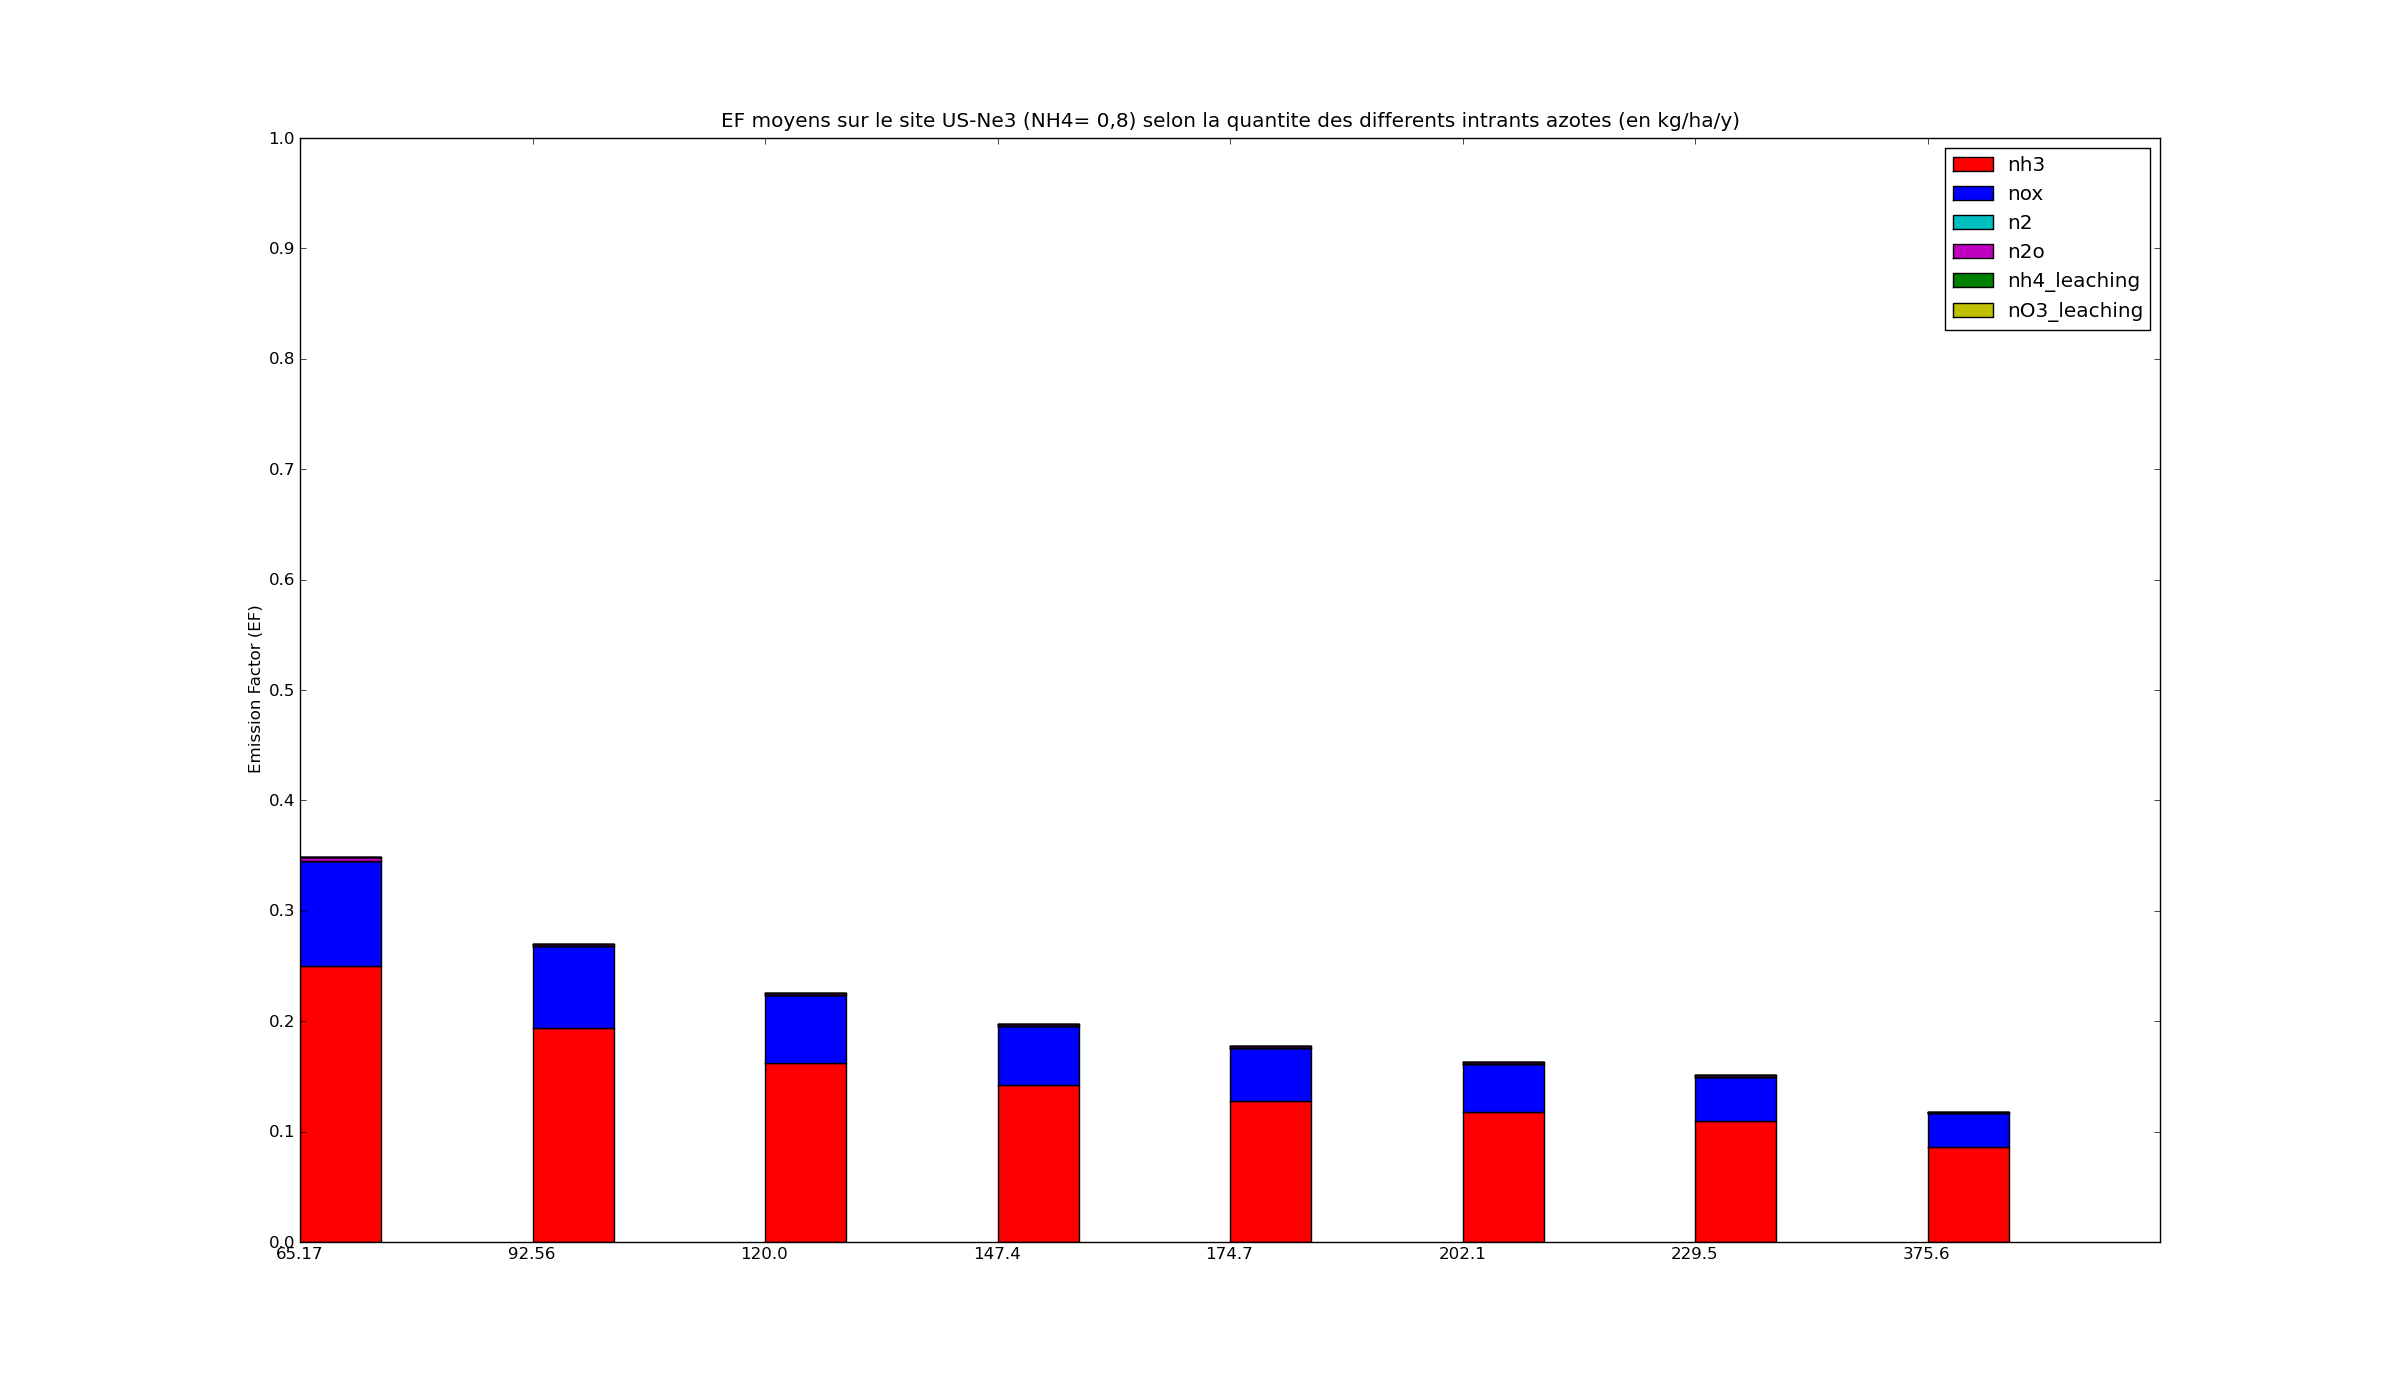
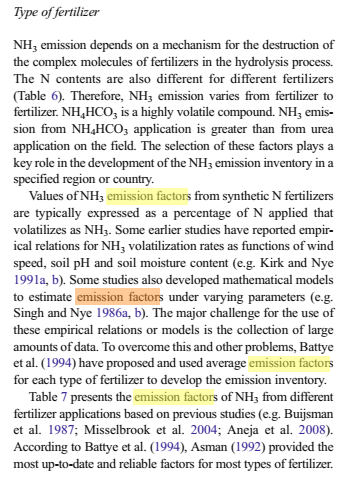
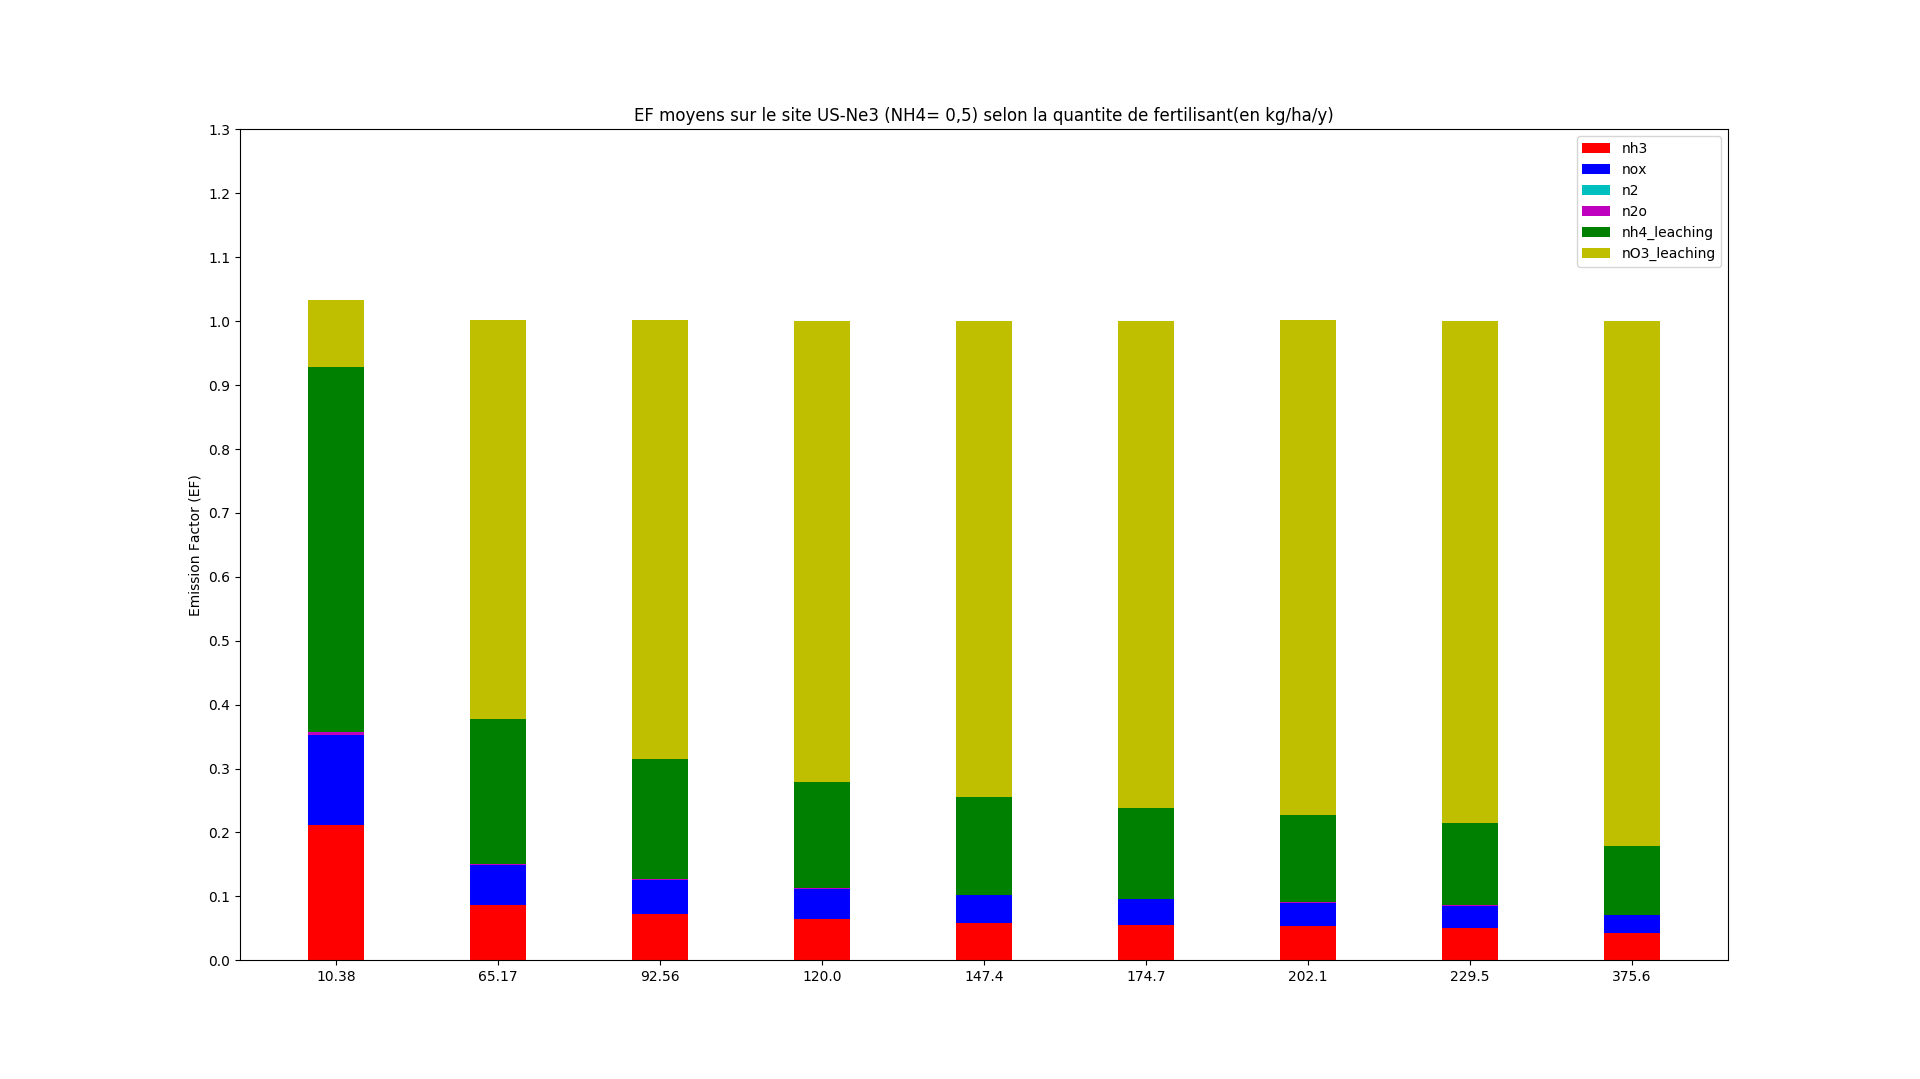
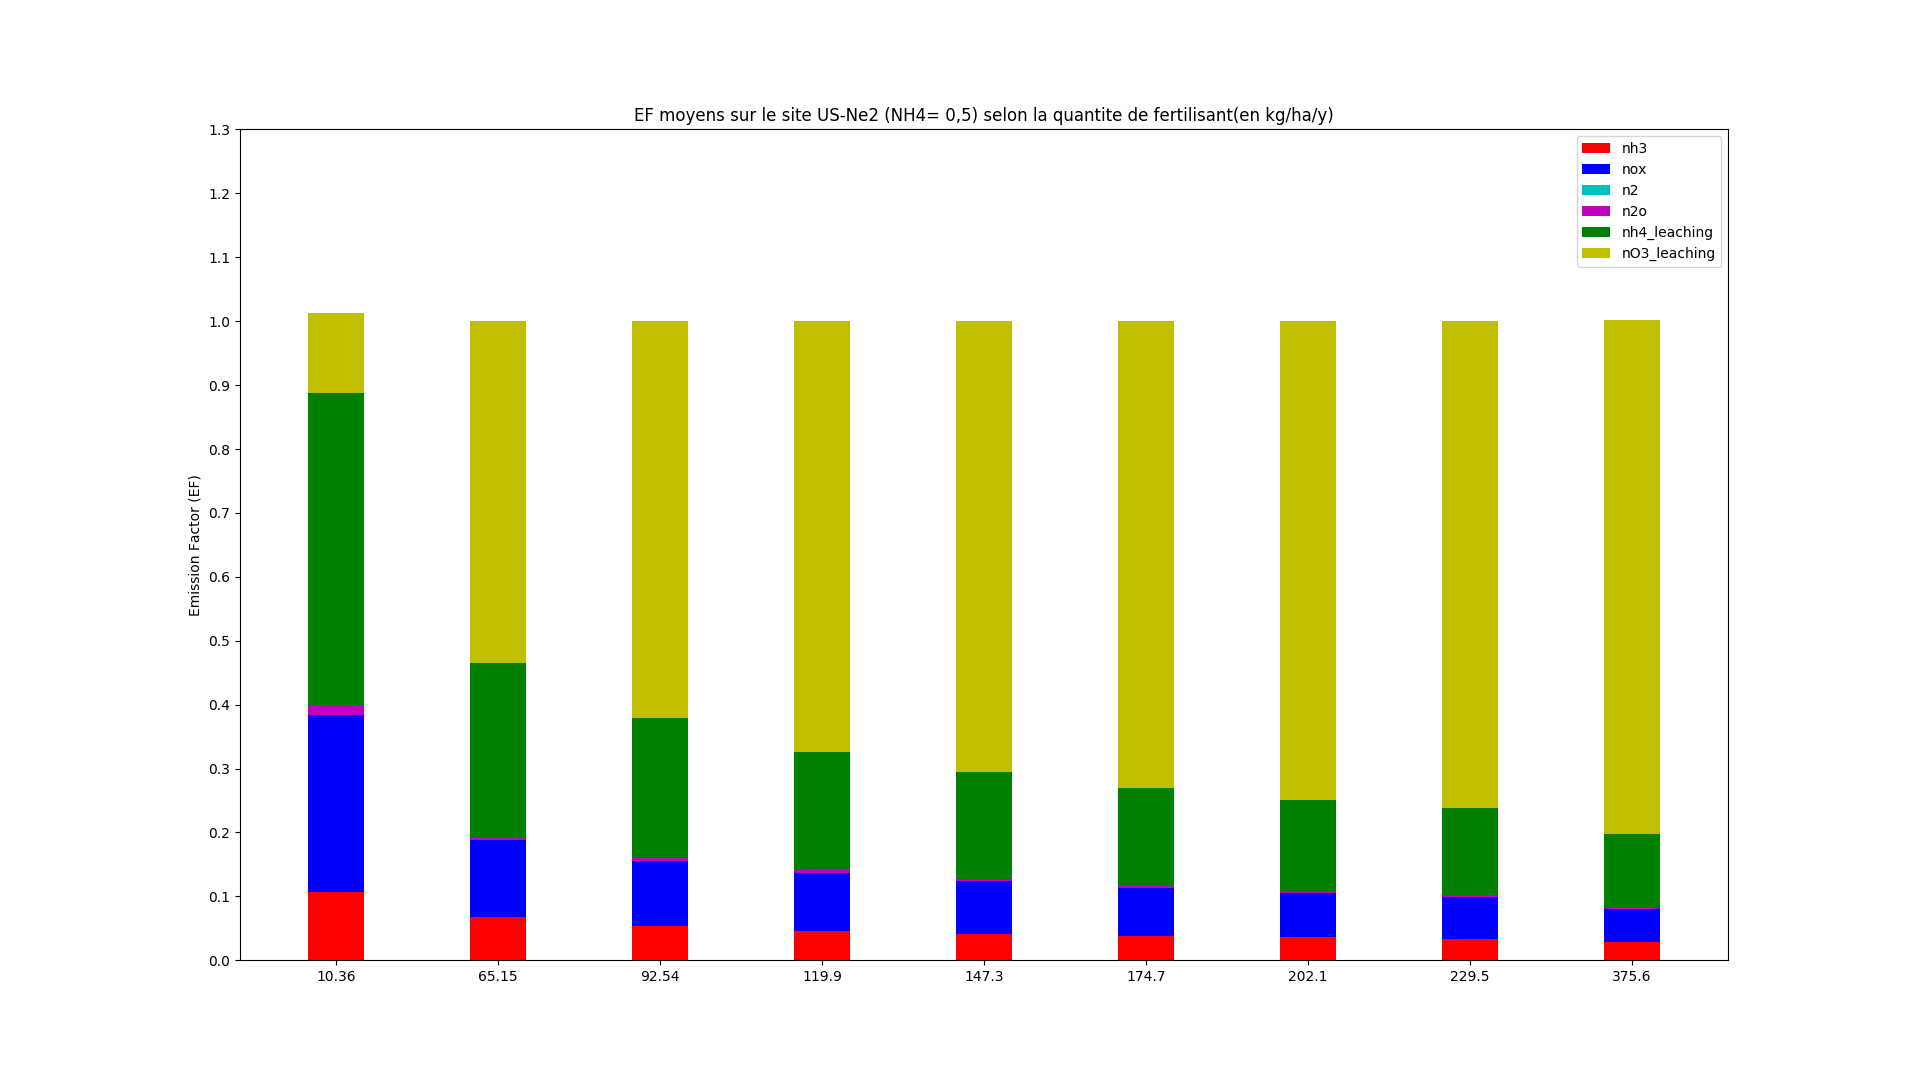
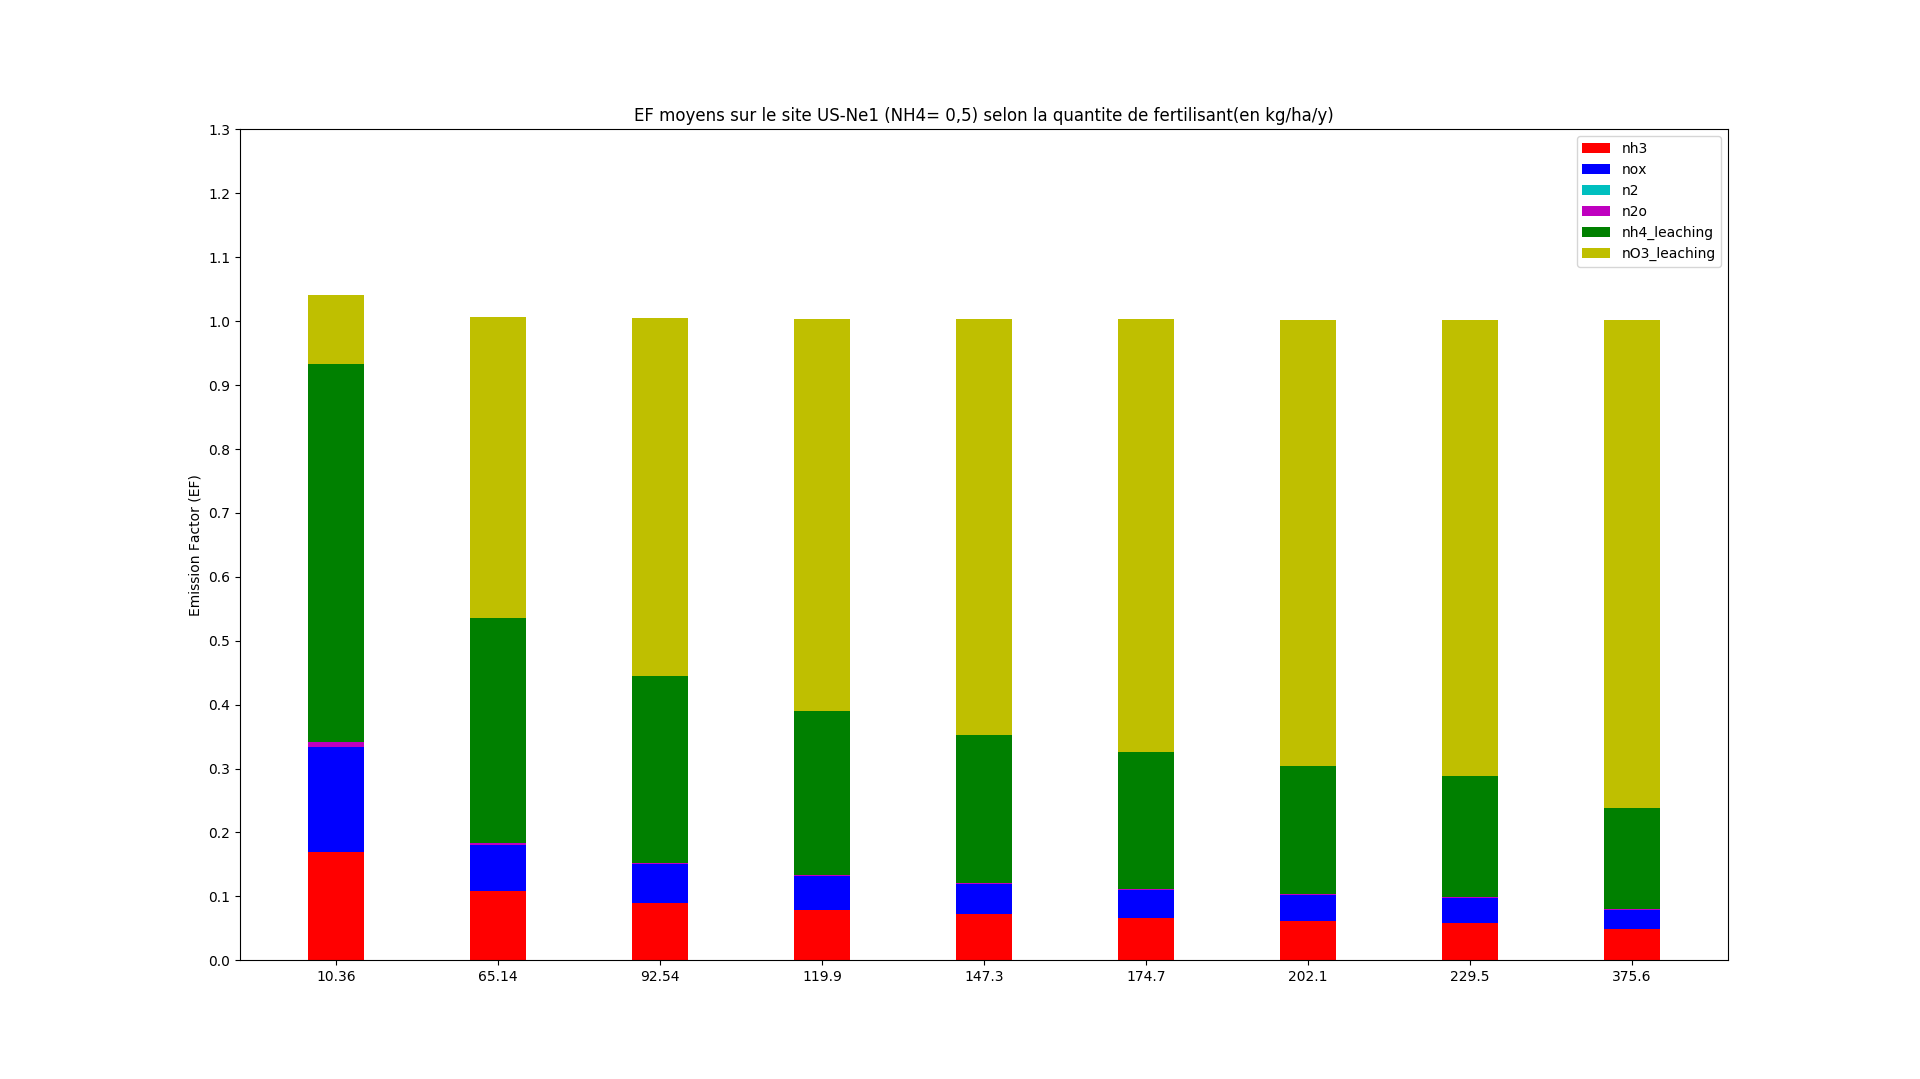
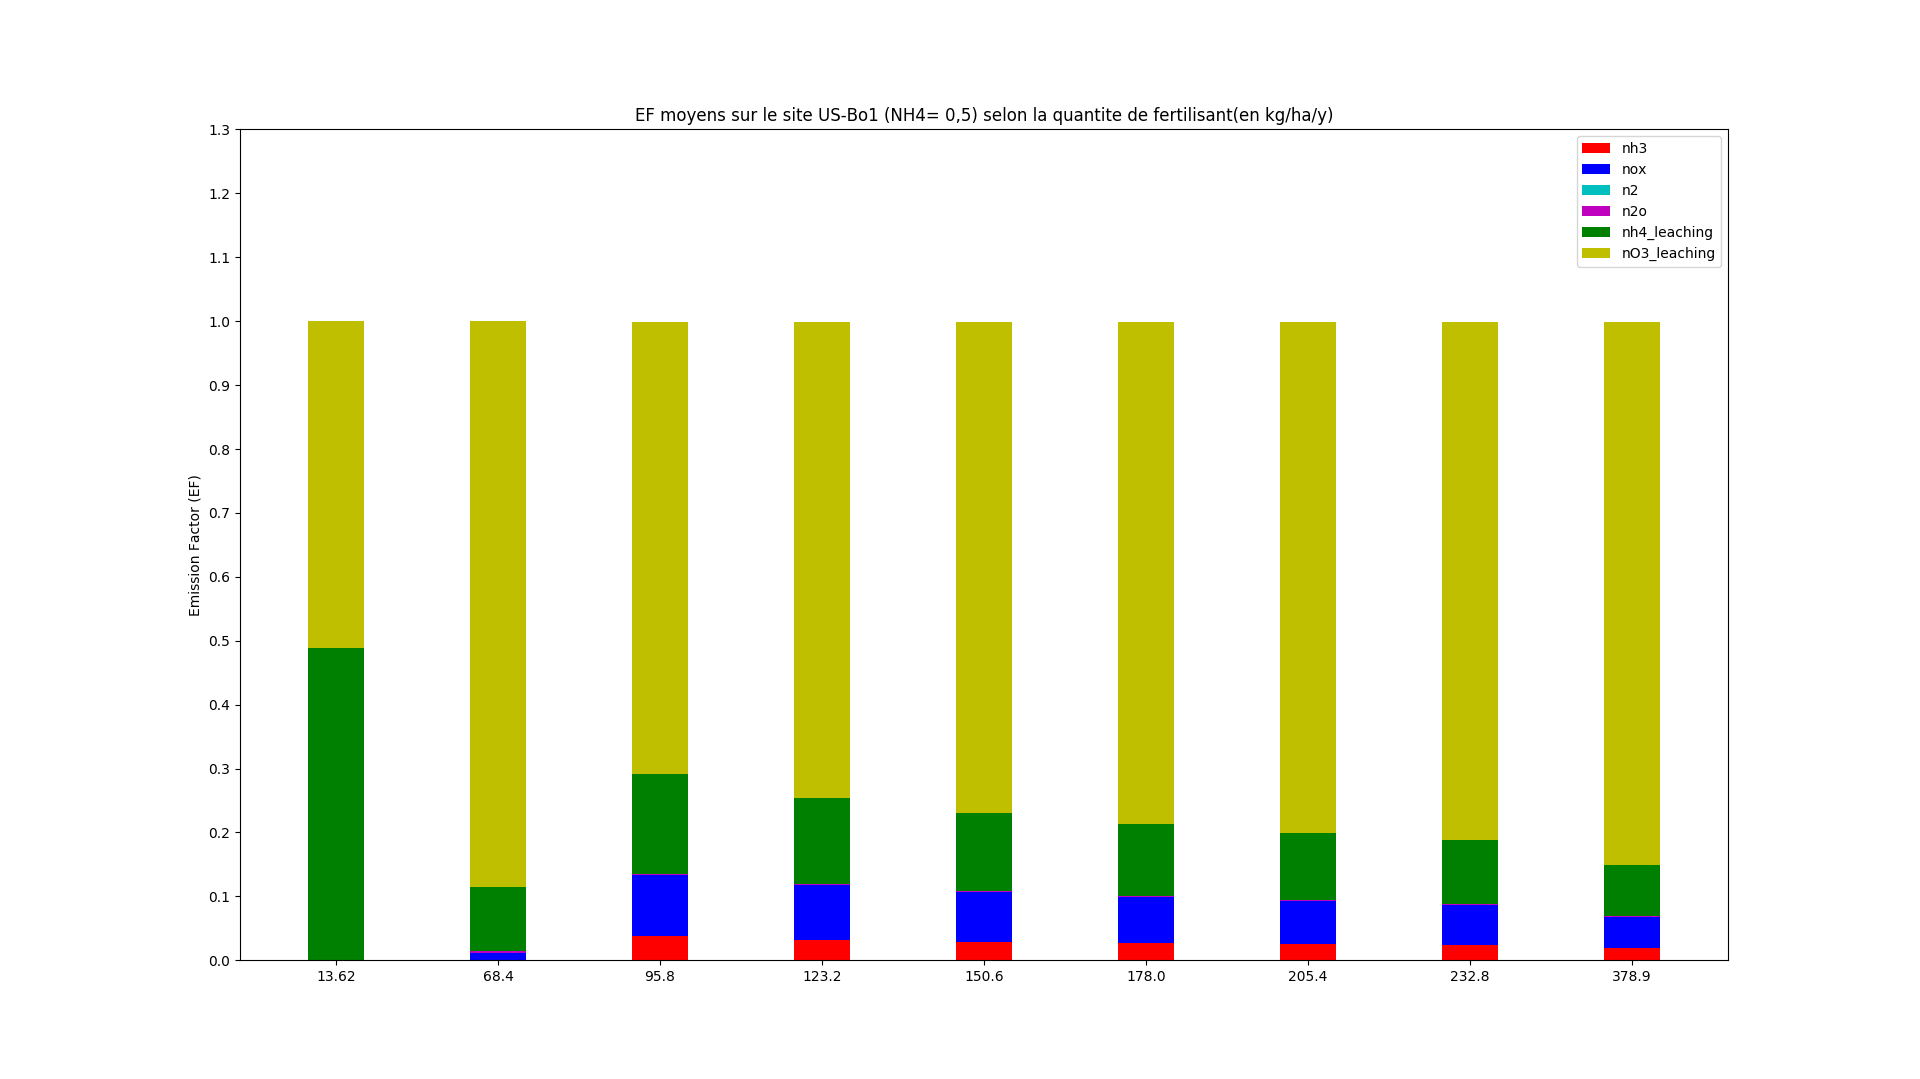
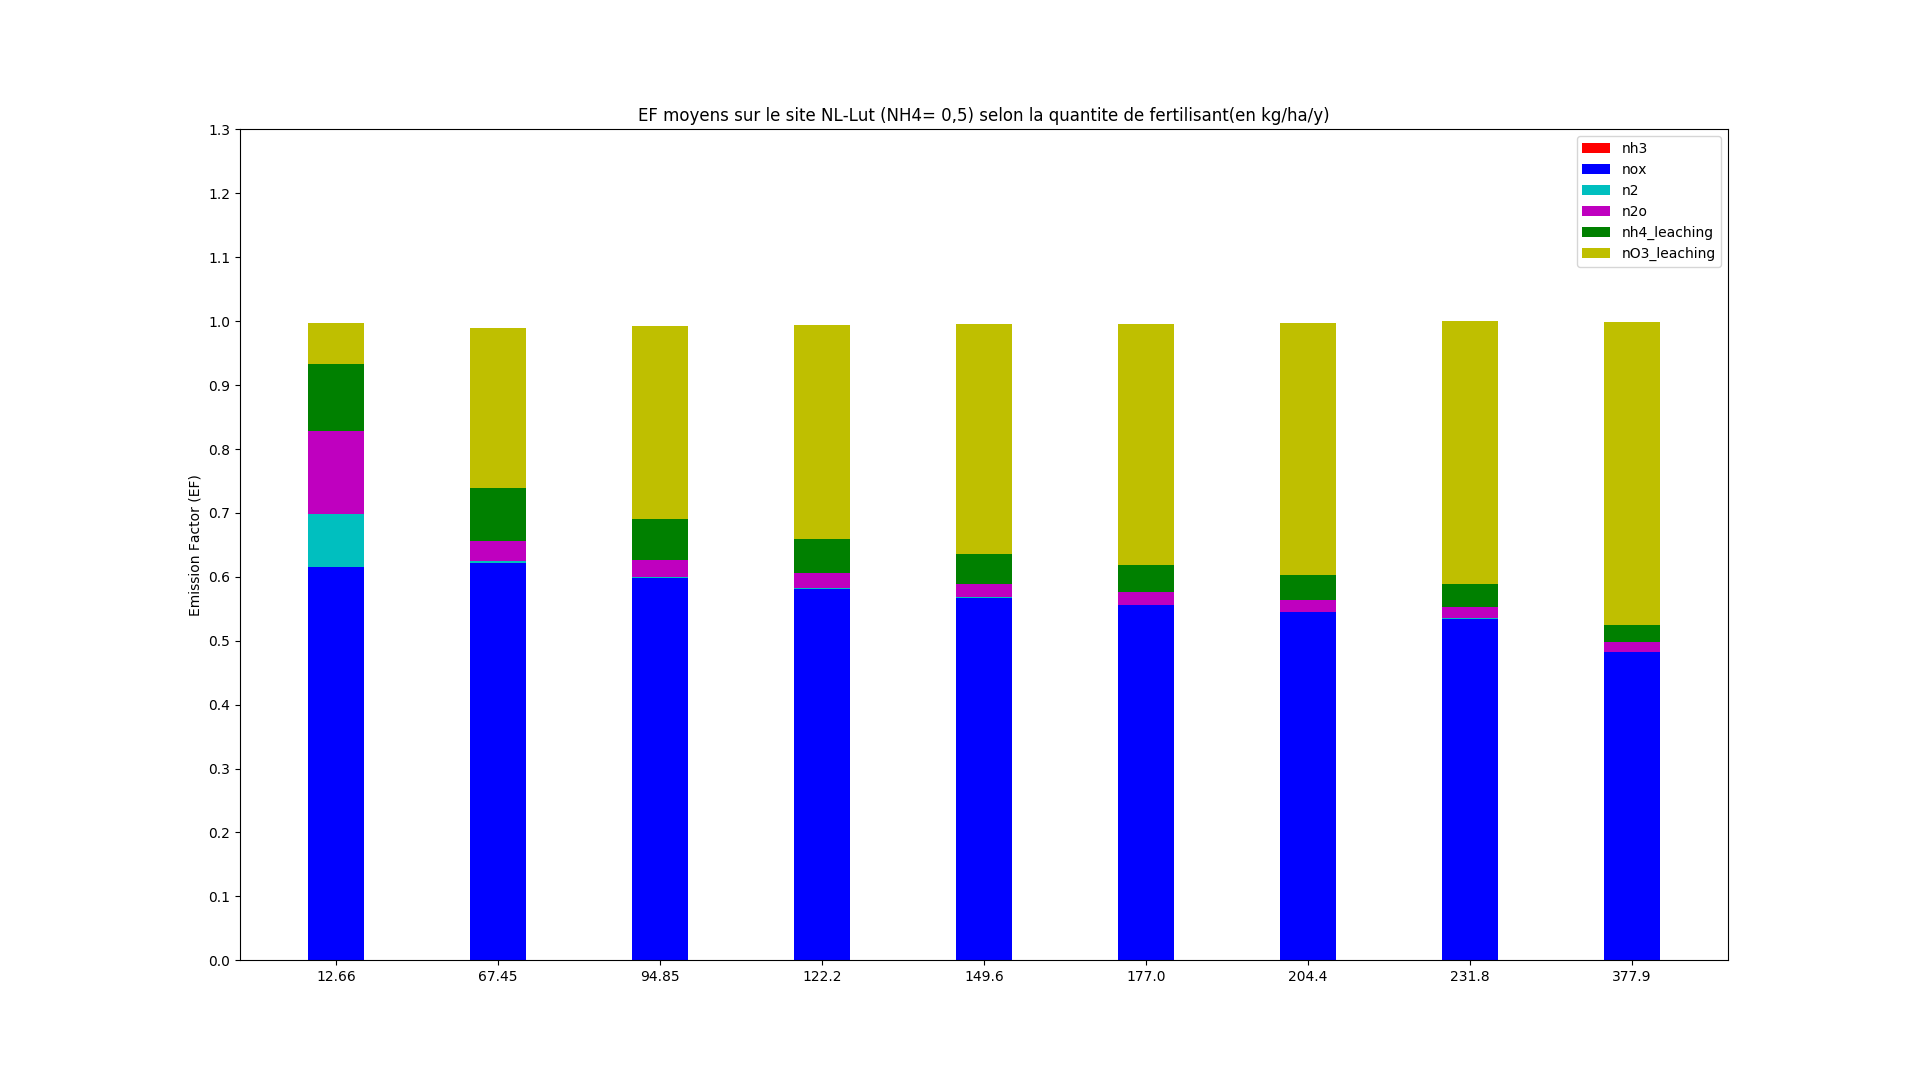
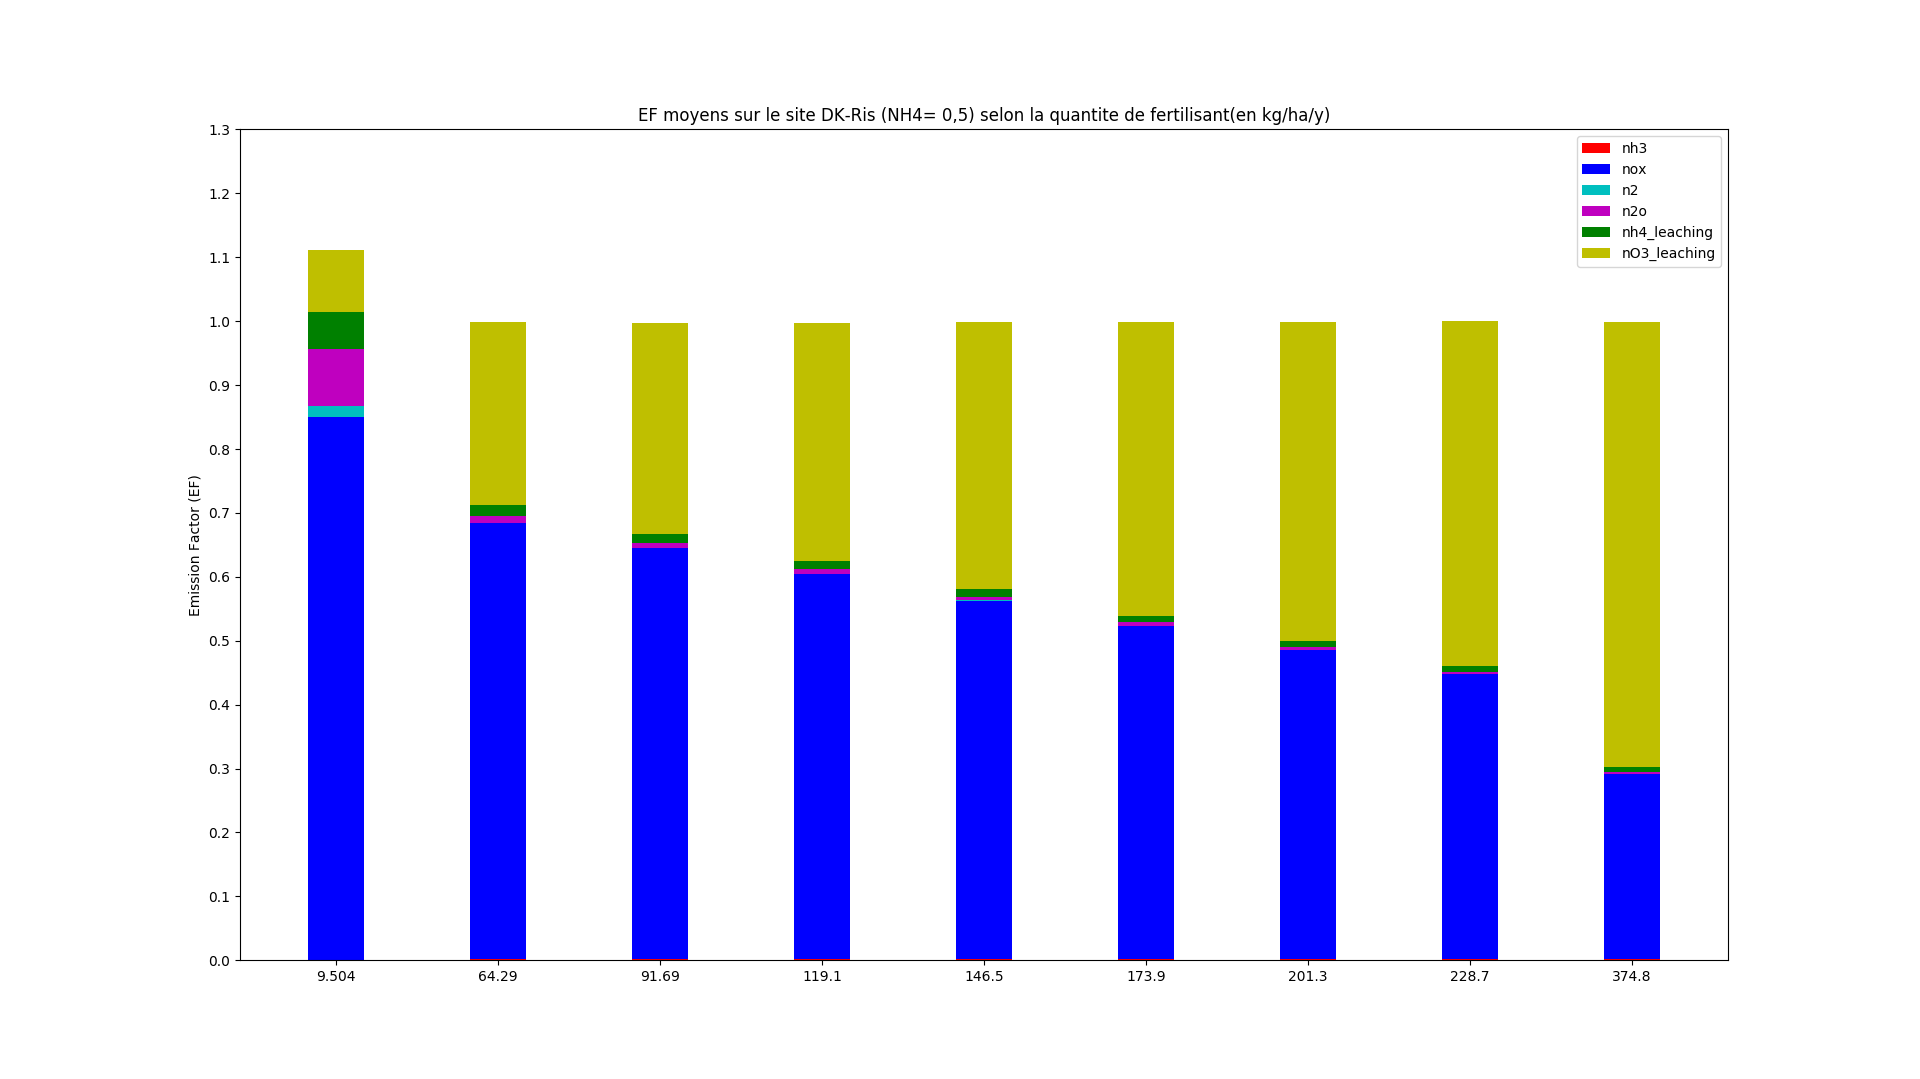
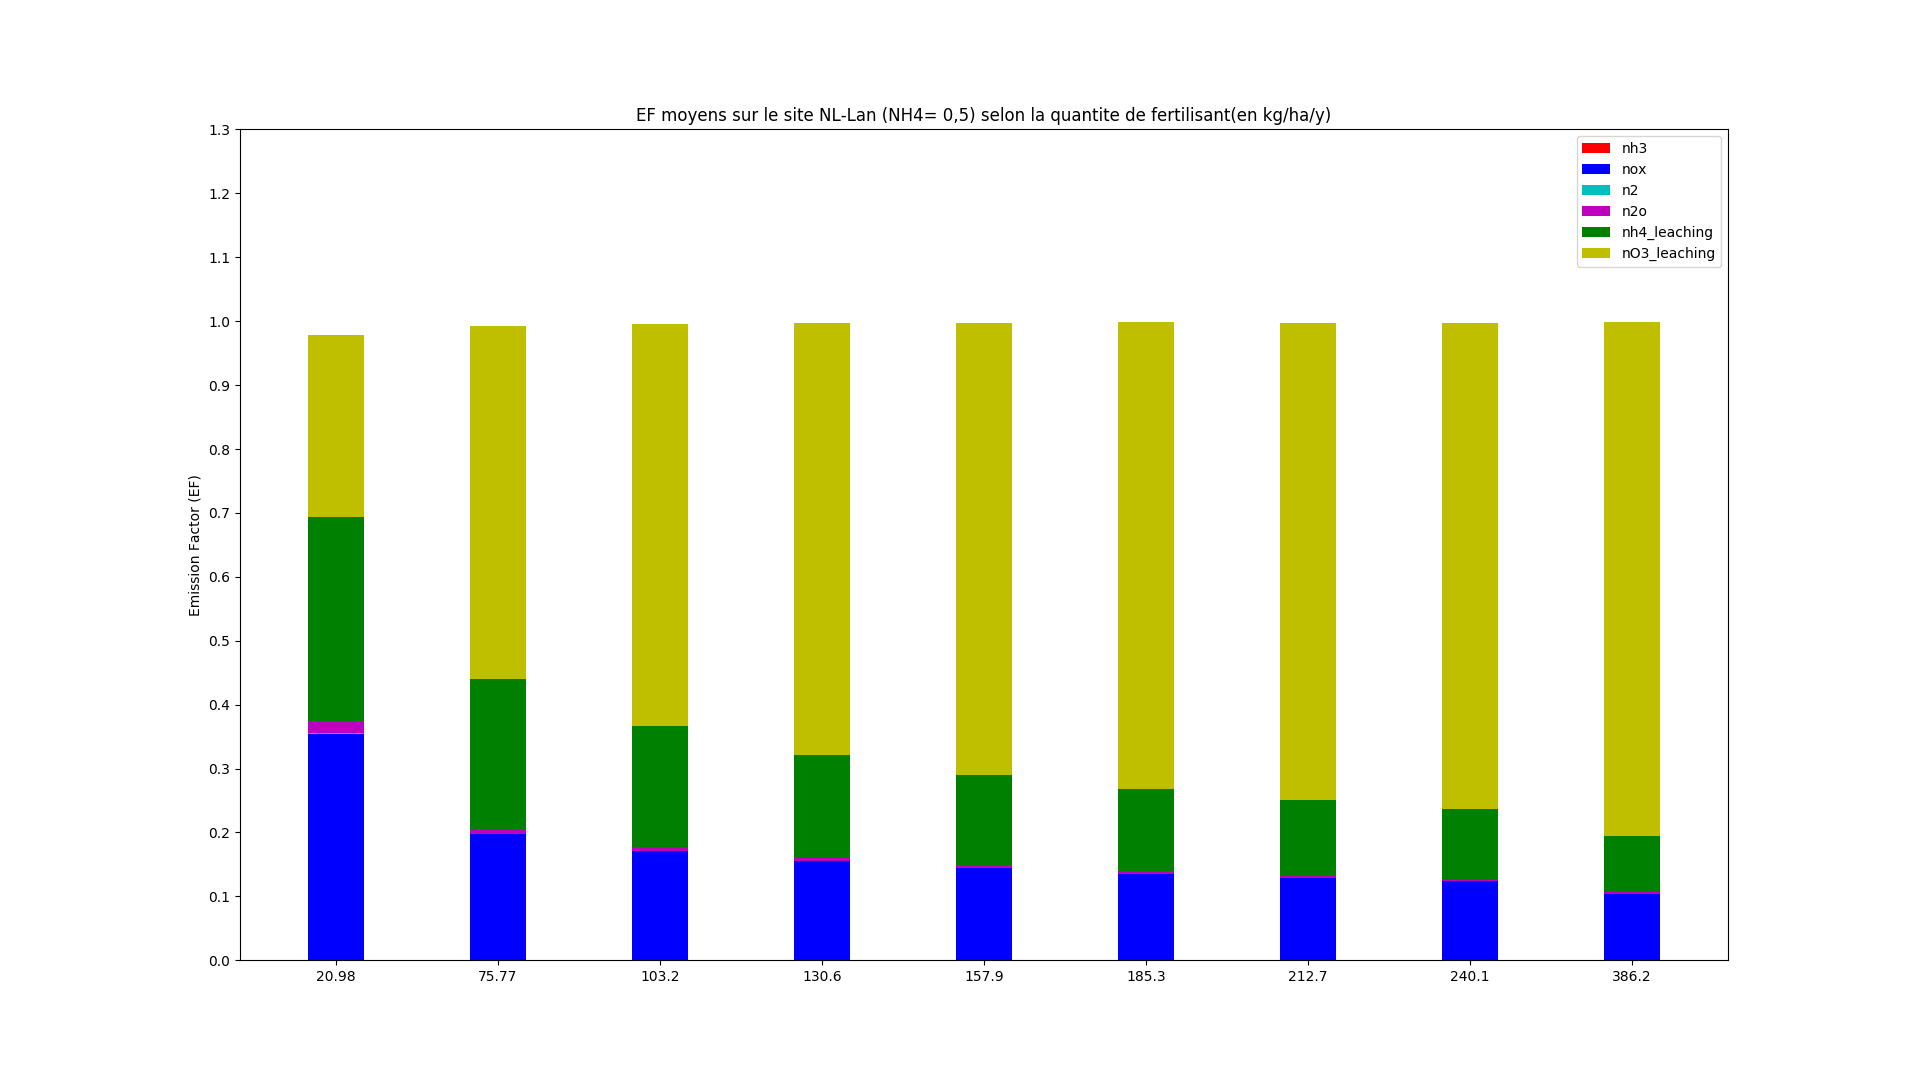
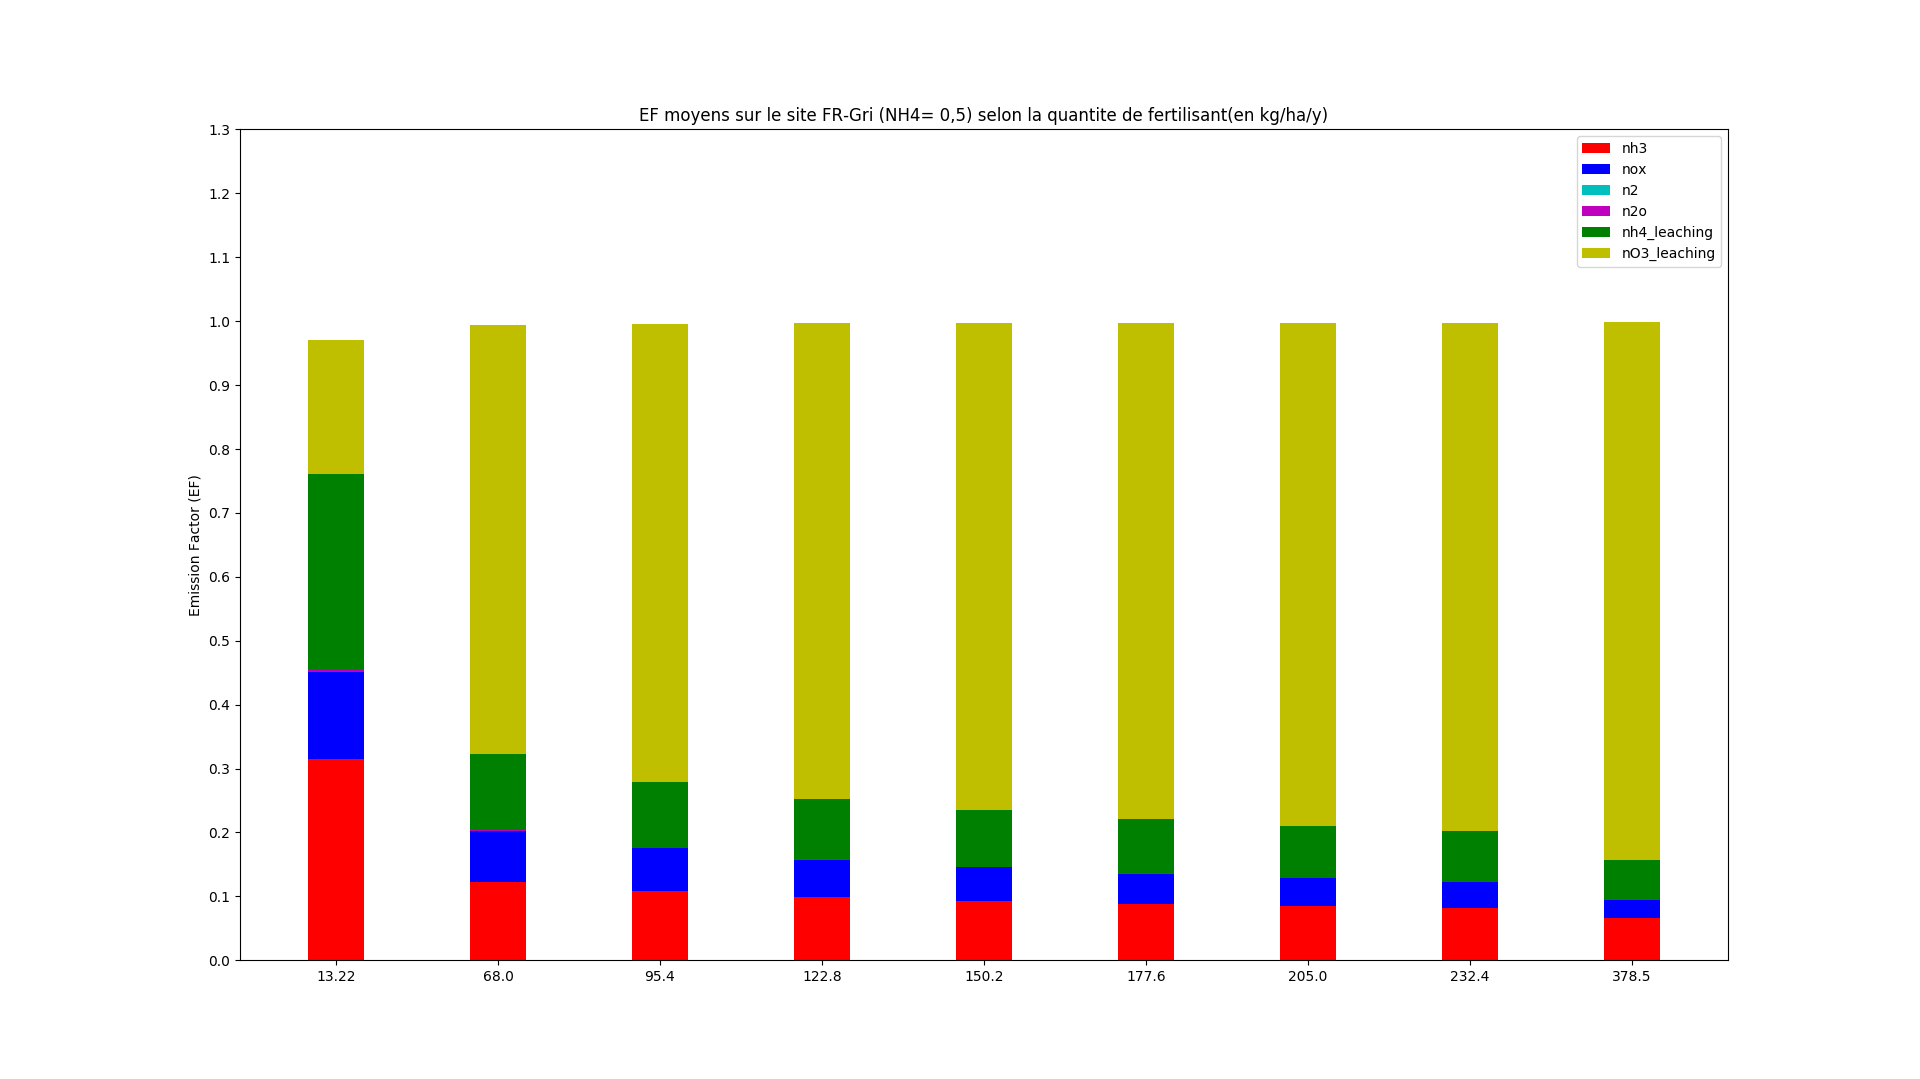
We calculated emission factor (EF) of different fluxes of nitrogen (NH3, N2, N2O and NOx emission, but also NH4 and NO3 leaching) with different methods :
. The first (A.) consisted to normalized the fluxes minus emissions when nfert=0 by the amount of fertiliser added ;
. The second (B.) consisted to normalized the fluxes by the amount of fertiliser added ;
. The third (C.) consisted to normalized the fluxes by the amount of all nitrogen inputs.
Script python used :
. barplot.py using files.txt in which values of nitrogen emissions and leaching are listed in order to plot EF in function of fertilizer added.
. barplot_c.py using files.txt in which values of nitrogen emissions and leaching are listed in order to plot EF in function of nitrogen inputs (fertilizer, NHx and NOx depositions).
. files.txt are in the folders :
/home/users/taudoux/documents/Results/B/Simuls_ratio0.5_v1/EF
/home/users/taudoux/documents/Results/B/Simuls_ratio0.5_v1/EFb
/home/users/taudoux/documents/Results/B/Simuls_ratio0.8_v1/EF
/home/users/taudoux/documents/Results/B/Simuls_ratio0.8_v1/EFb
- EF of each parameters on each site for NH4%=0.5 and 0.8
path : /home/users/taudoux/documents/Results/B/EF/
The first (A.) consisted to normalized the fluxes minus emissions when nfert=0 by the amount of fertiliser added.
| DK-Ris | |
|---|---|
| 0.5 | 0.8 |
 | 
|
| FR-Gri | |
|---|---|
| 0.5 | 0.8 |
 | 
|
| NL-Lan | |
|---|---|
| 0.5 | 0.8 |
 | 
|
| NL-Lut | |
|---|---|
| 0.5 | 0.8 |
 | 
|
| US-Bo1 | |
|---|---|
| 0.5 | 0.8 |
 | 
|
| US-Ne1 | |
|---|---|
| 0.5 | 0.8 |
 | 
|
| US-Ne2 | |
|---|---|
| 0.5 | 0.8 |
 | 
|
| US-Ne3 | |
|---|---|
| 0.5 | 0.8 |
 | 
|
- EF of each parameters on each site for NH4%=0.5 and 0.8
path : /home/users/taudoux/documents/Results/B/EFb/
The second (B.) consisted to normalized the fluxes by the amount of fertiliser added.
| DK-Ris | |
|---|---|
| 0.5 | 0.8 |
 | 
|
| FR-Gri | |
|---|---|
| 0.5 | 0.8 |
 | 
|
| NL-Lan | |
|---|---|
| 0.5 | 0.8 |
 | 
|
| NL-Lut | |
|---|---|
| 0.5 | 0.8 |
 | 
|
| US-Bo1 | |
|---|---|
| 0.5 | 0.8 |
 | 
|
| US-Ne1 | |
|---|---|
| 0.5 | 0.8 |
 | 
|
| US-Ne2 | |
|---|---|
| 0.5 | 0.8 |
 | 
|
| US-Ne3 | |
|---|---|
| 0.5 | 0.8 |
 | 
|
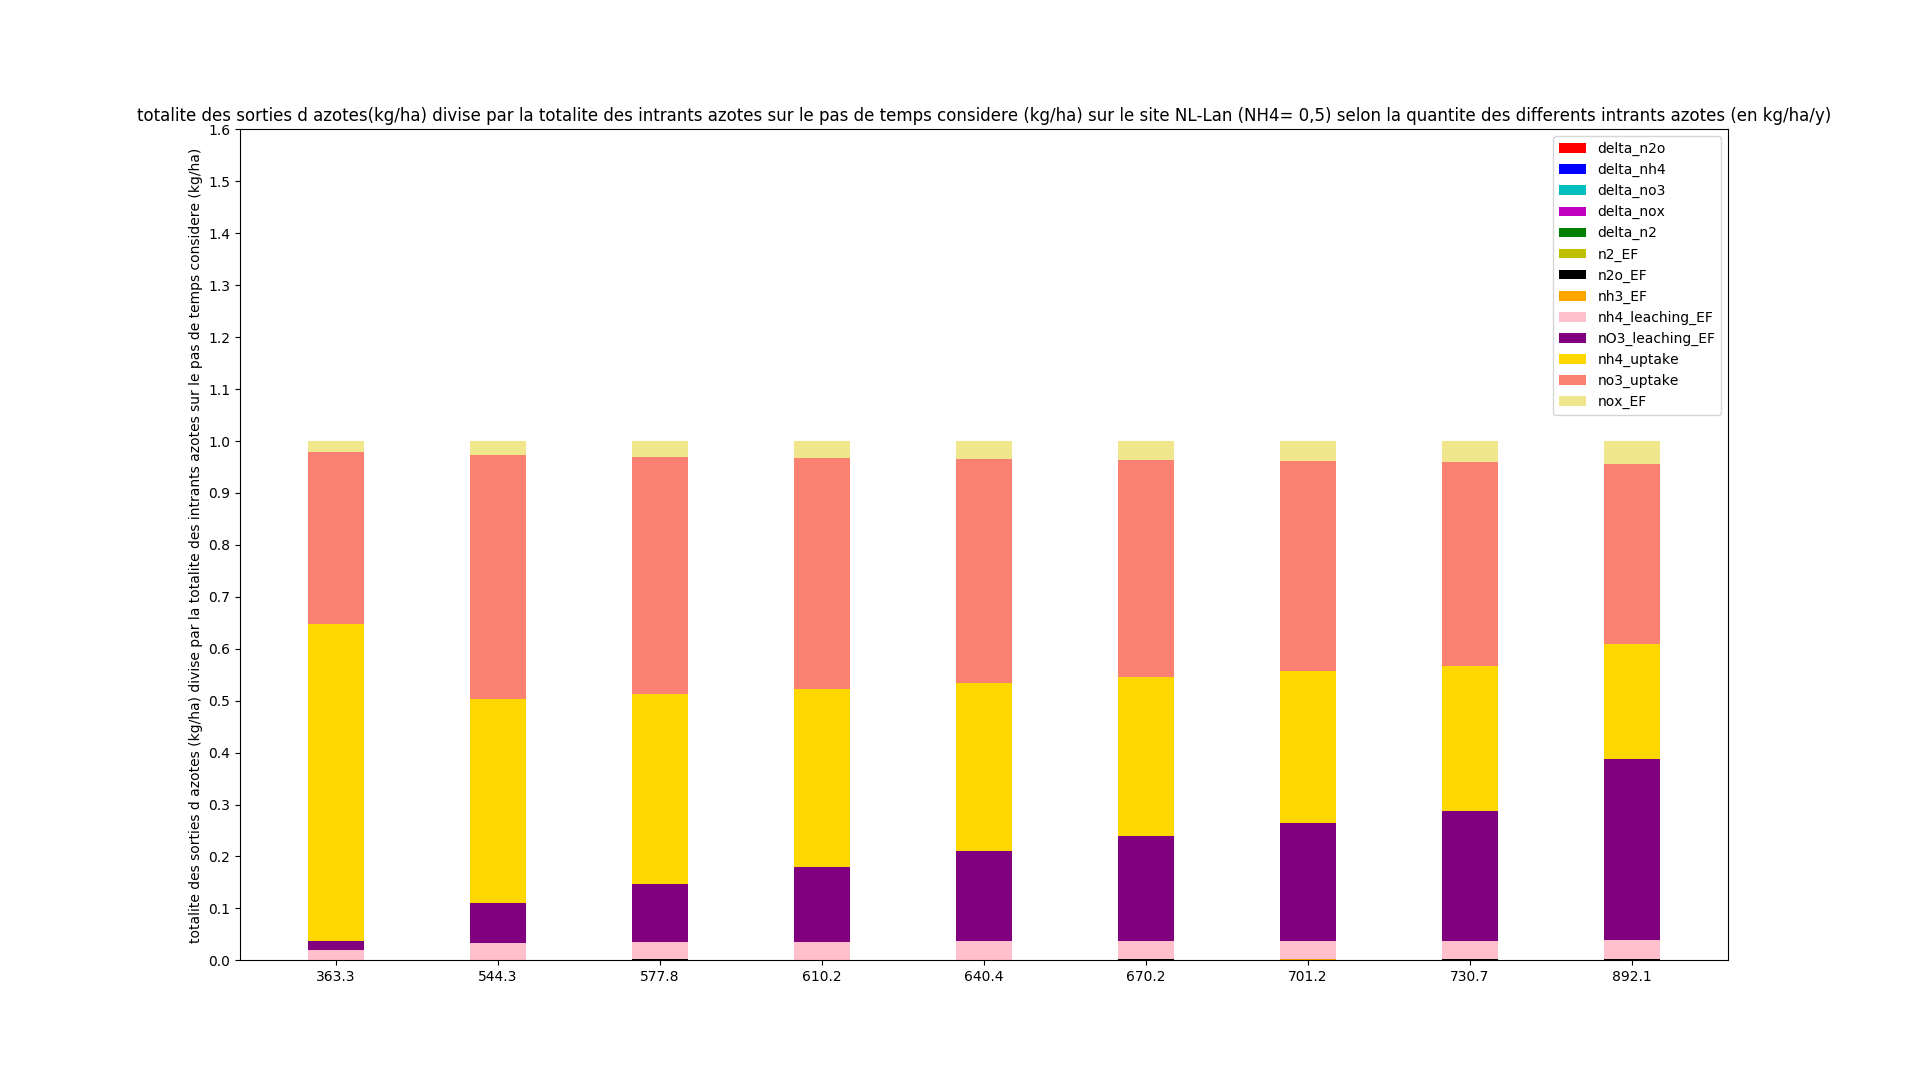
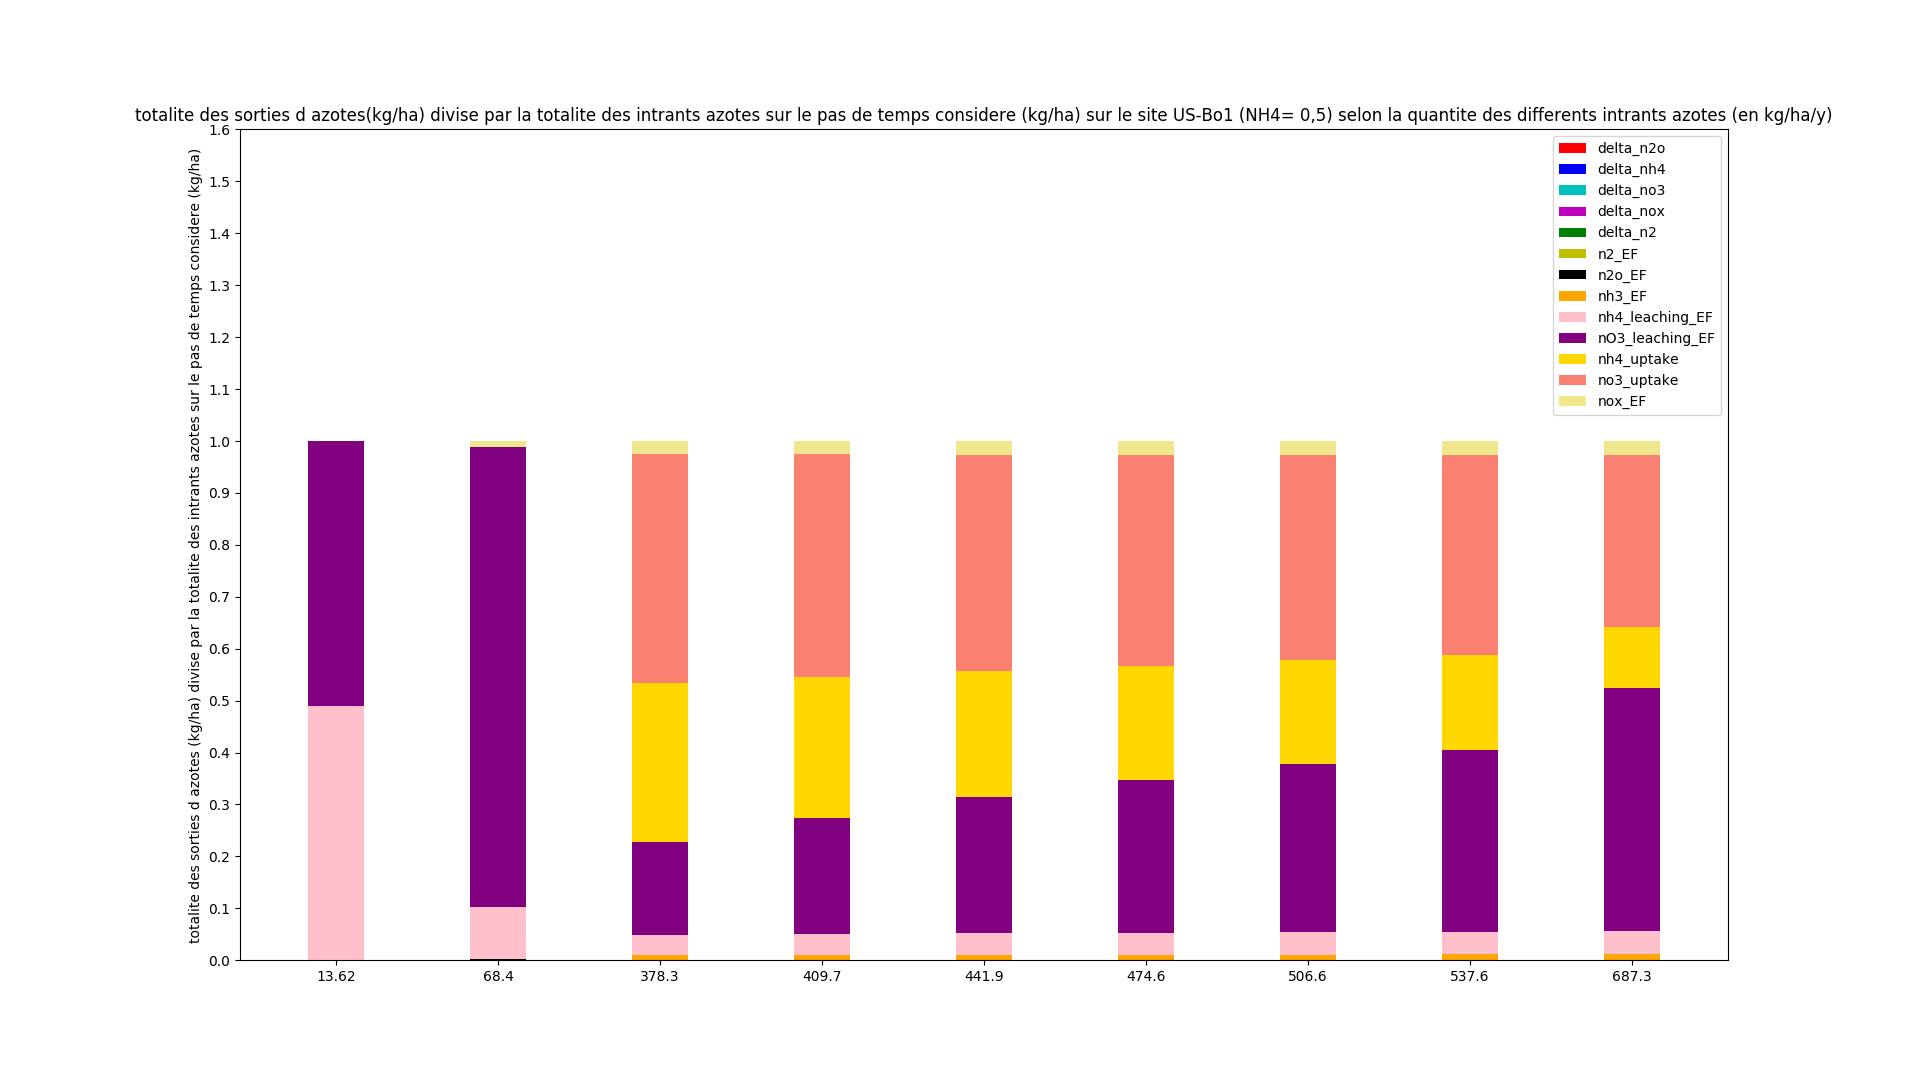
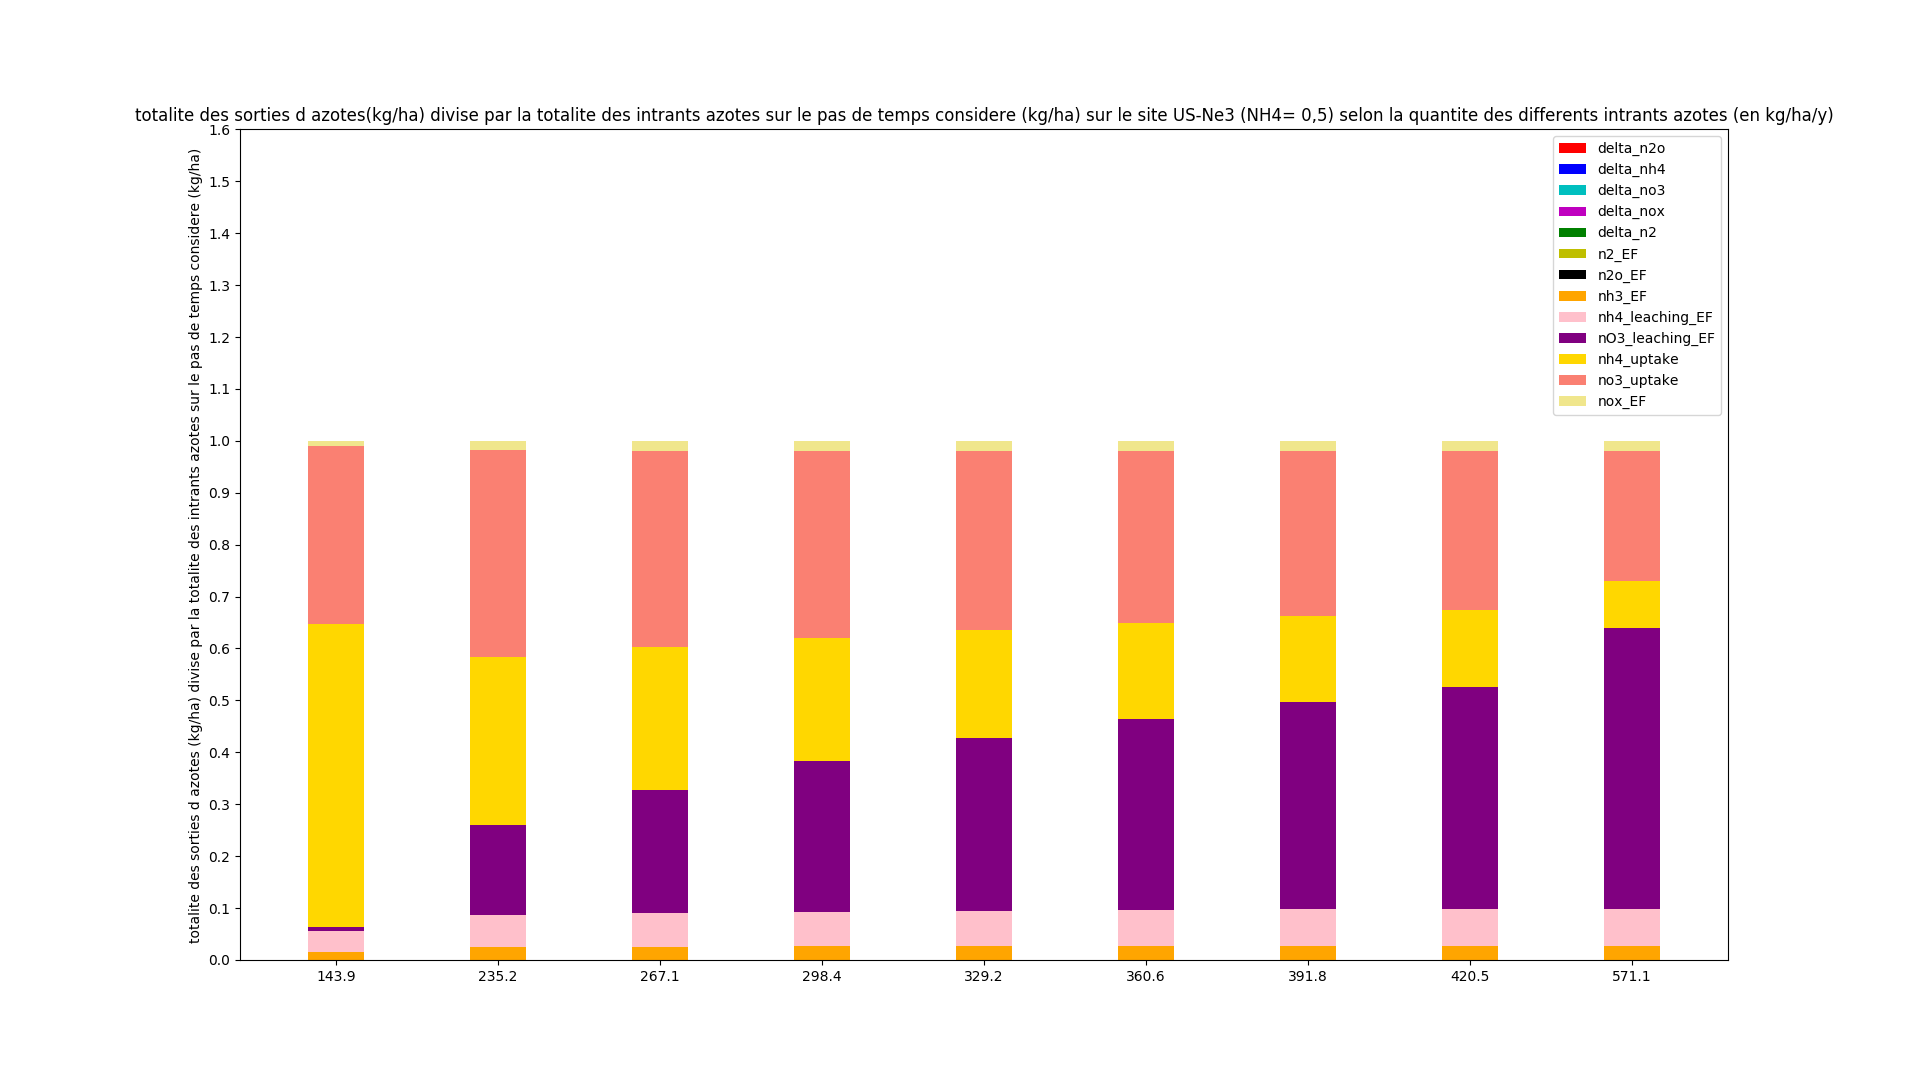
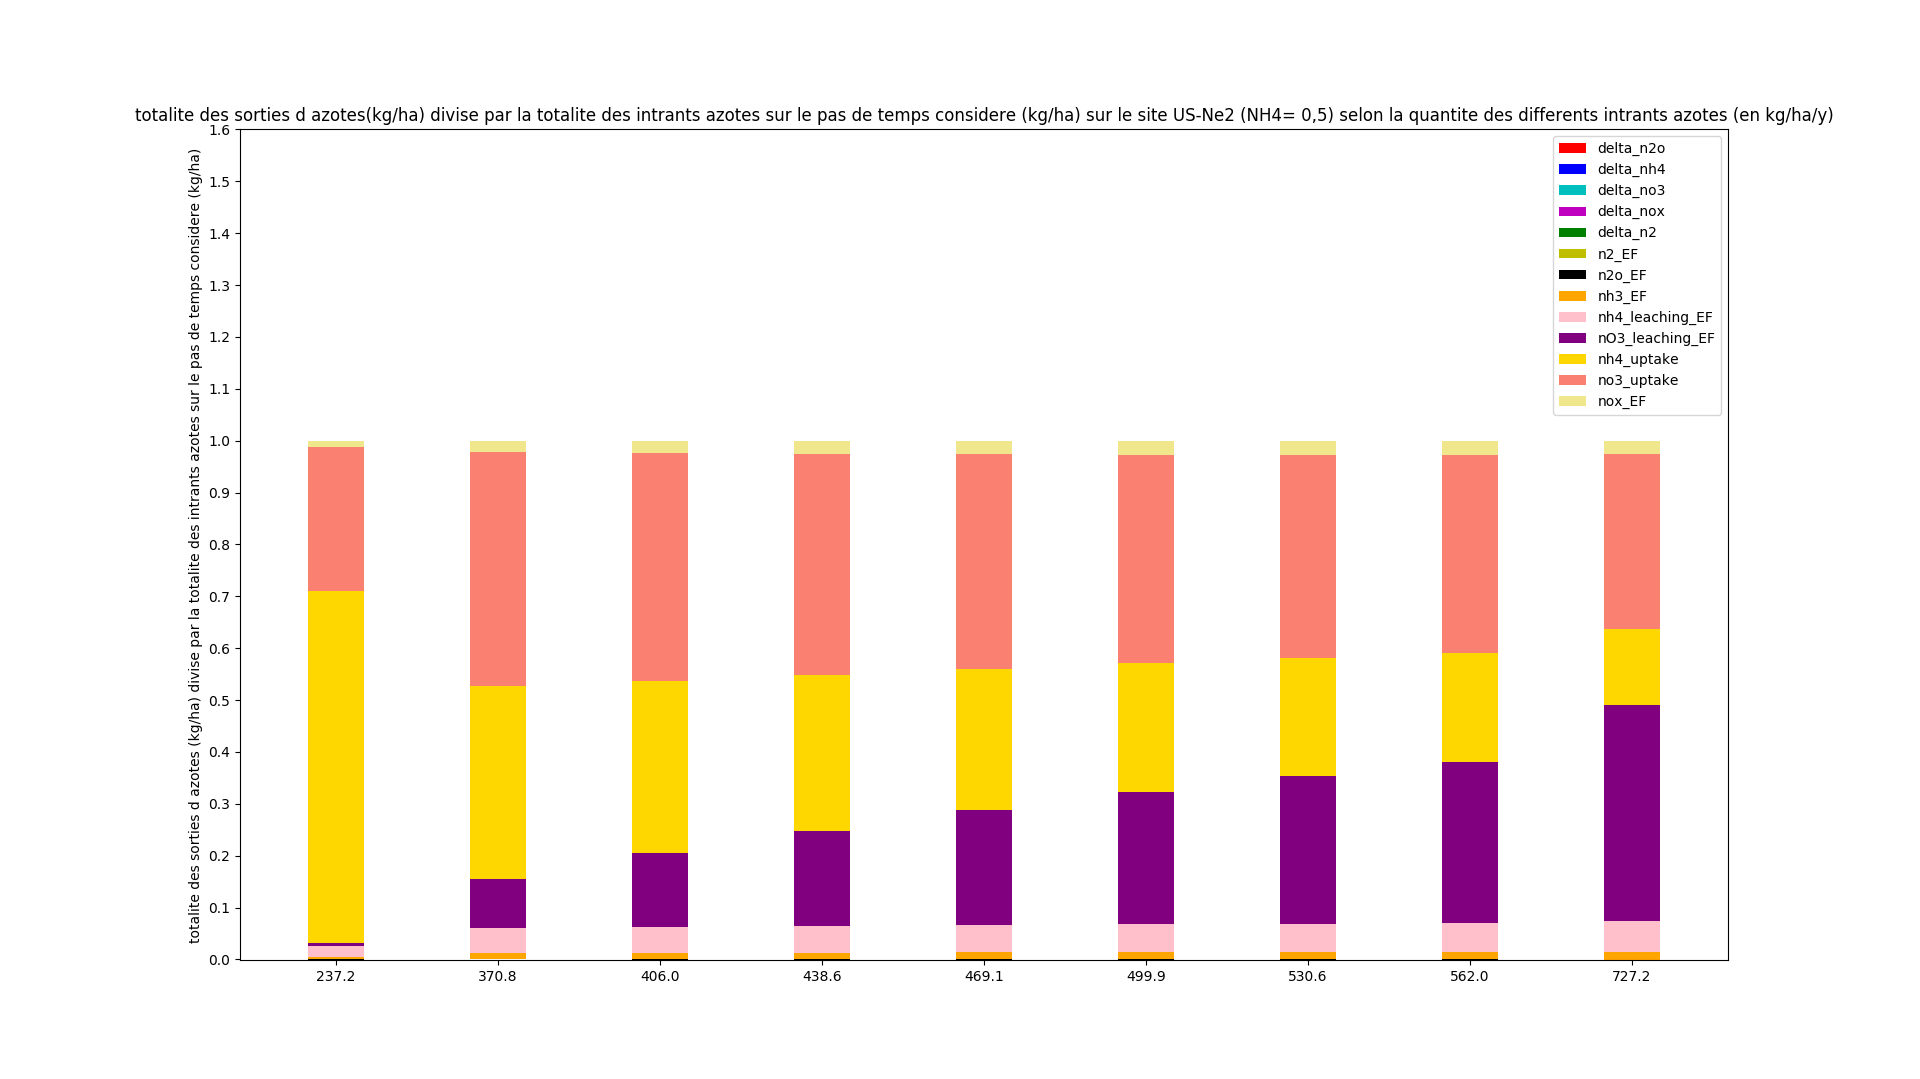
- EF of each parameters on each site for NH4%=0.5 and 0.8
path : /home/users/taudoux/documents/Results/B/EFc/
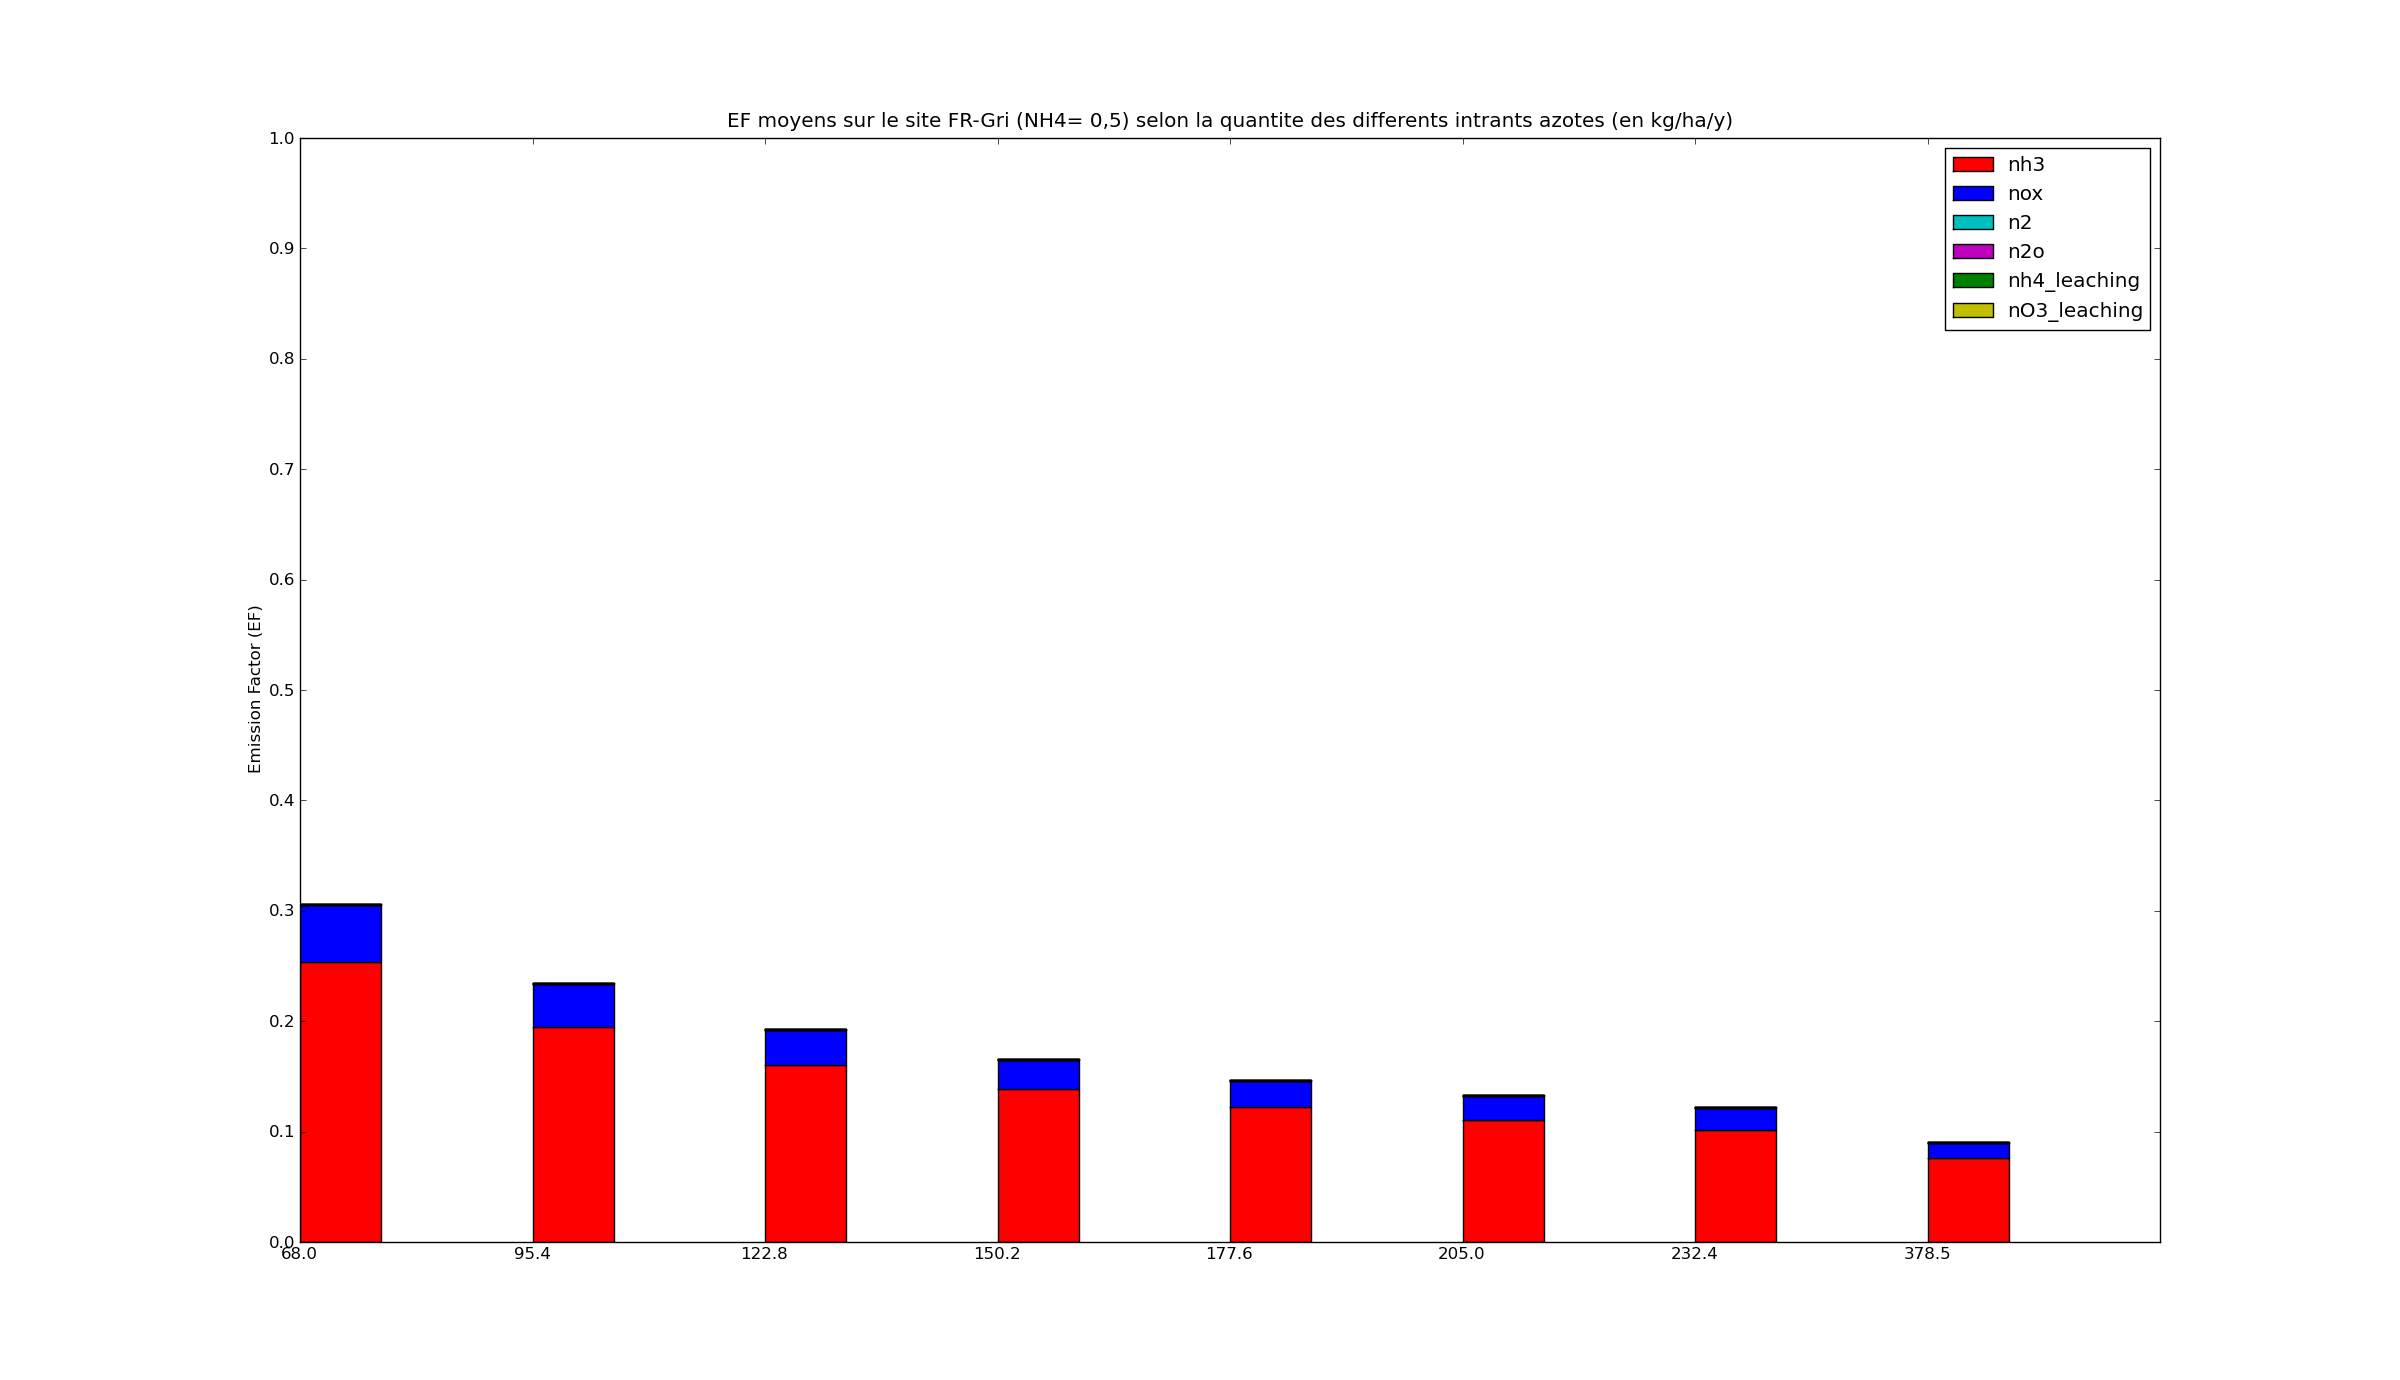
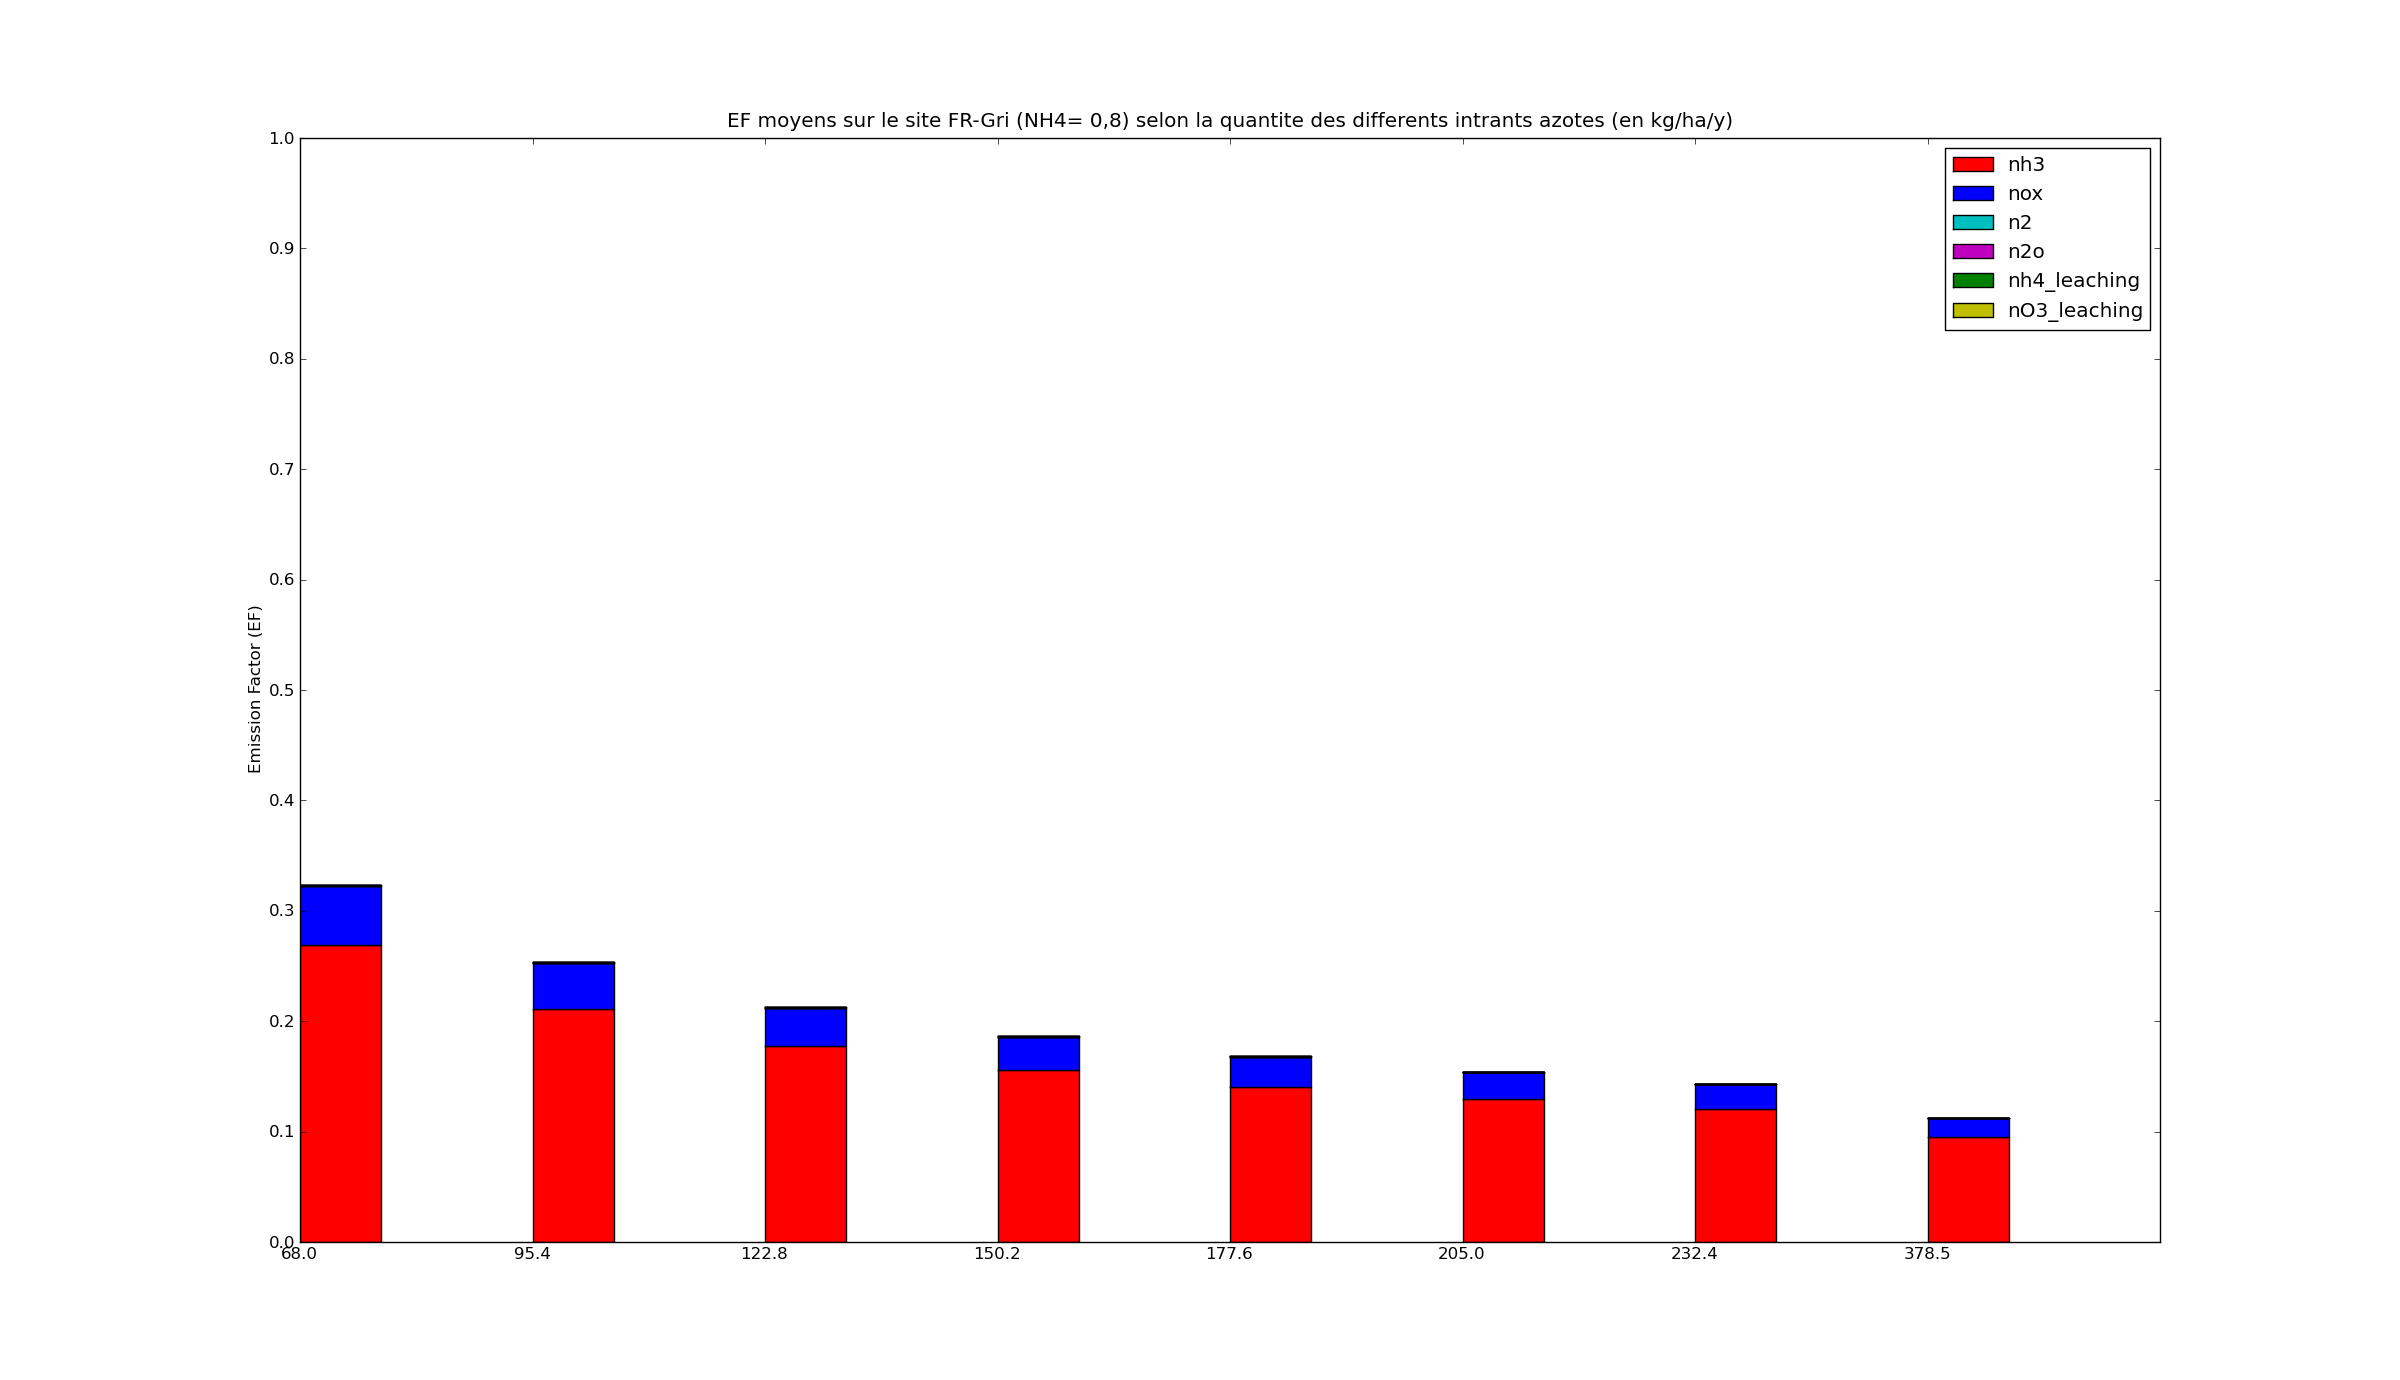
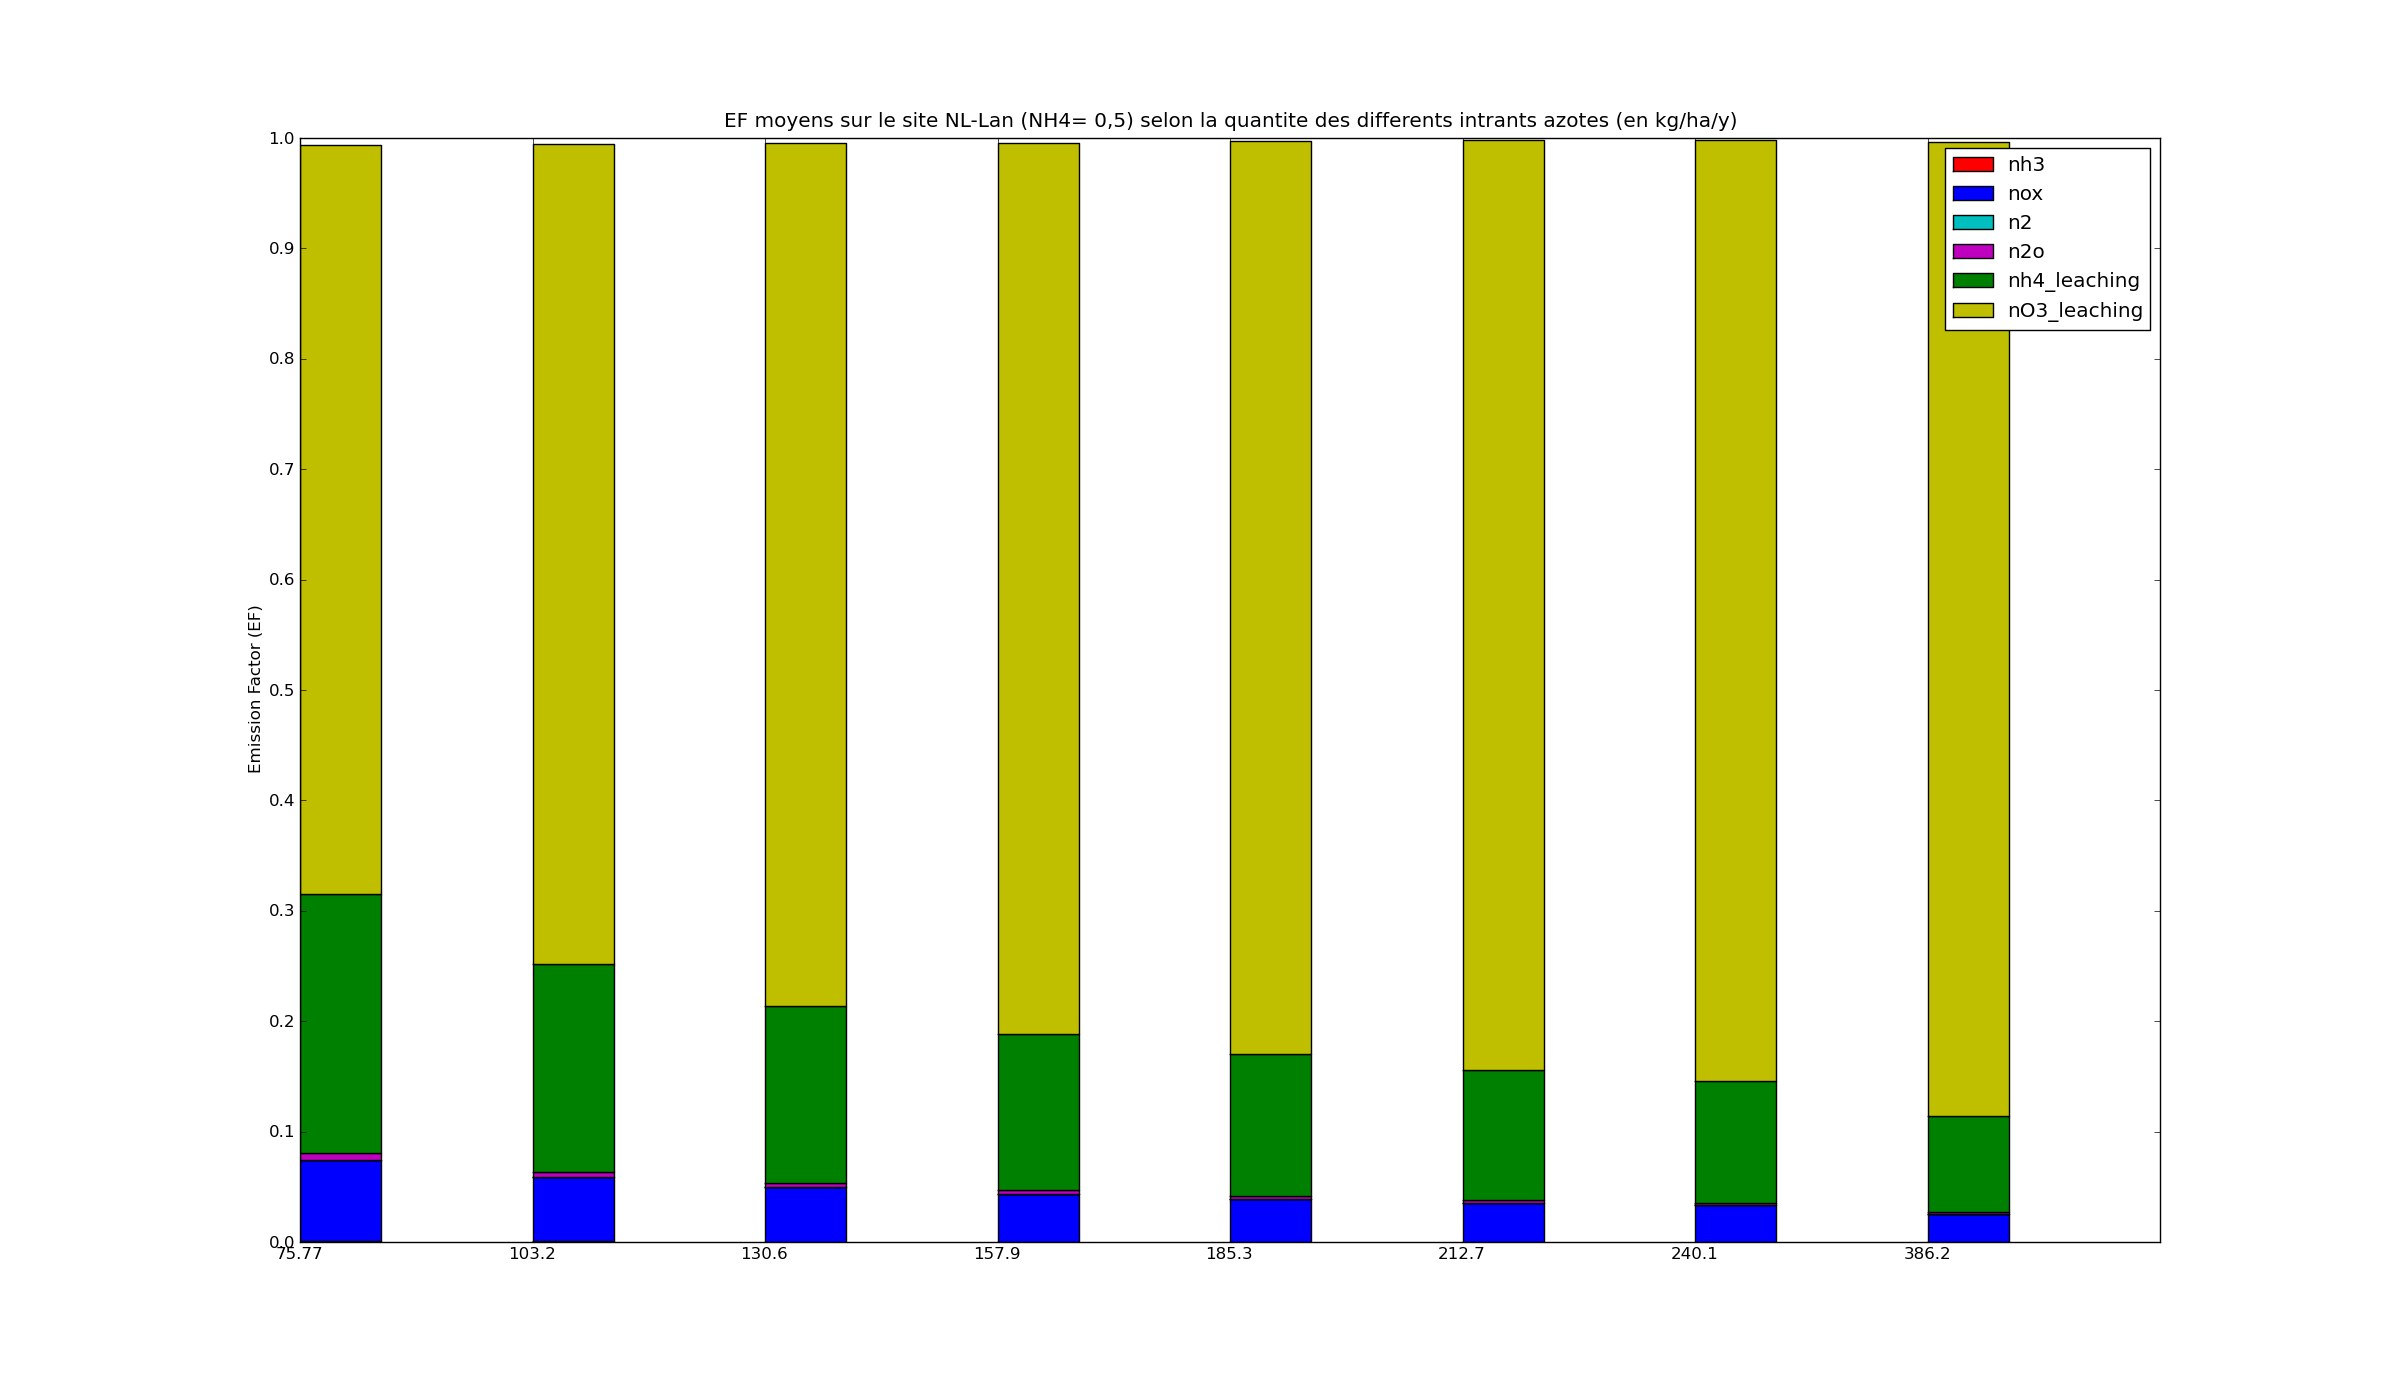
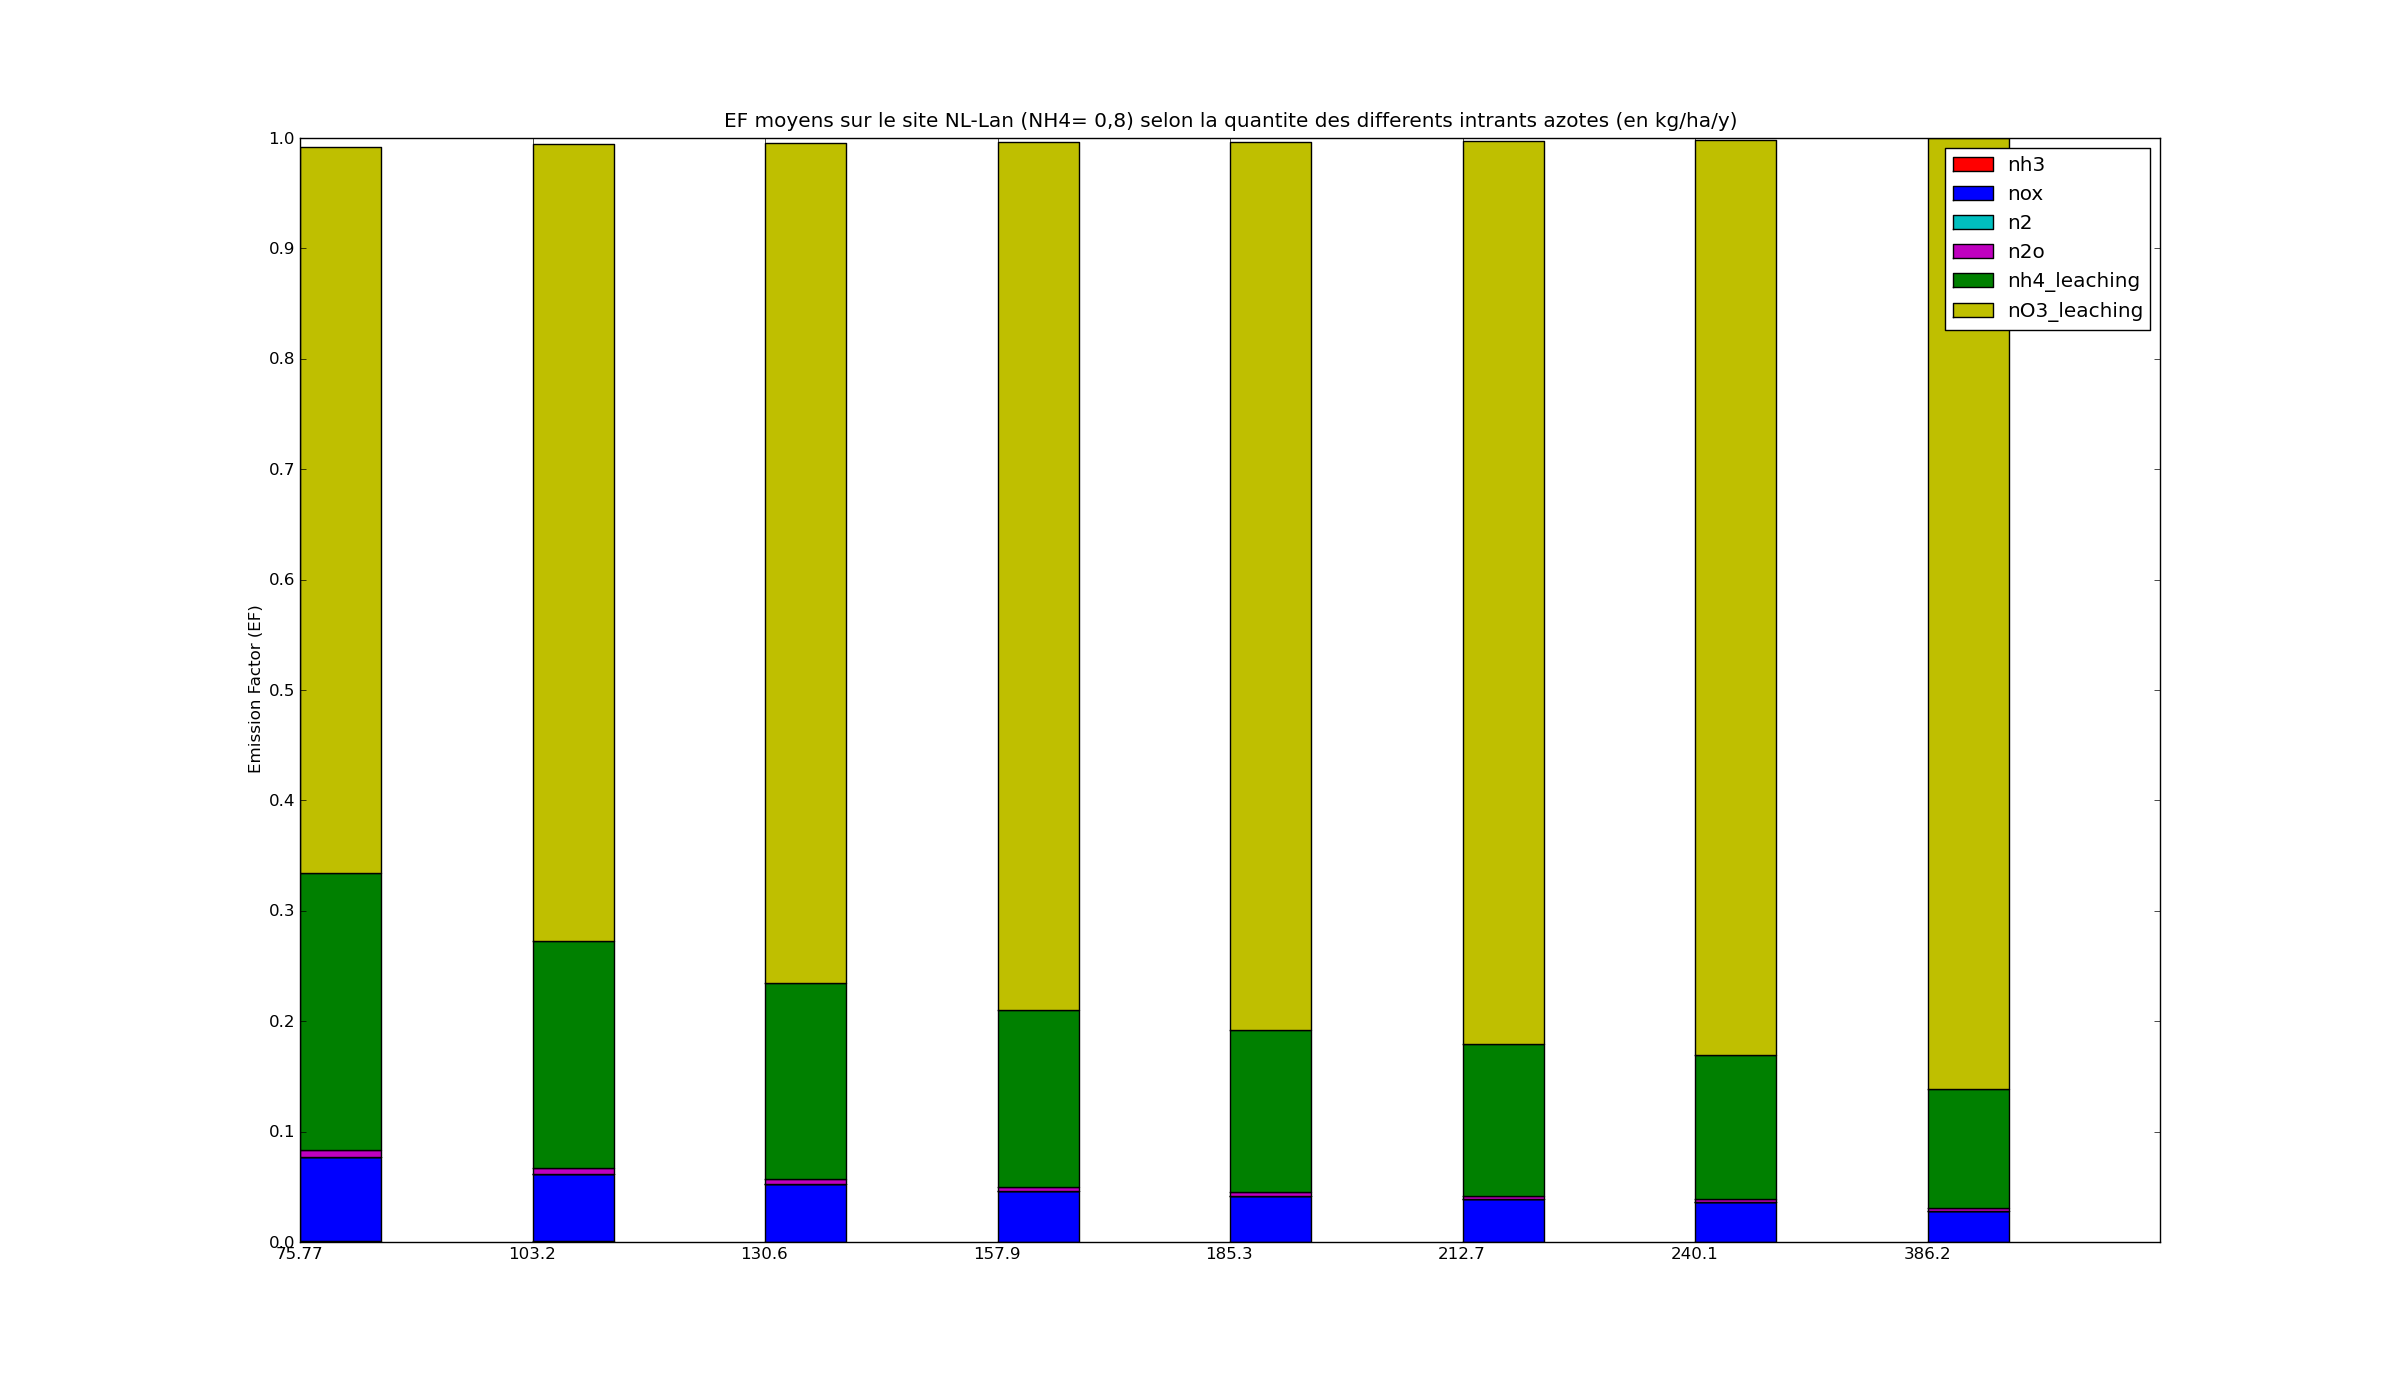
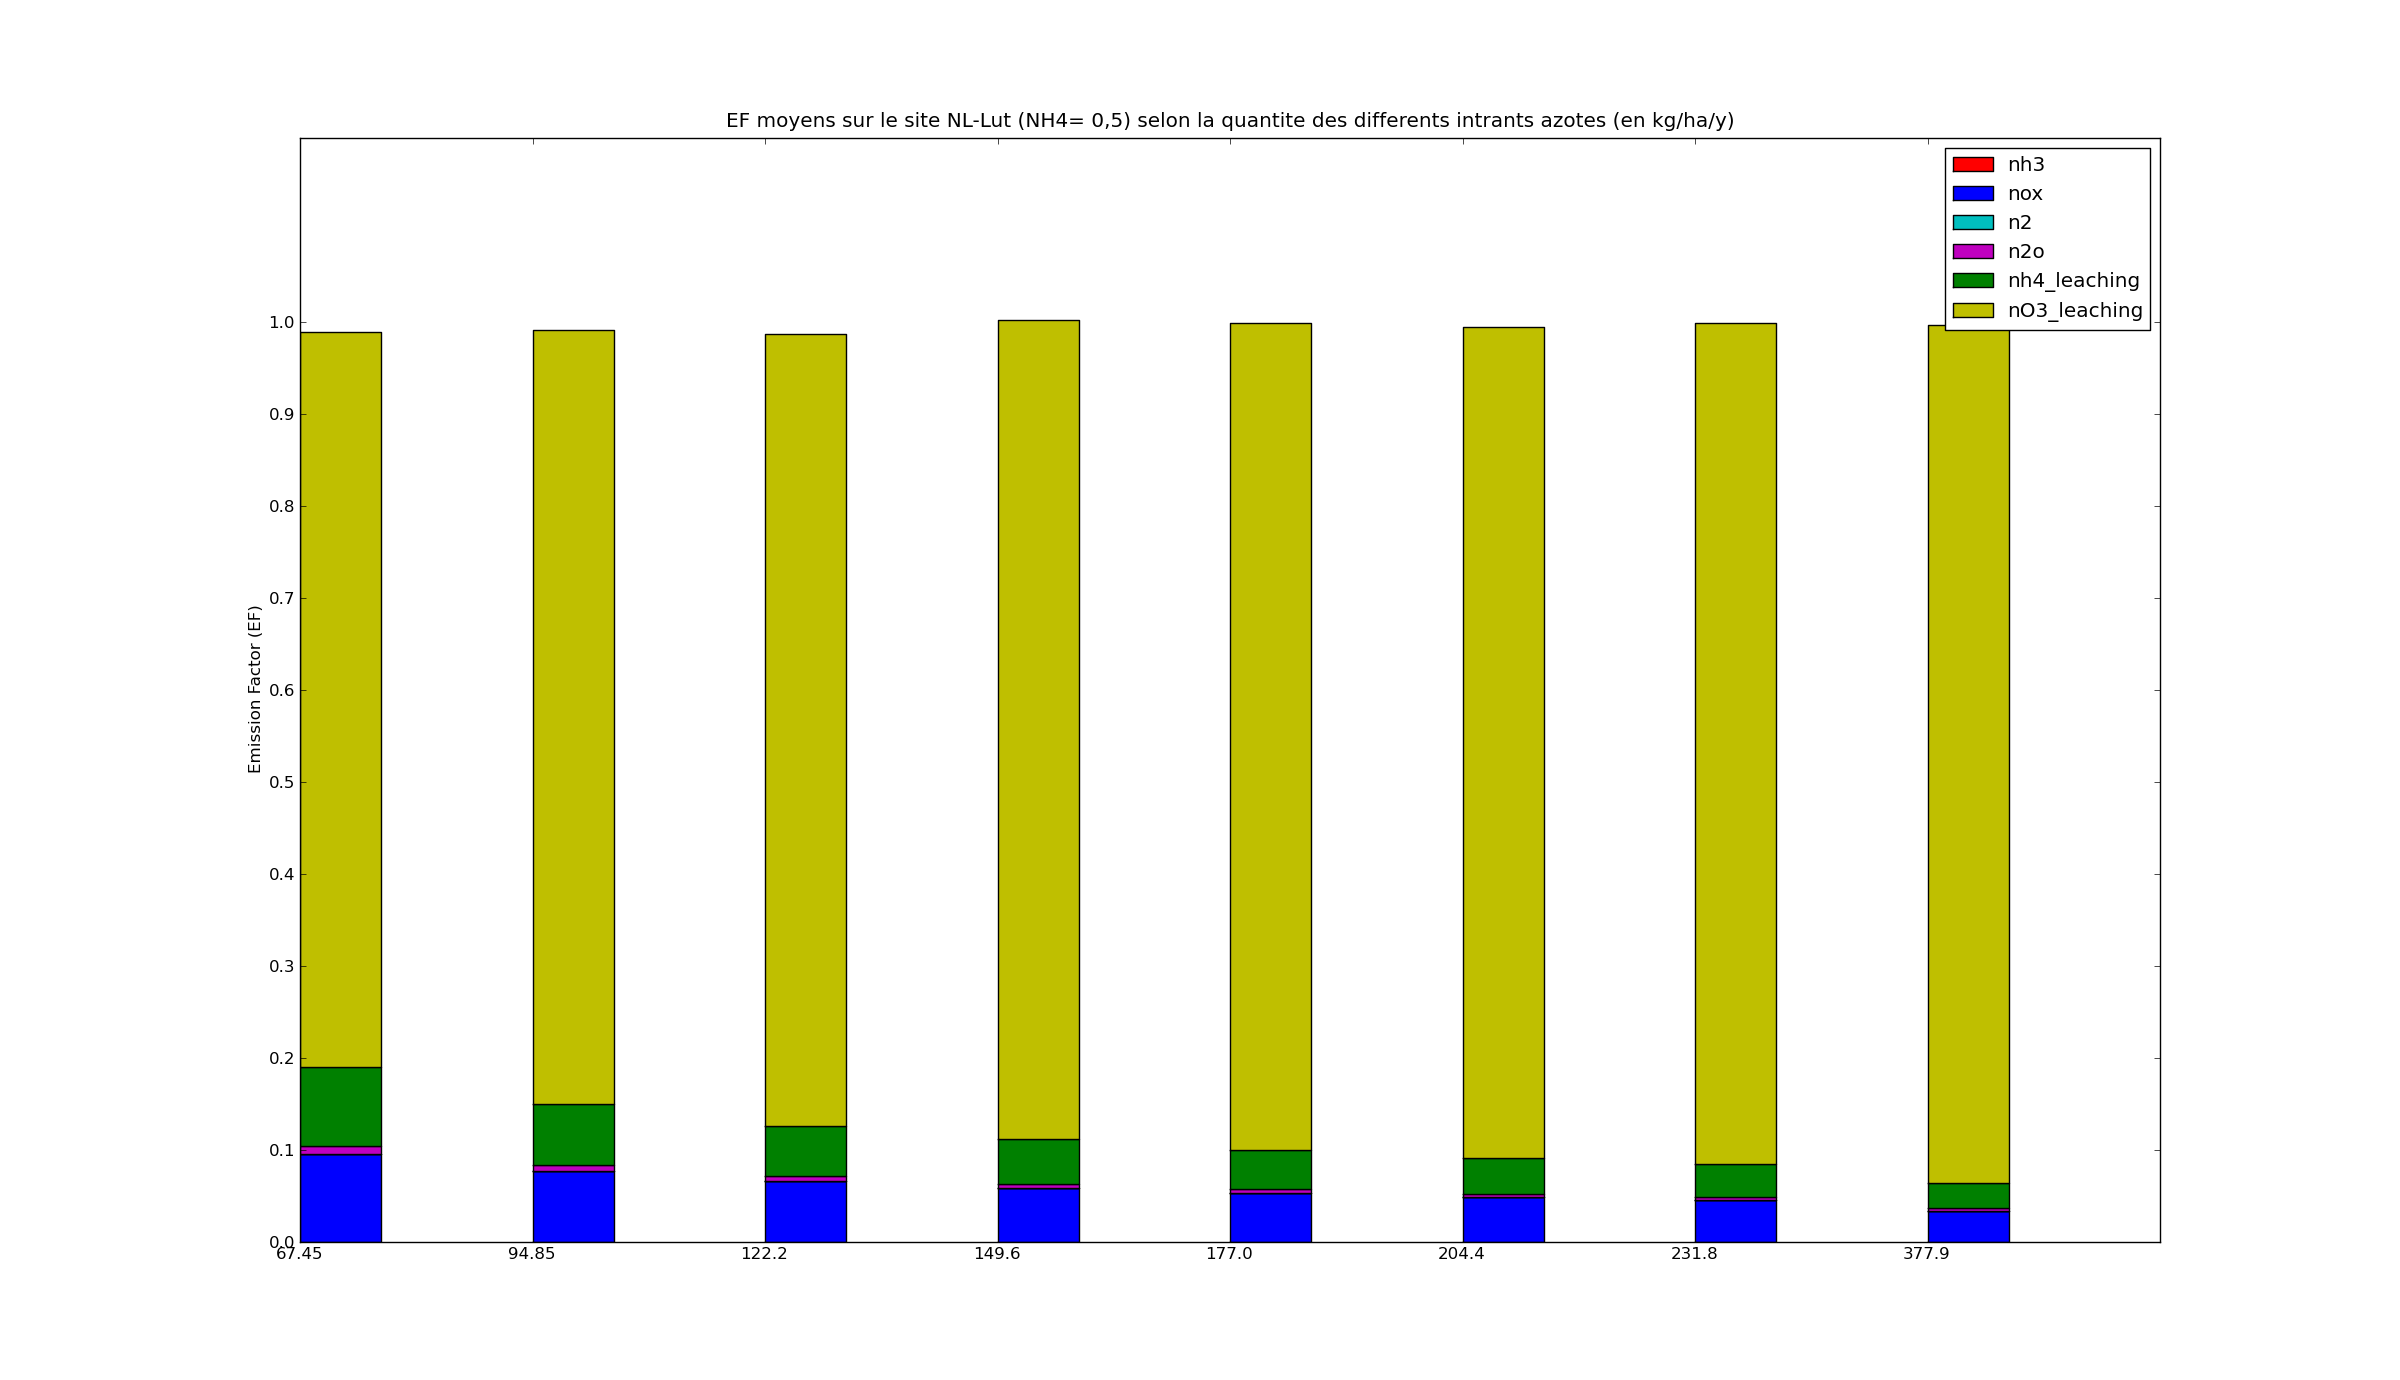
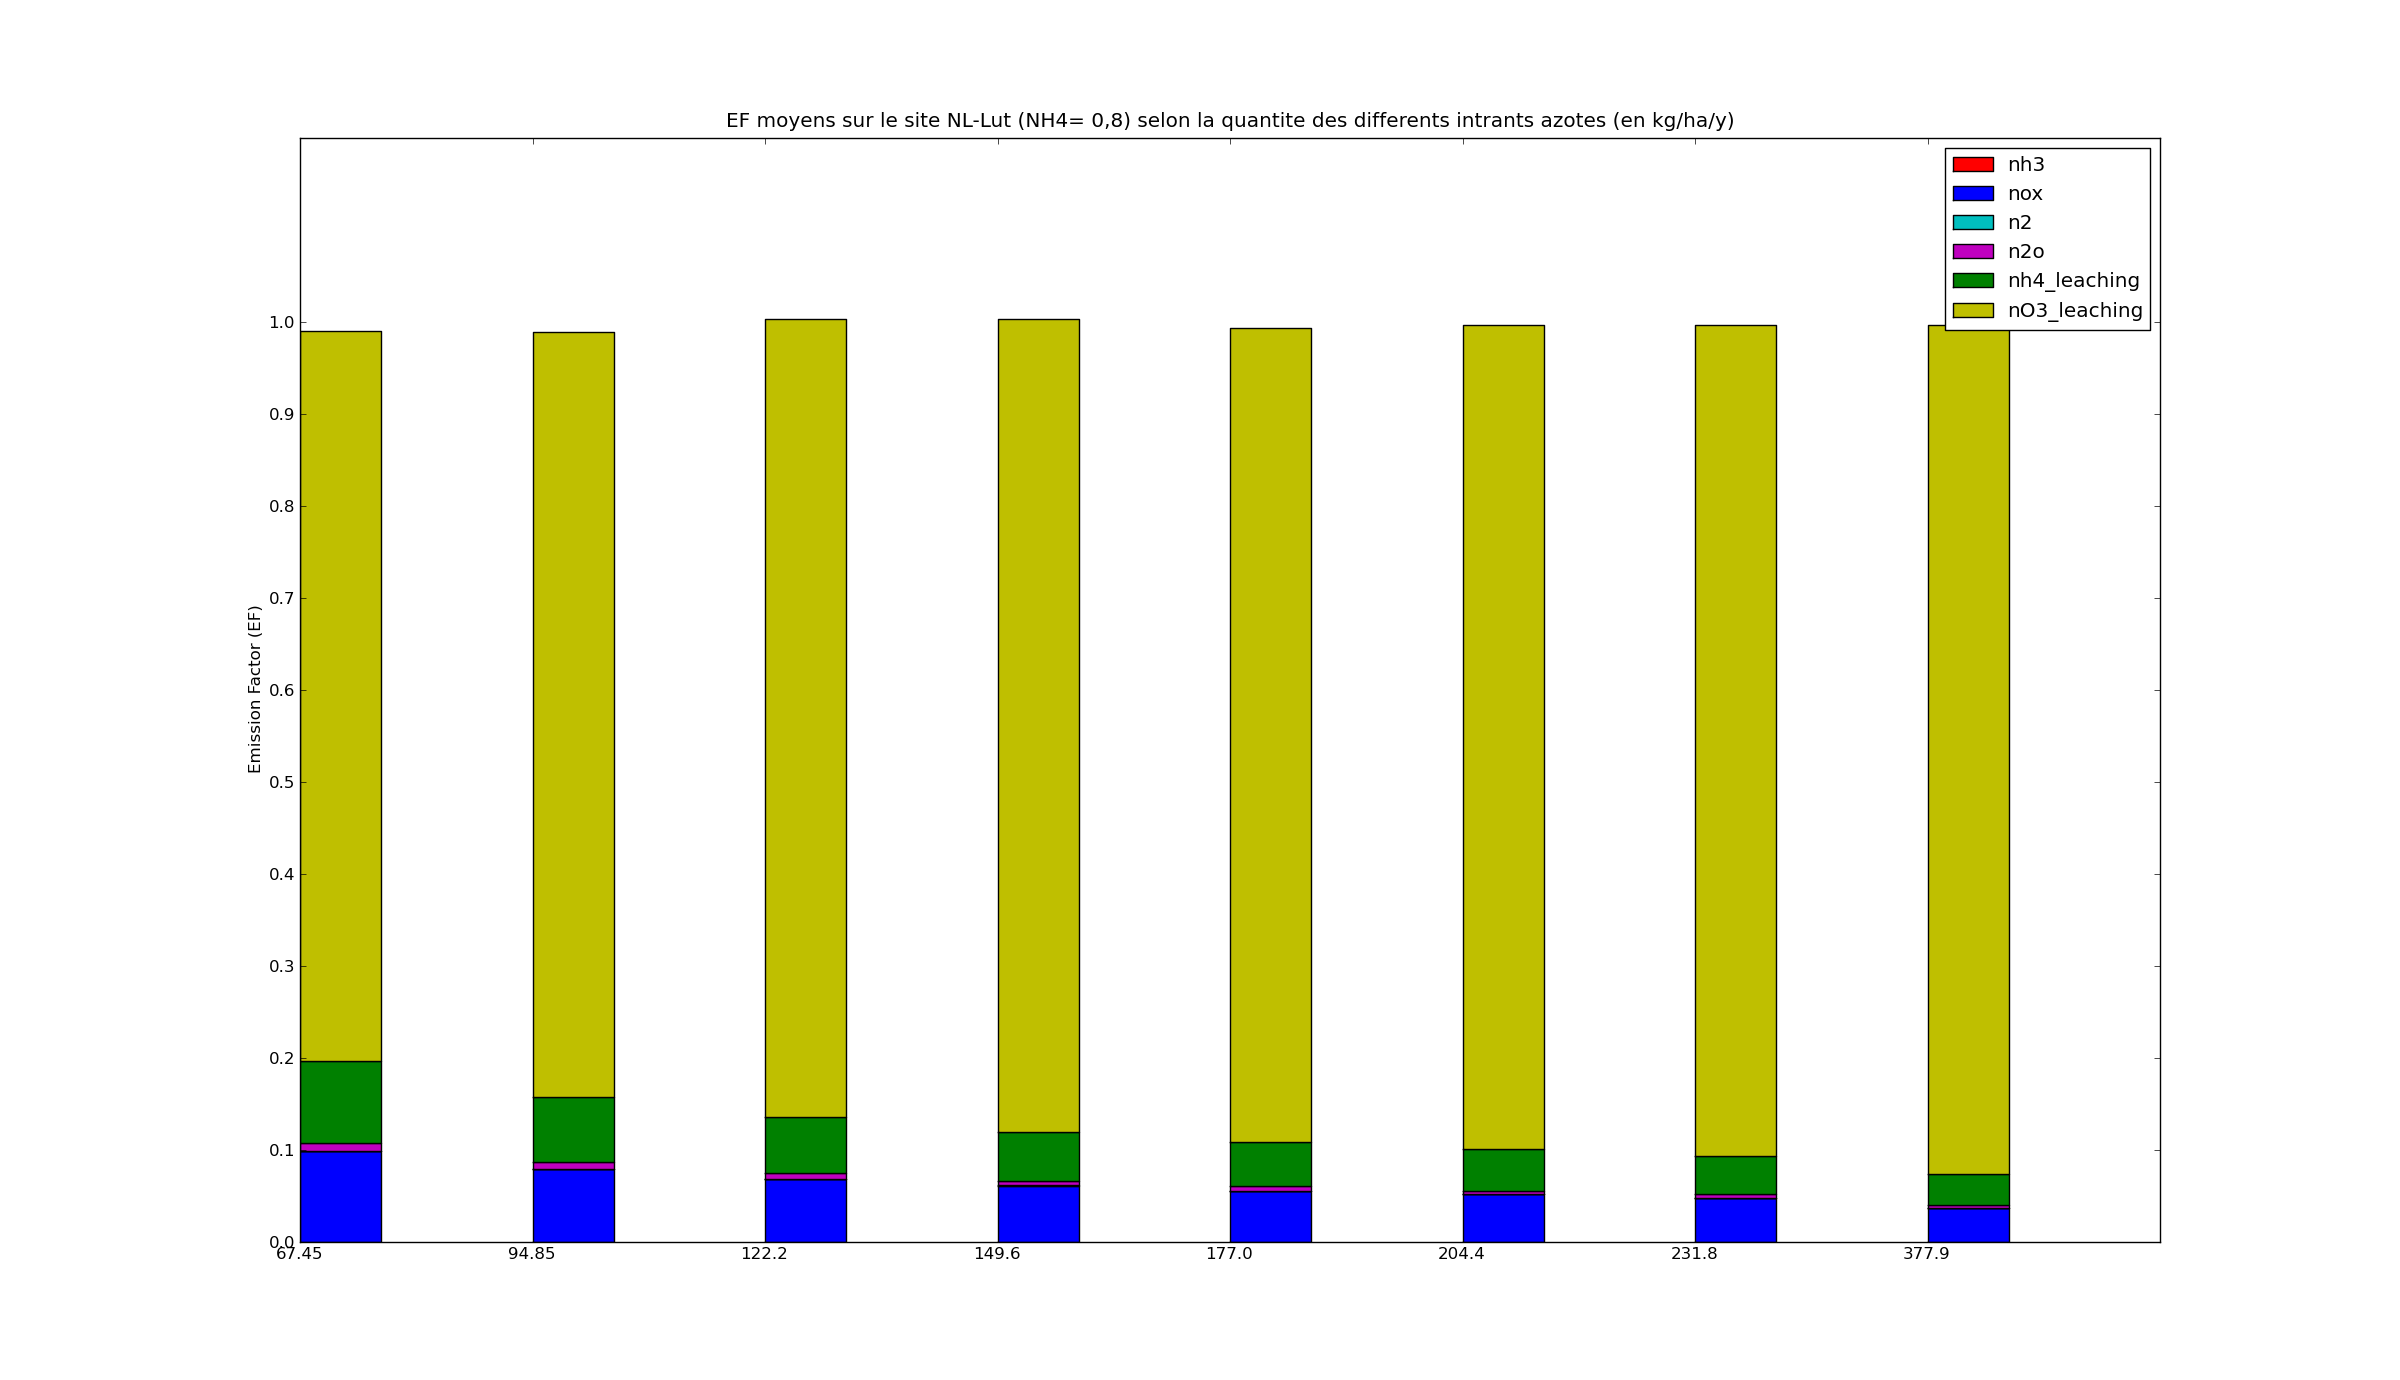
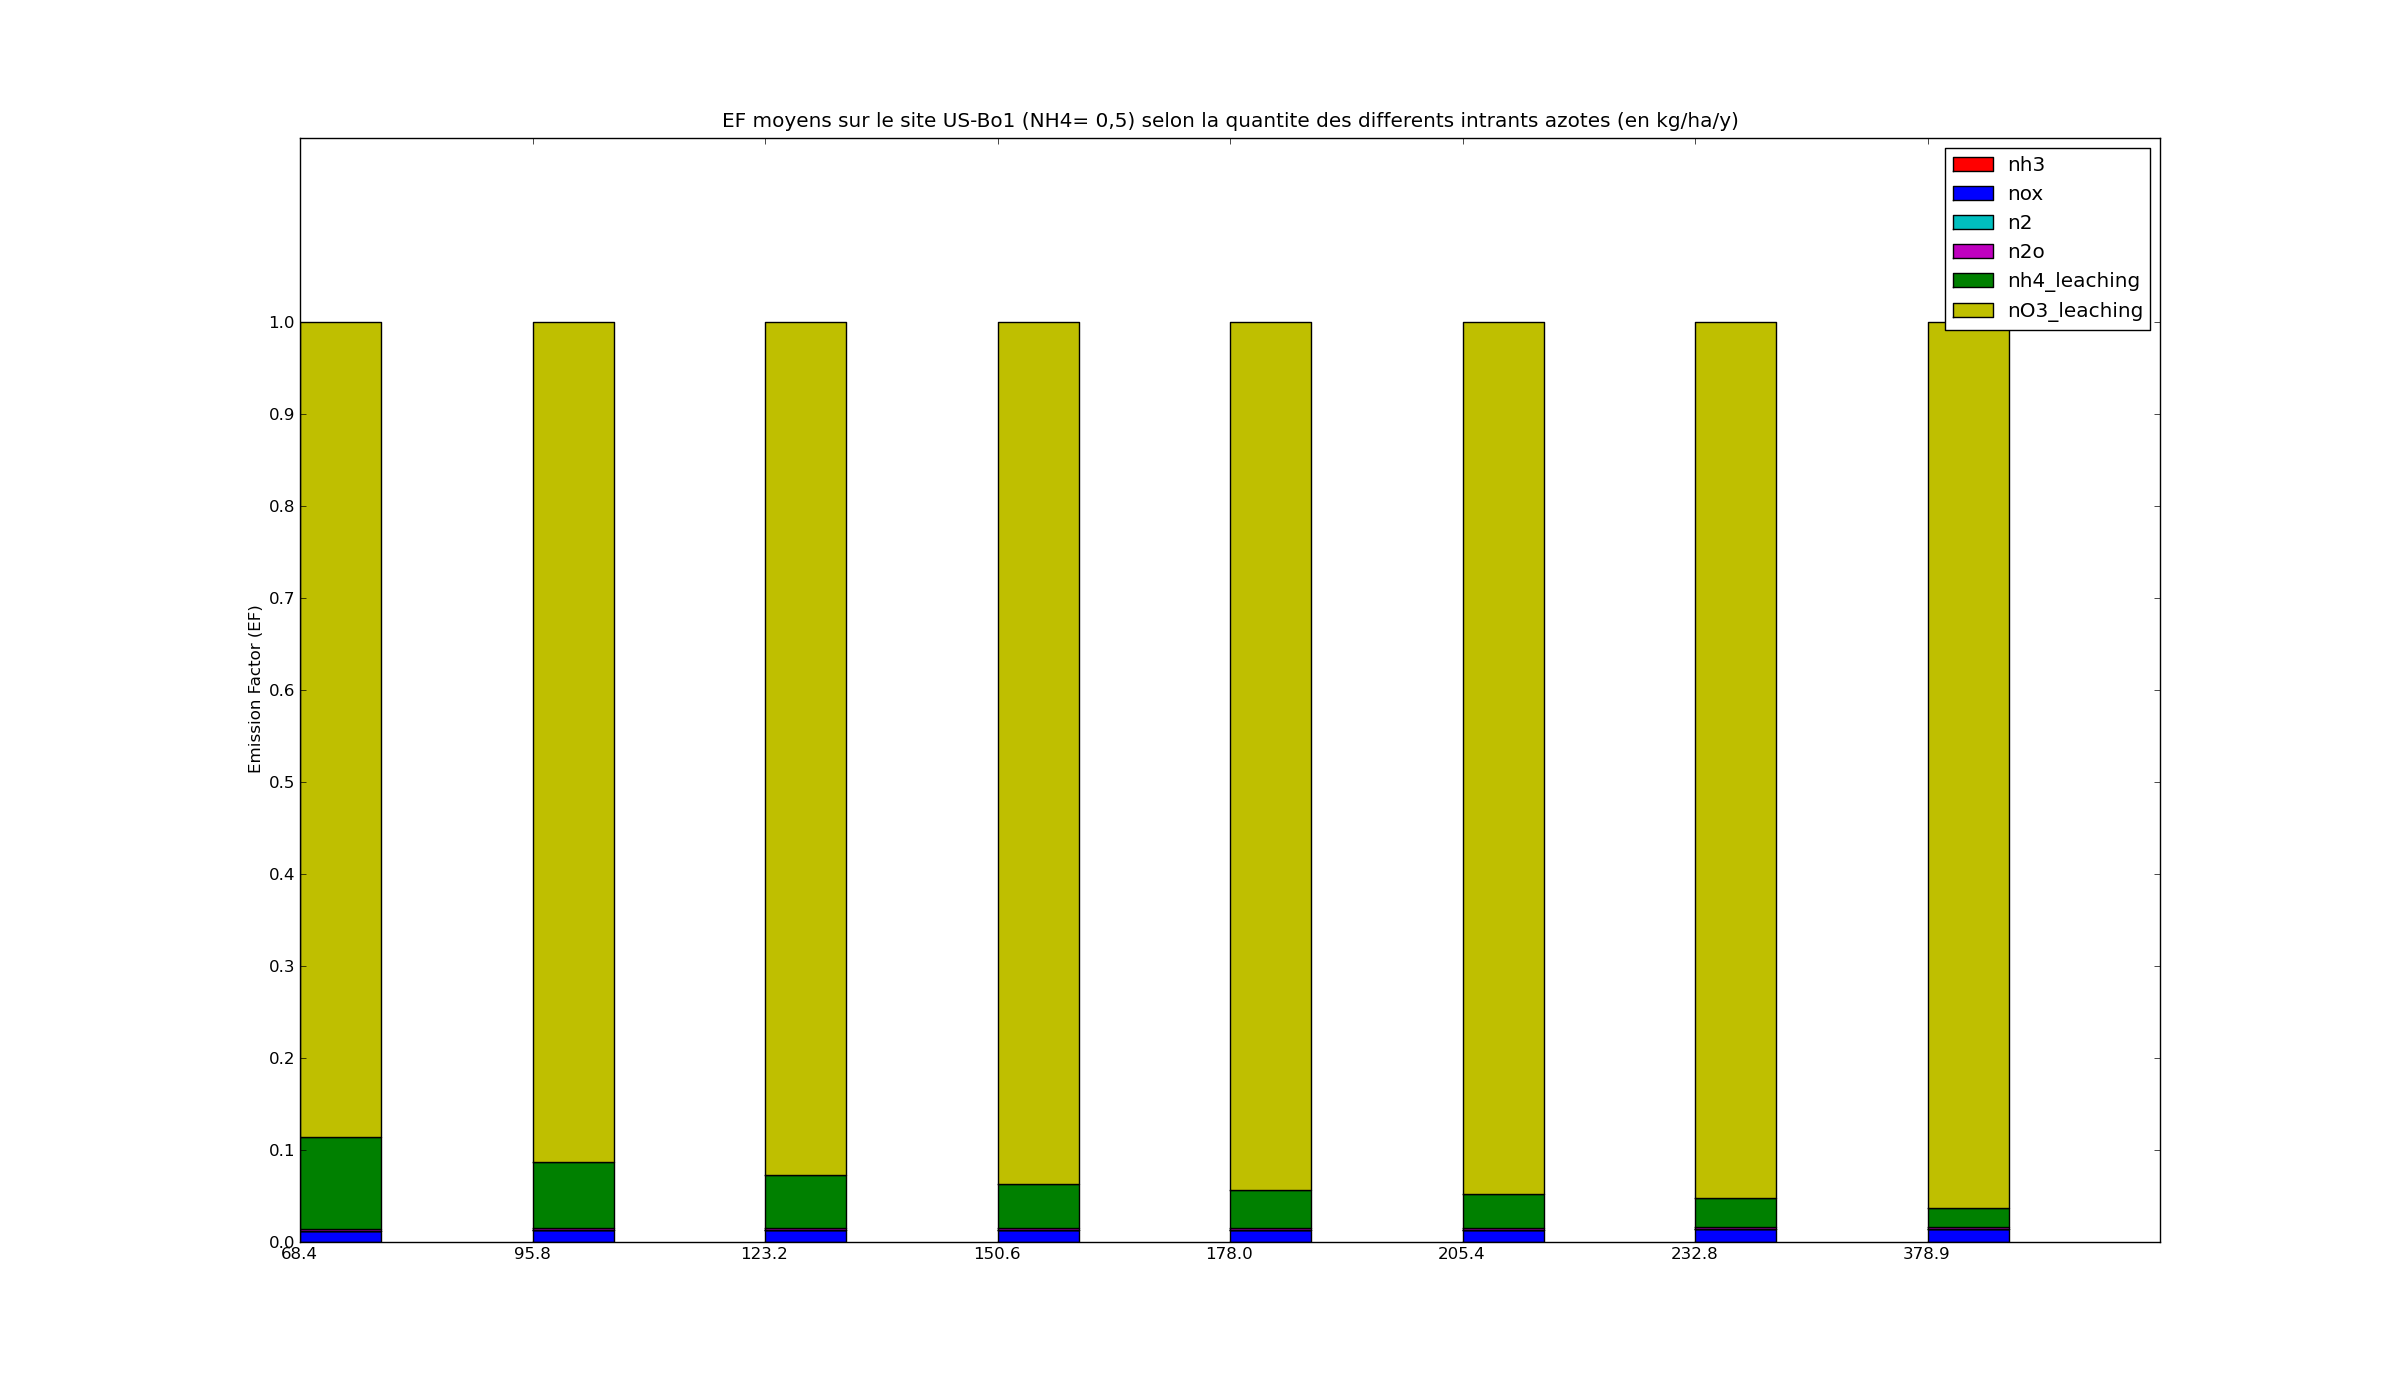
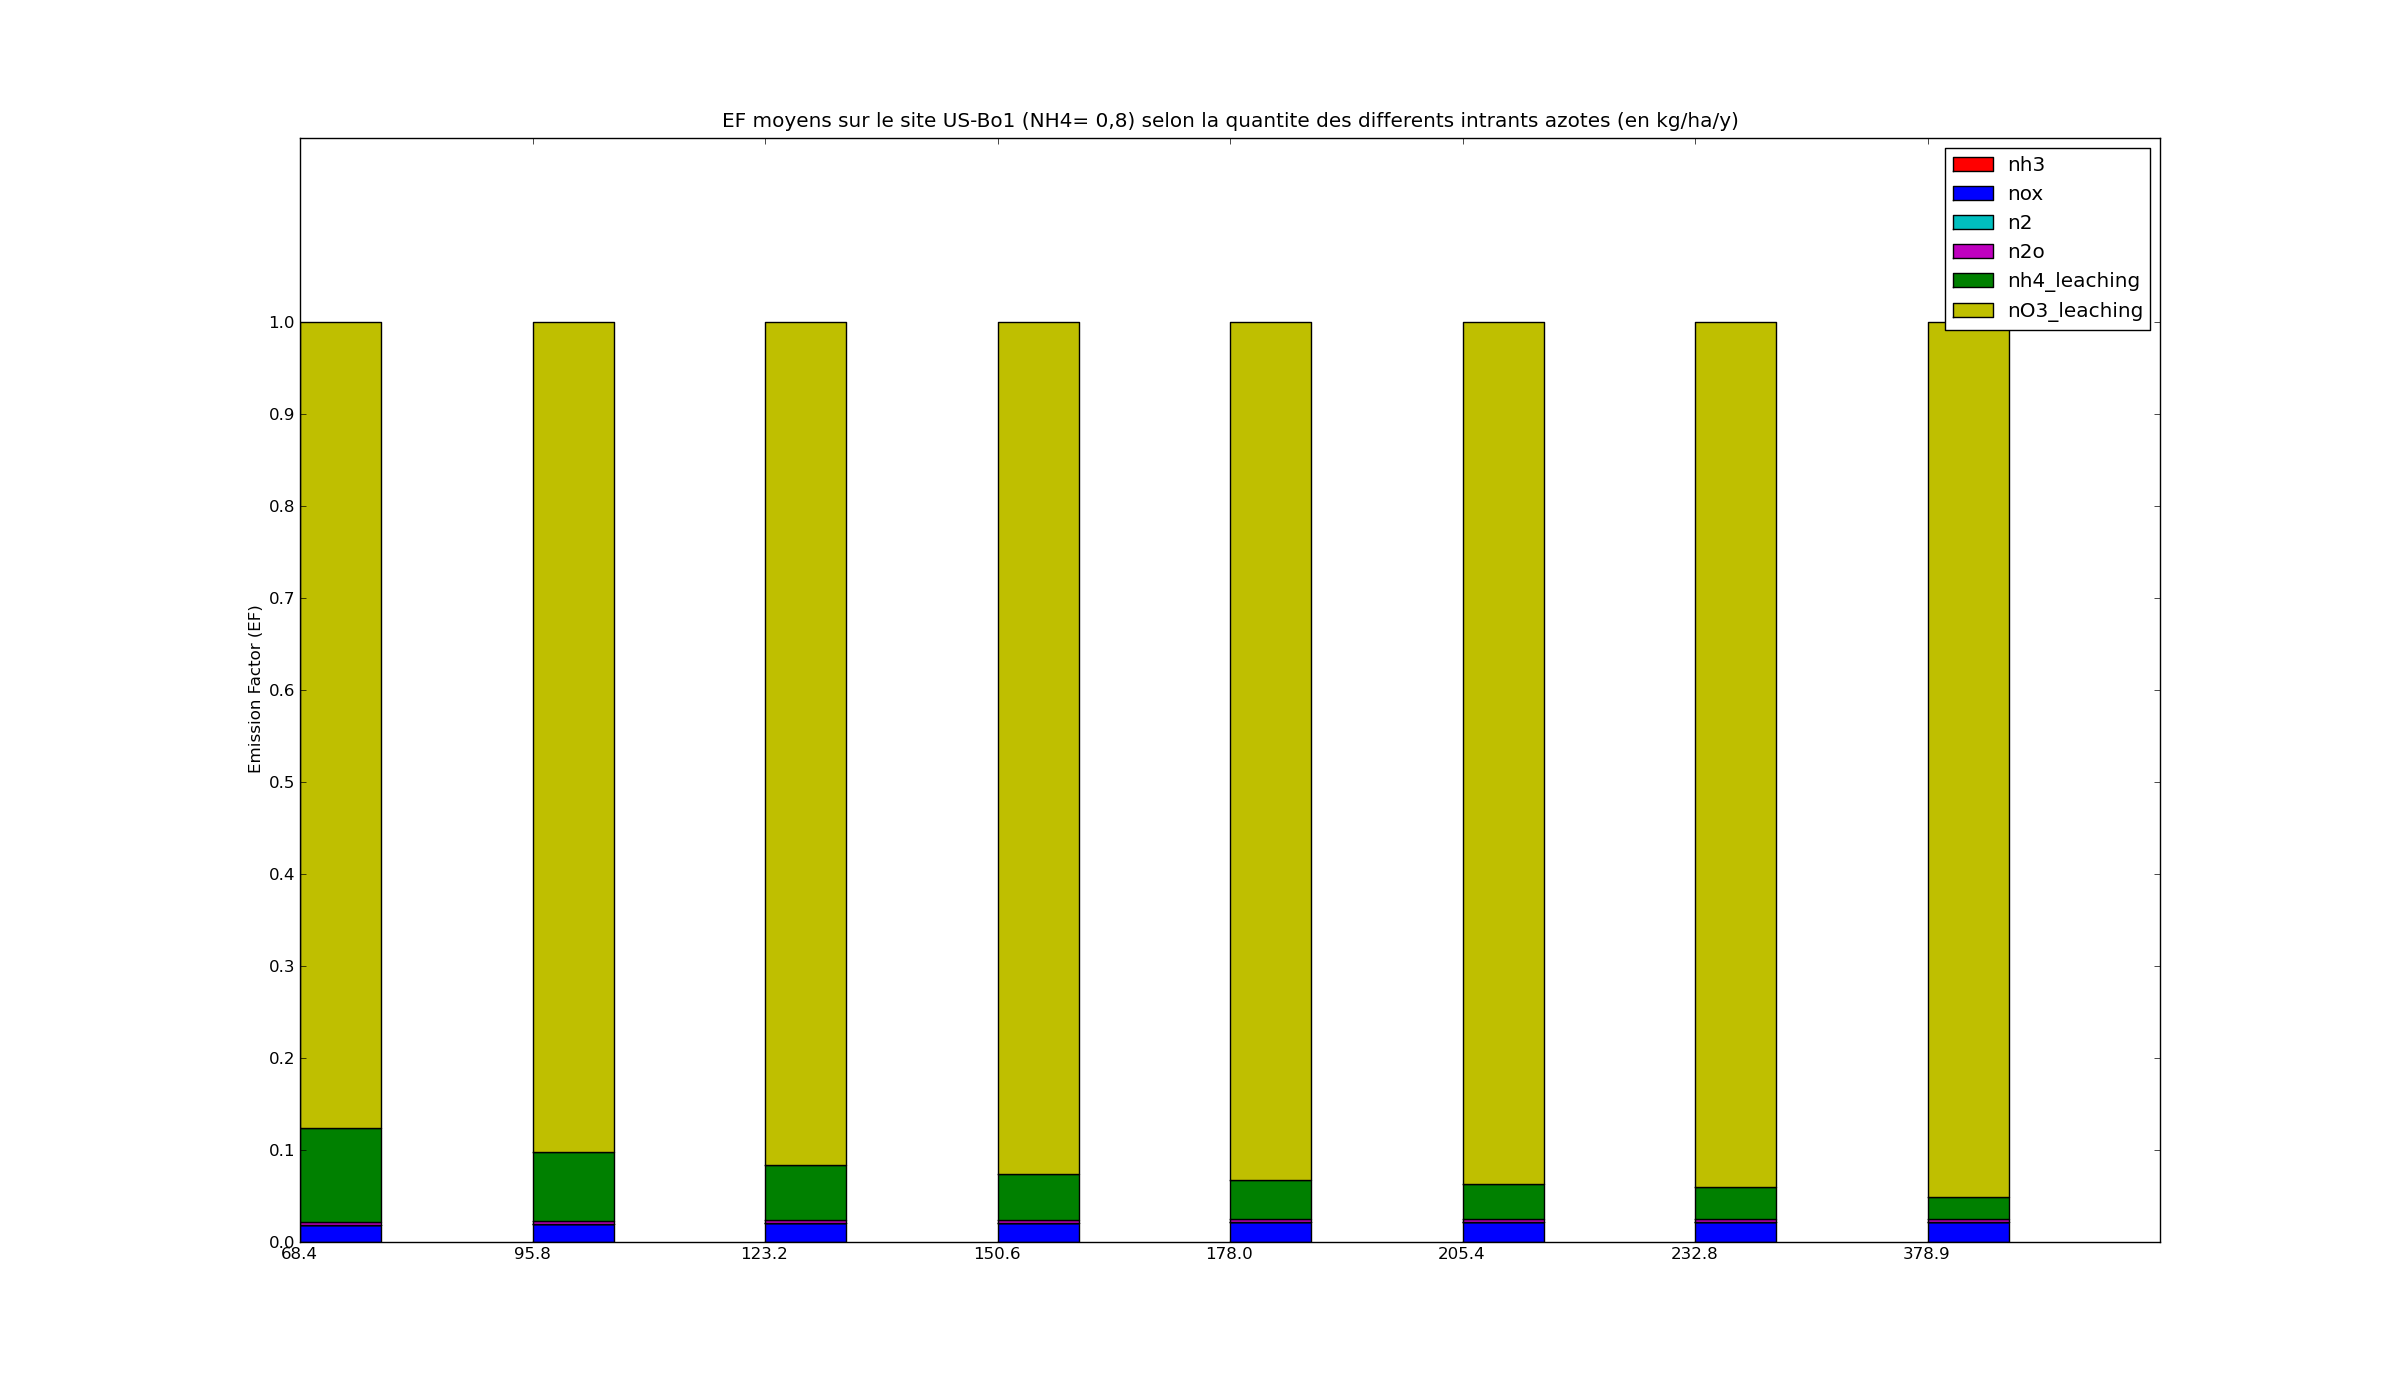
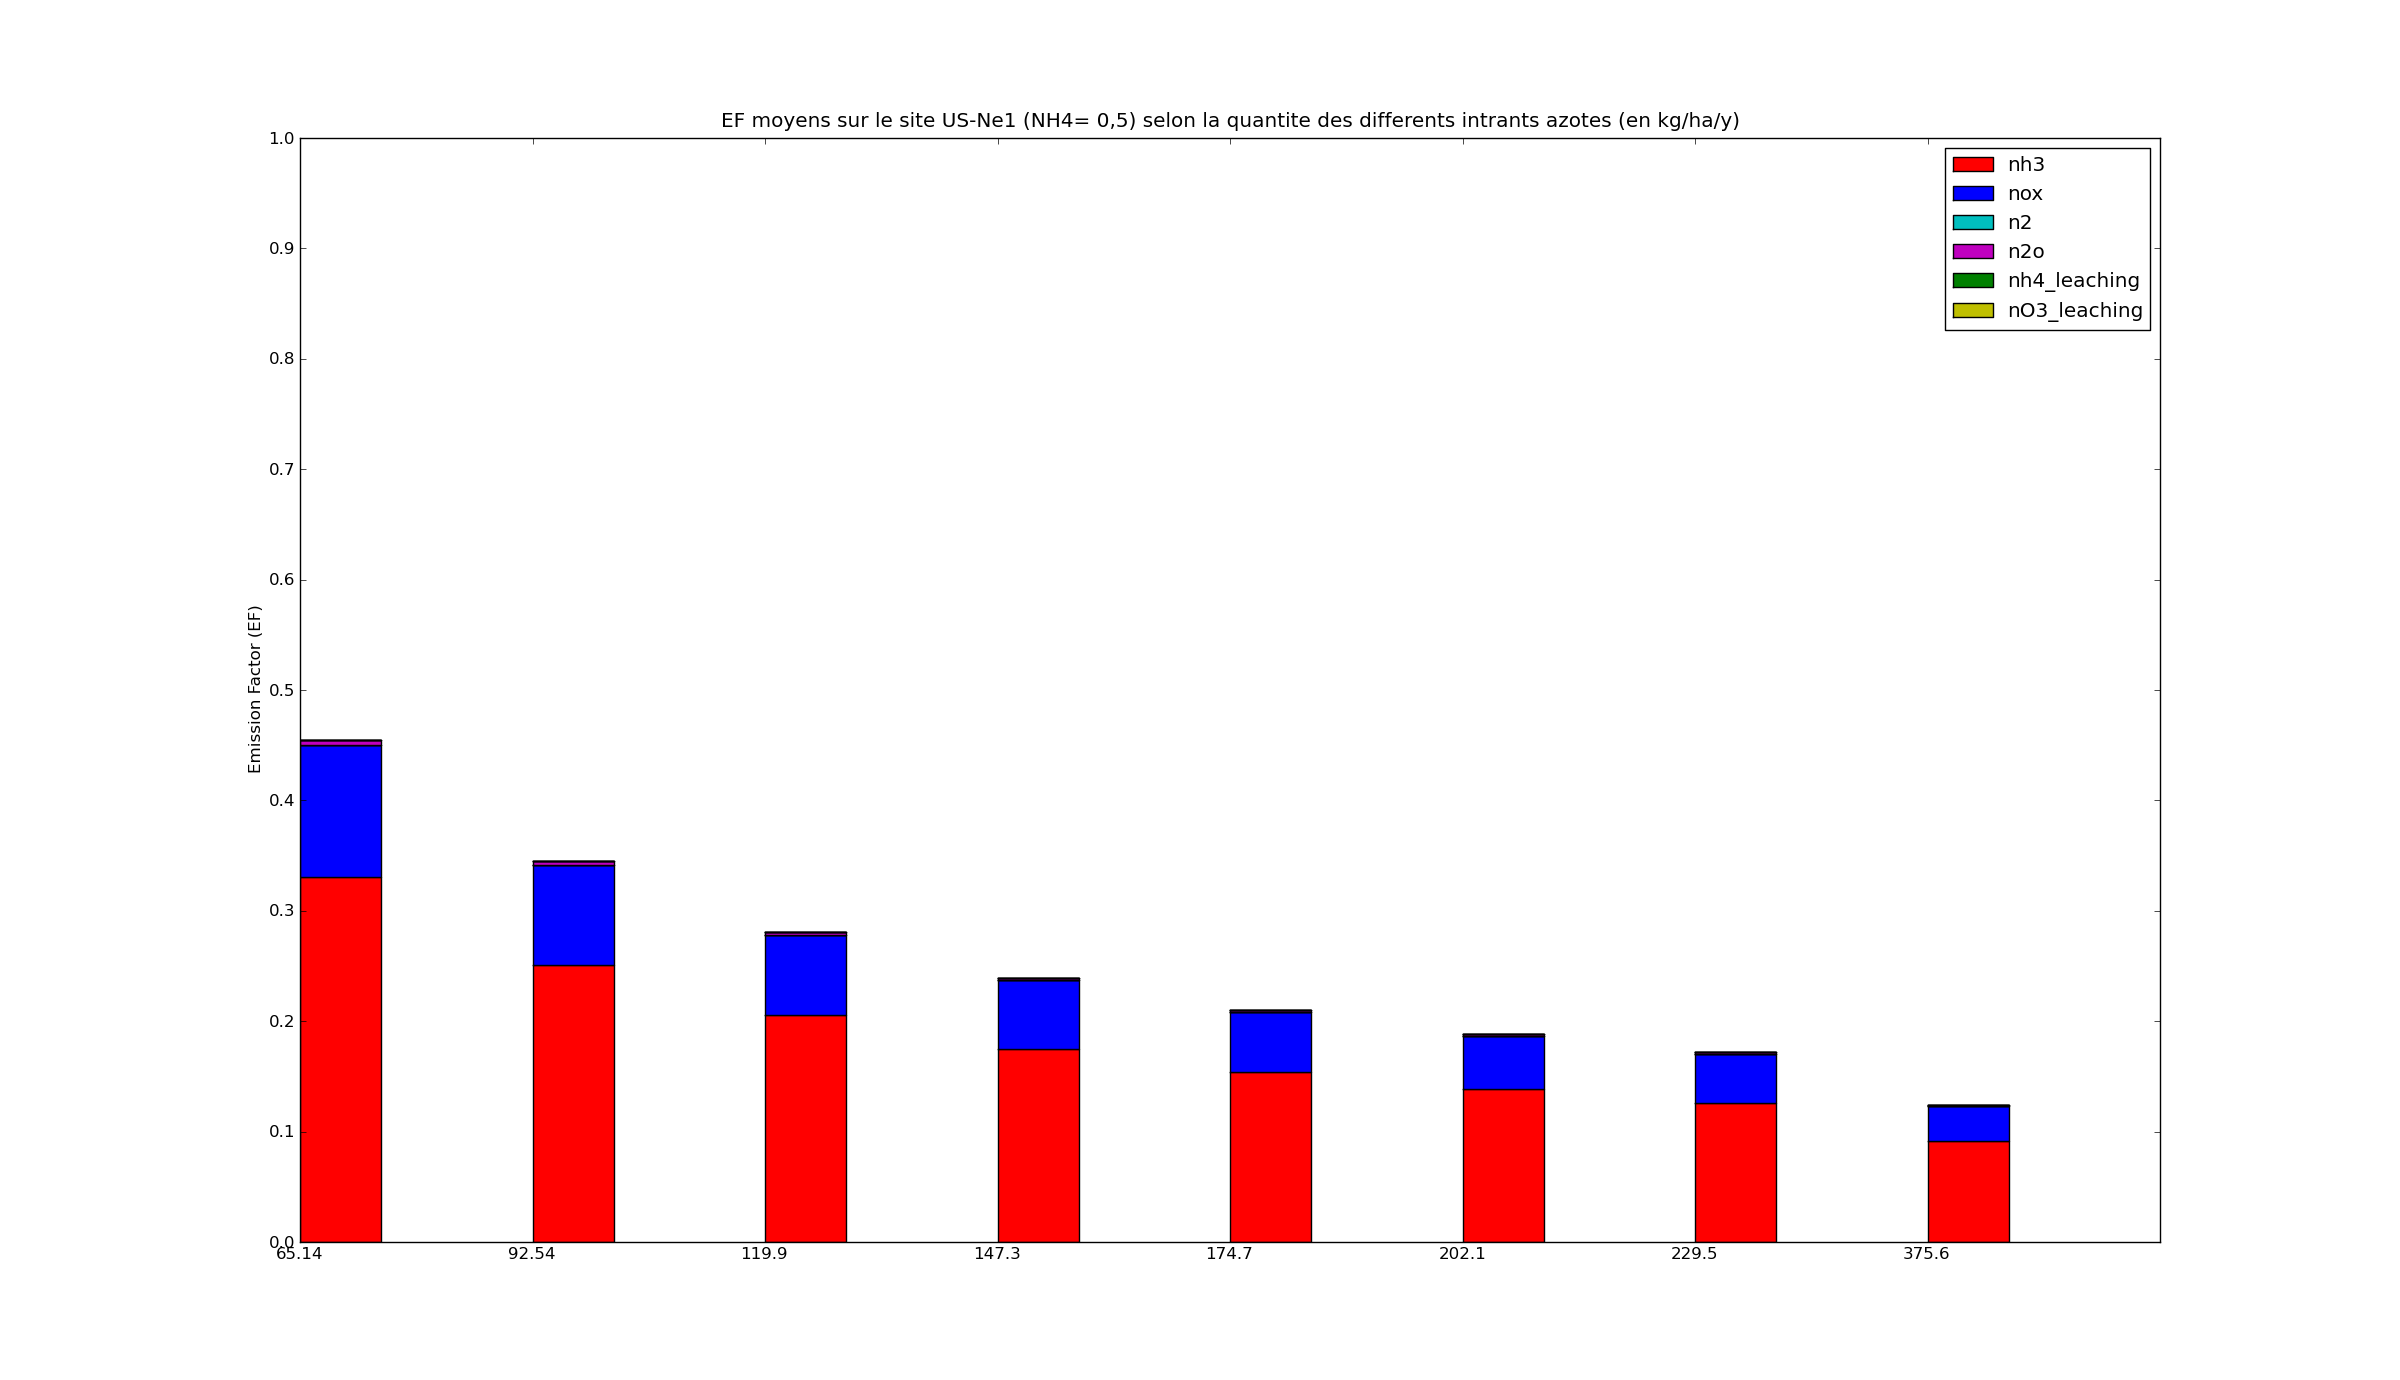
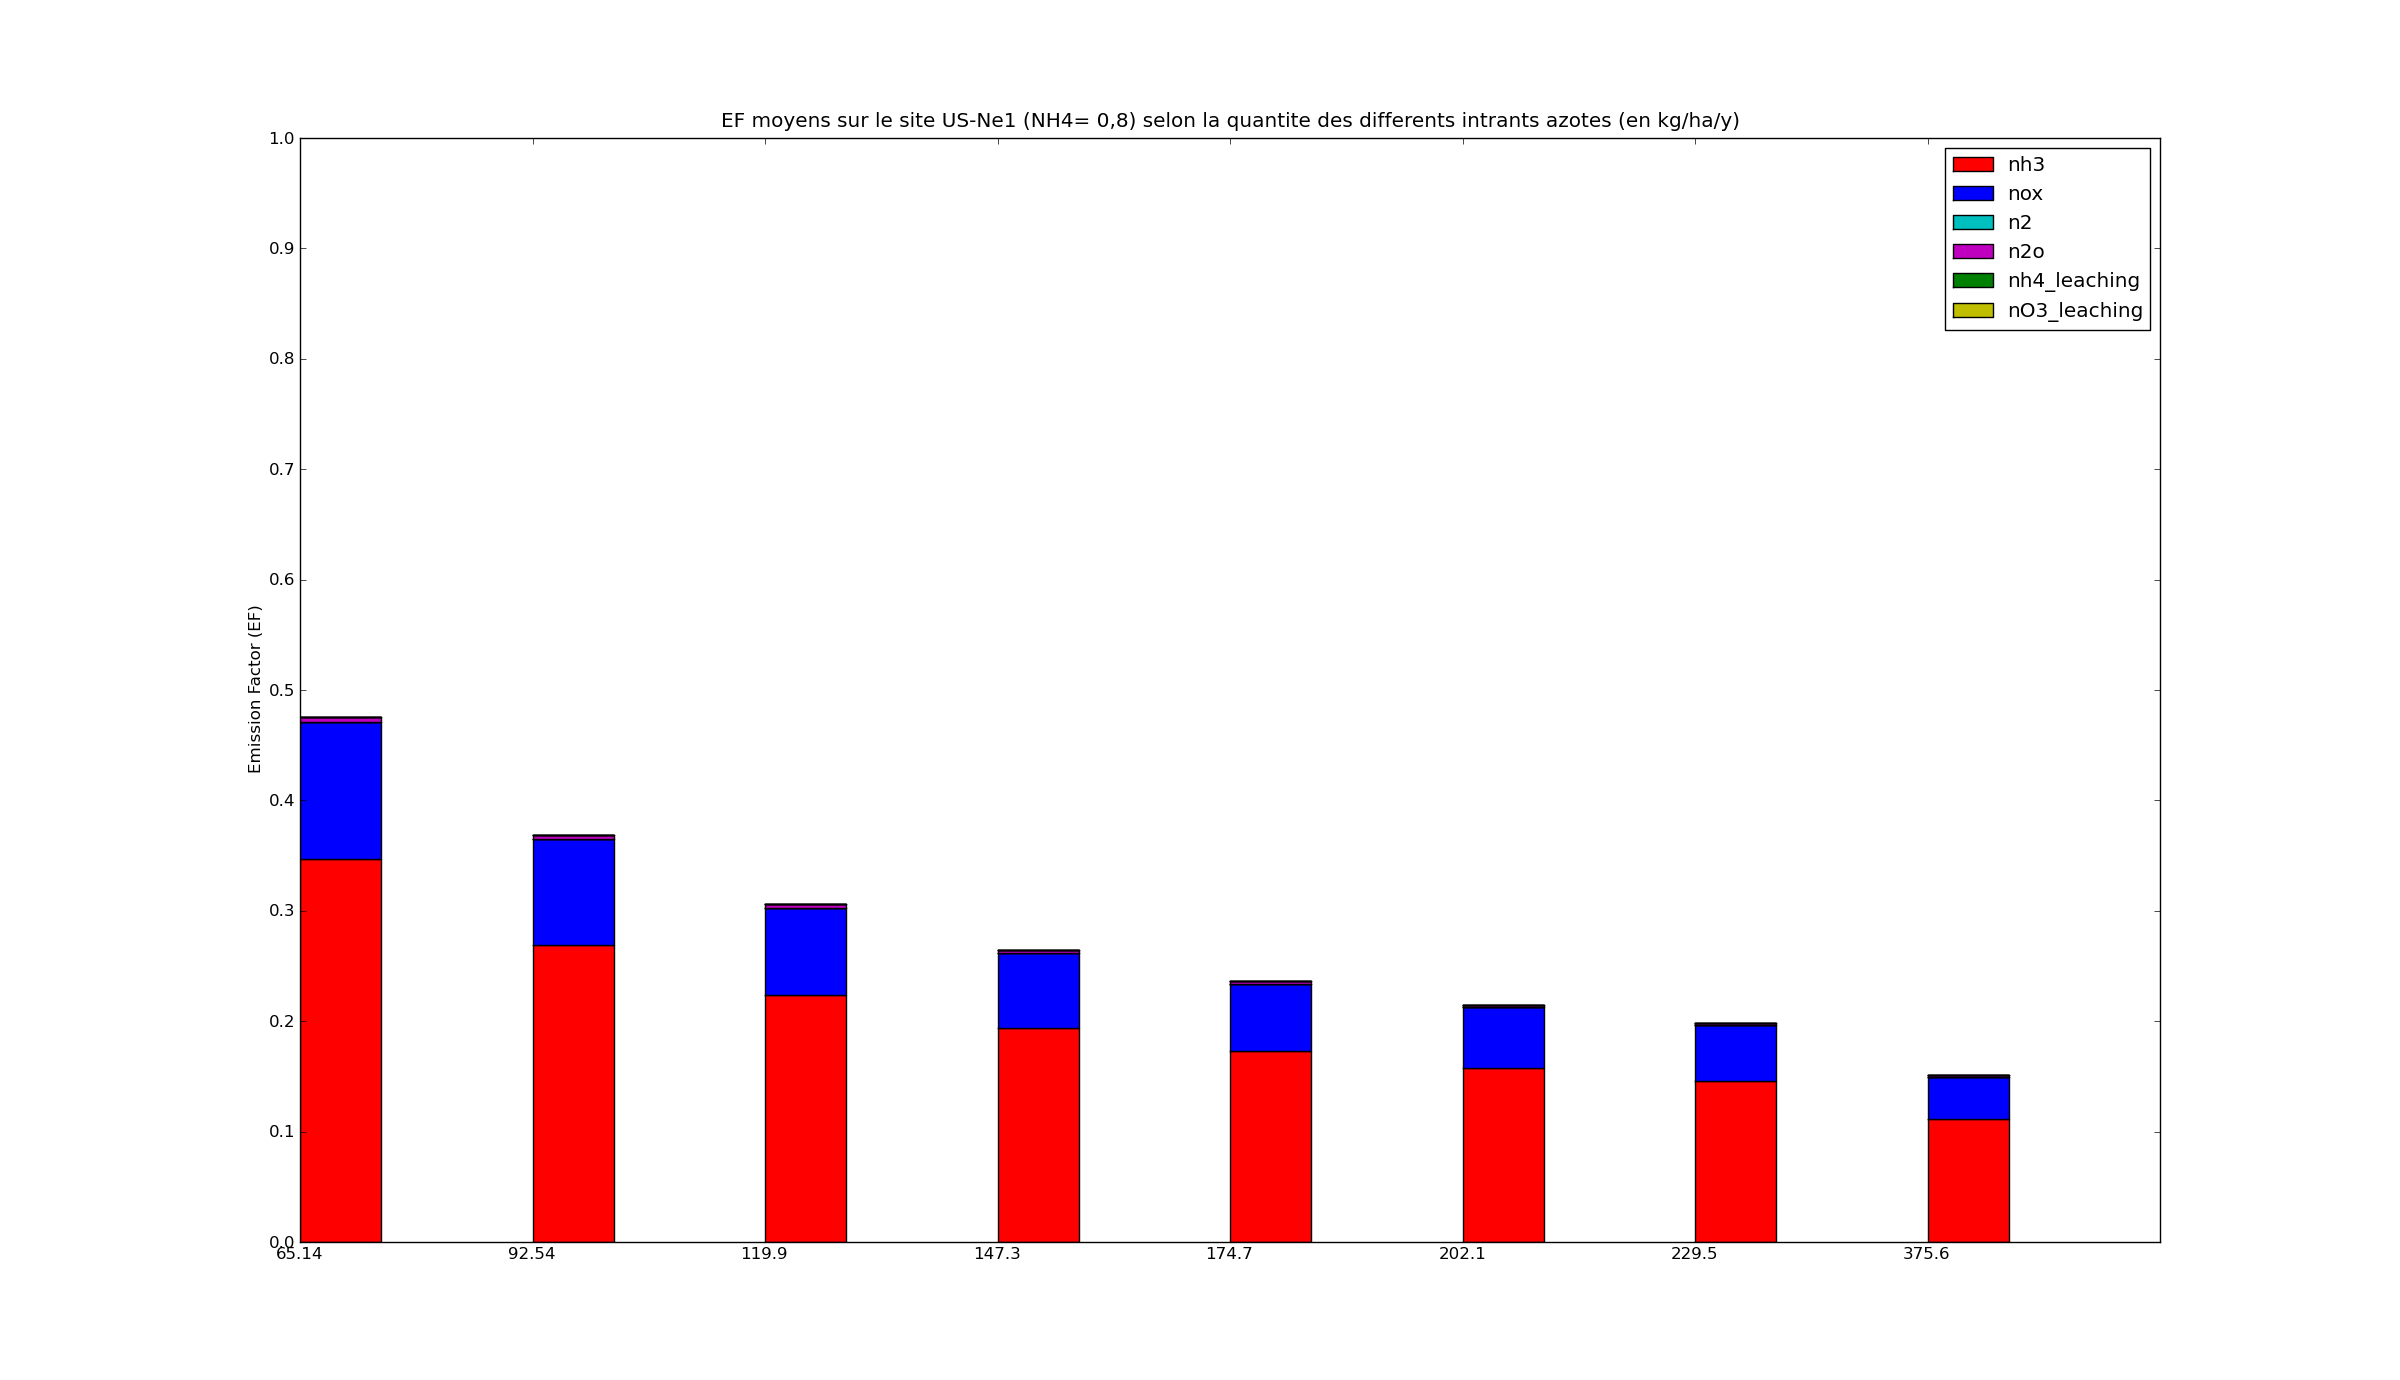
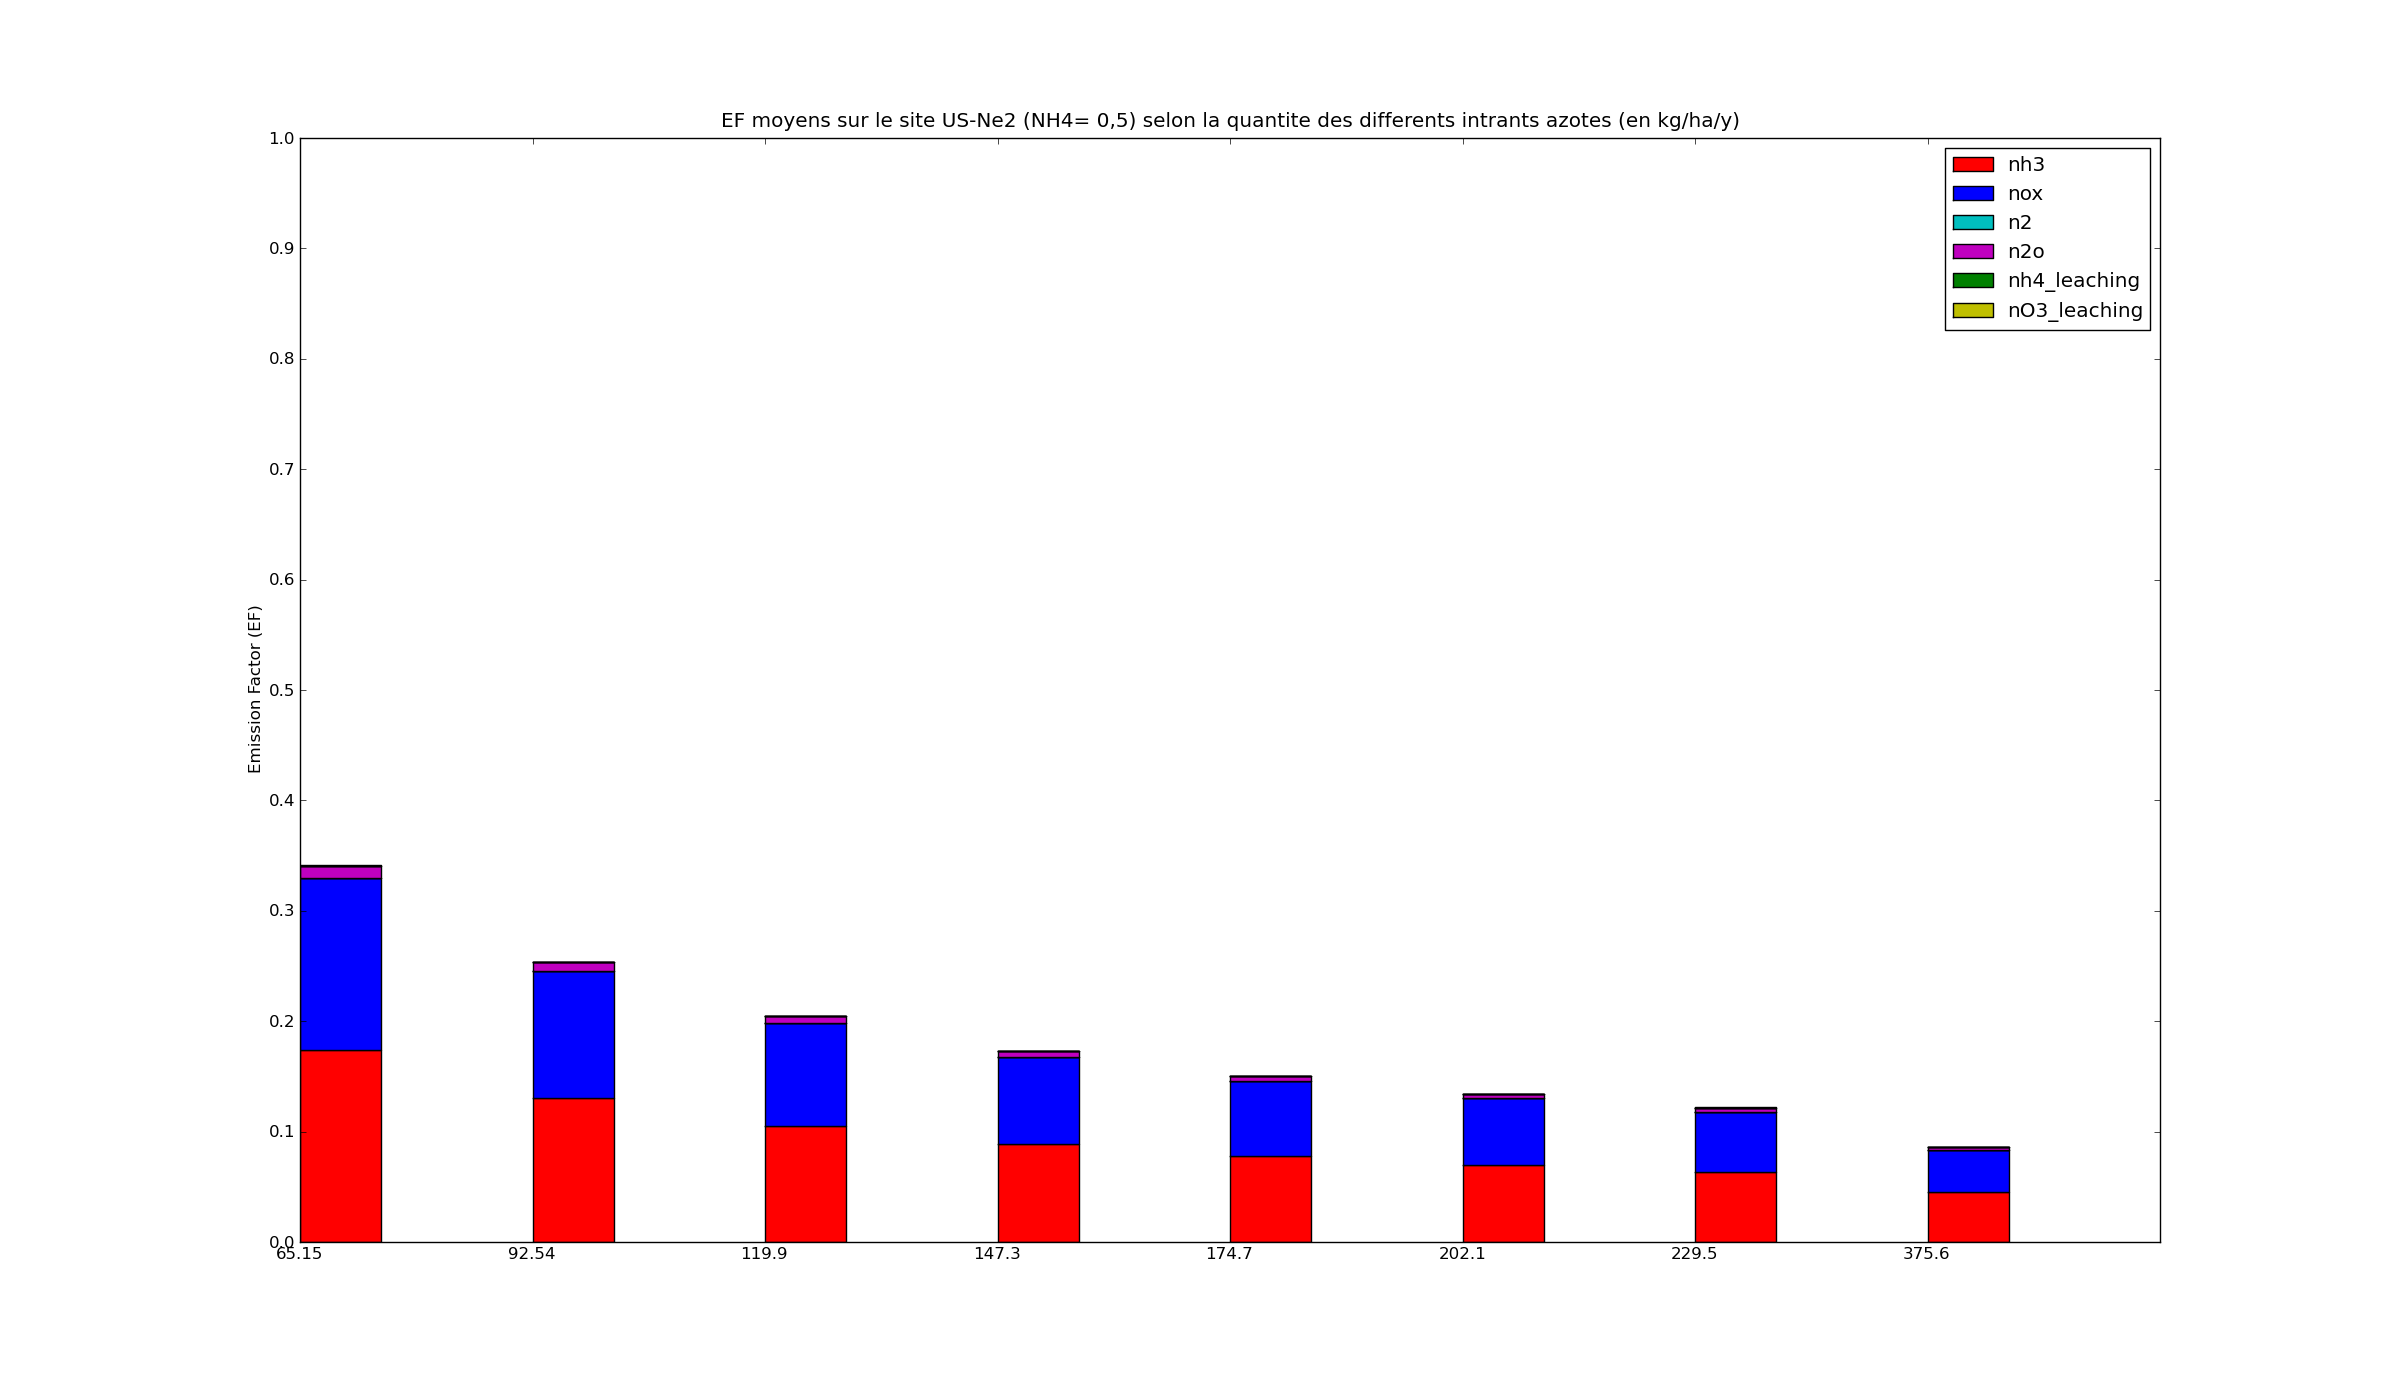
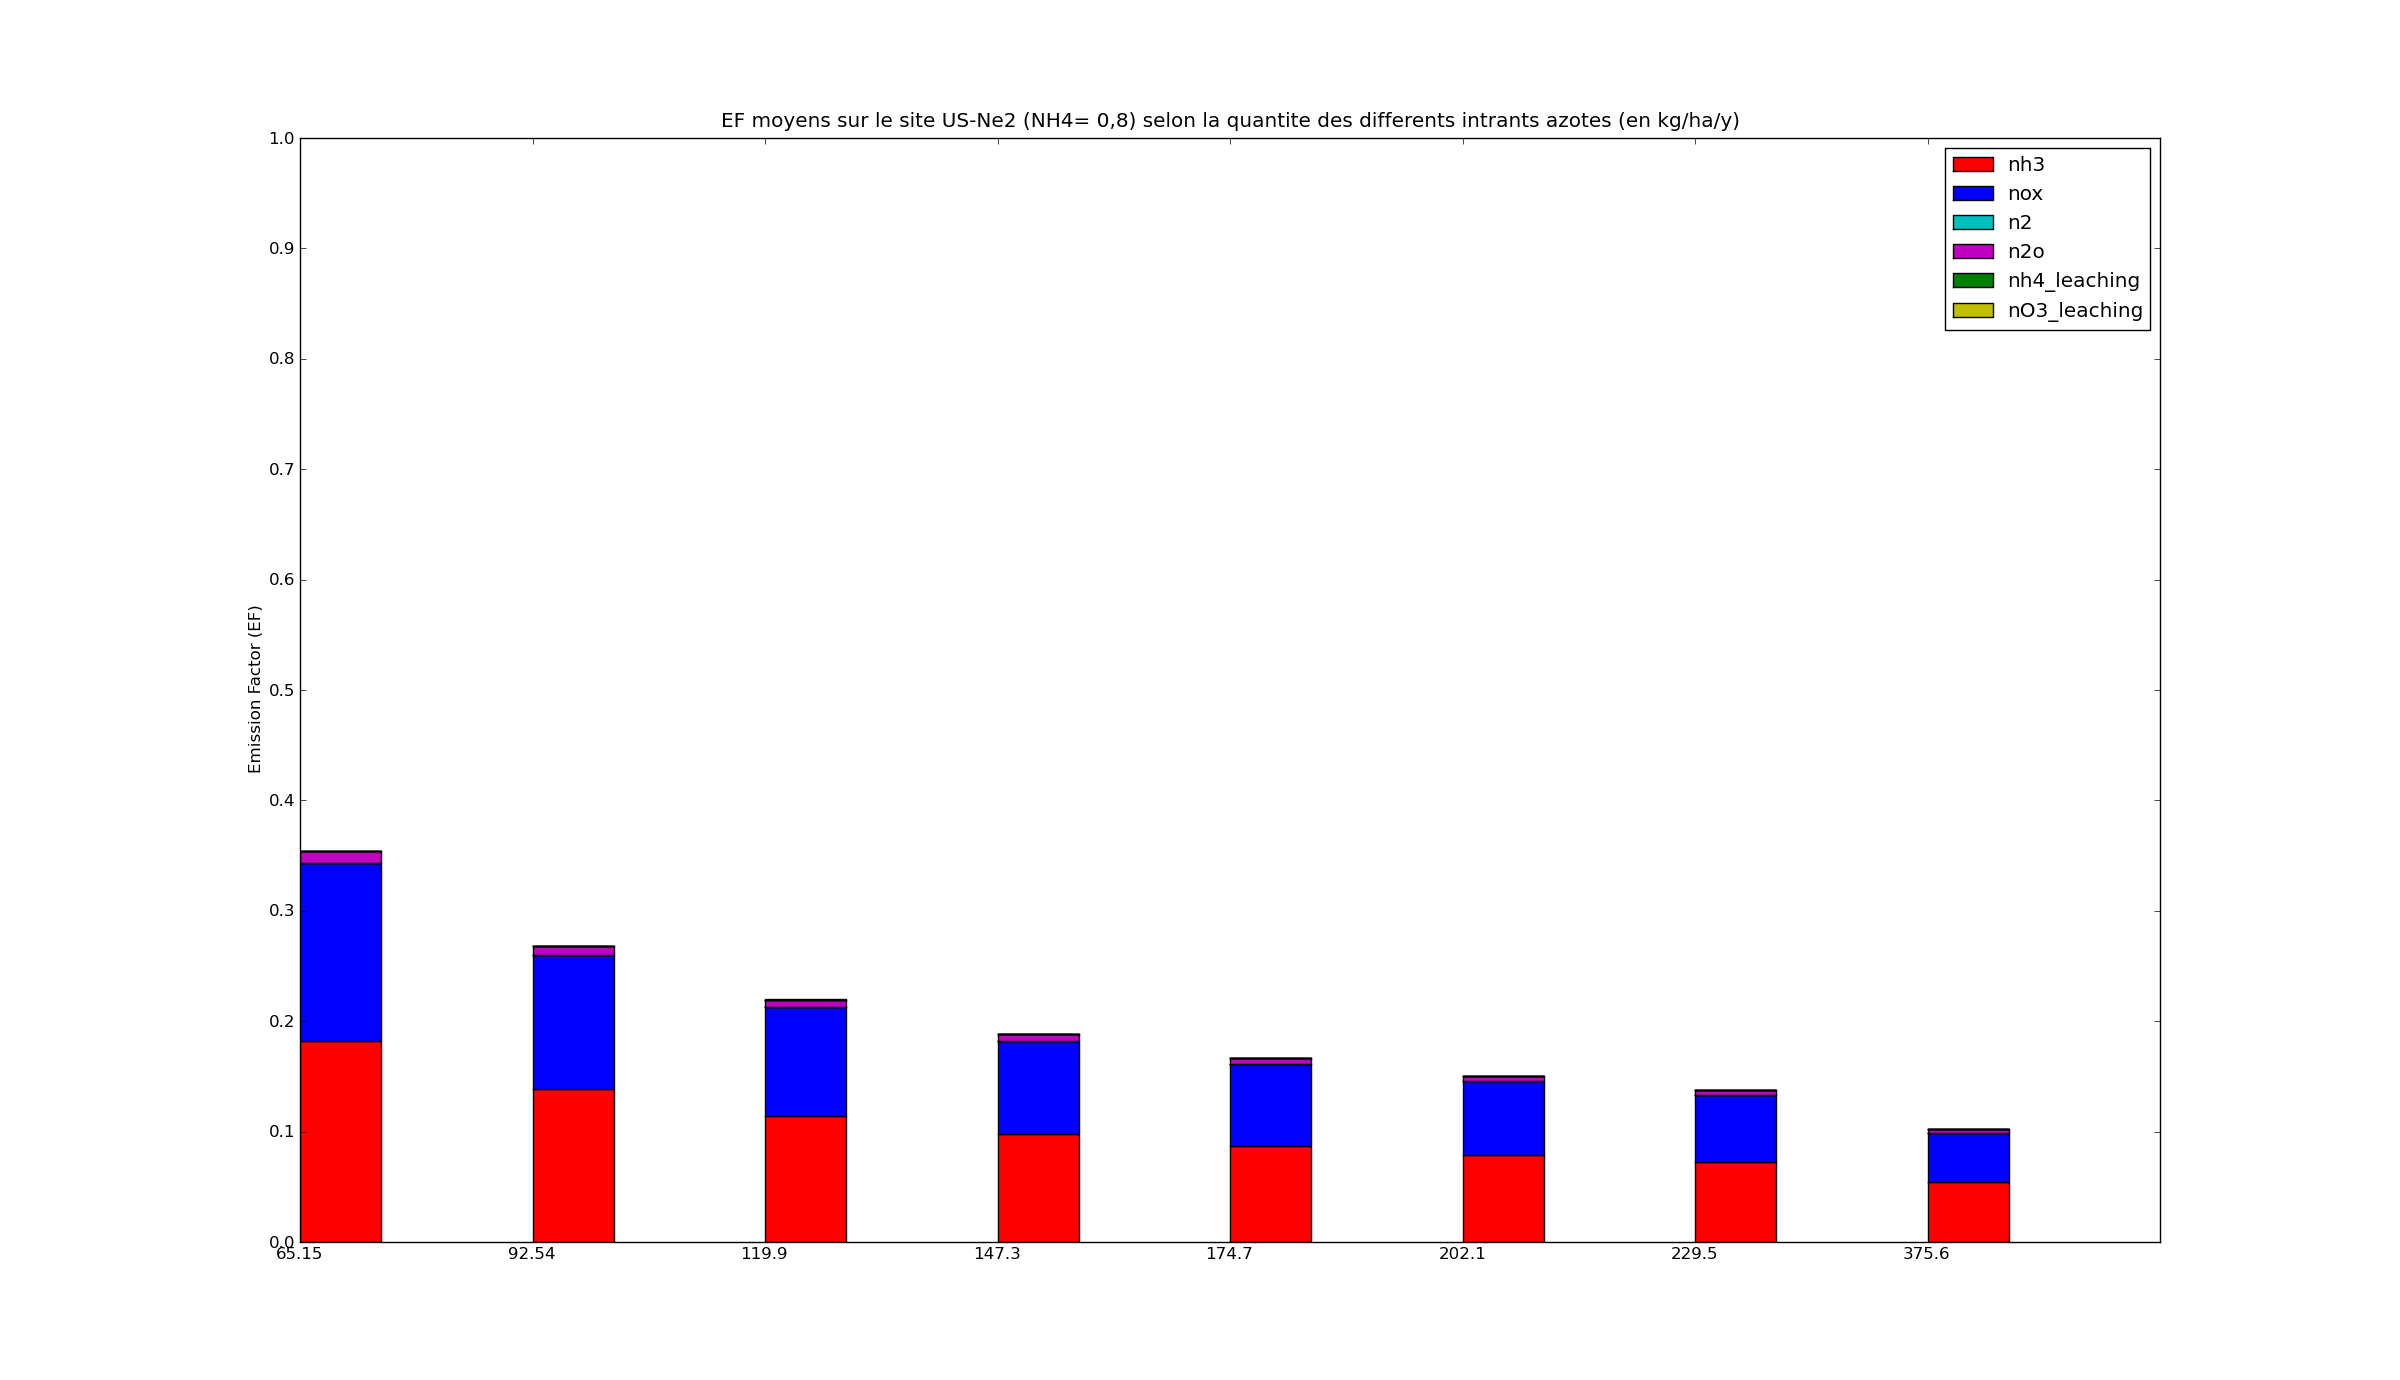
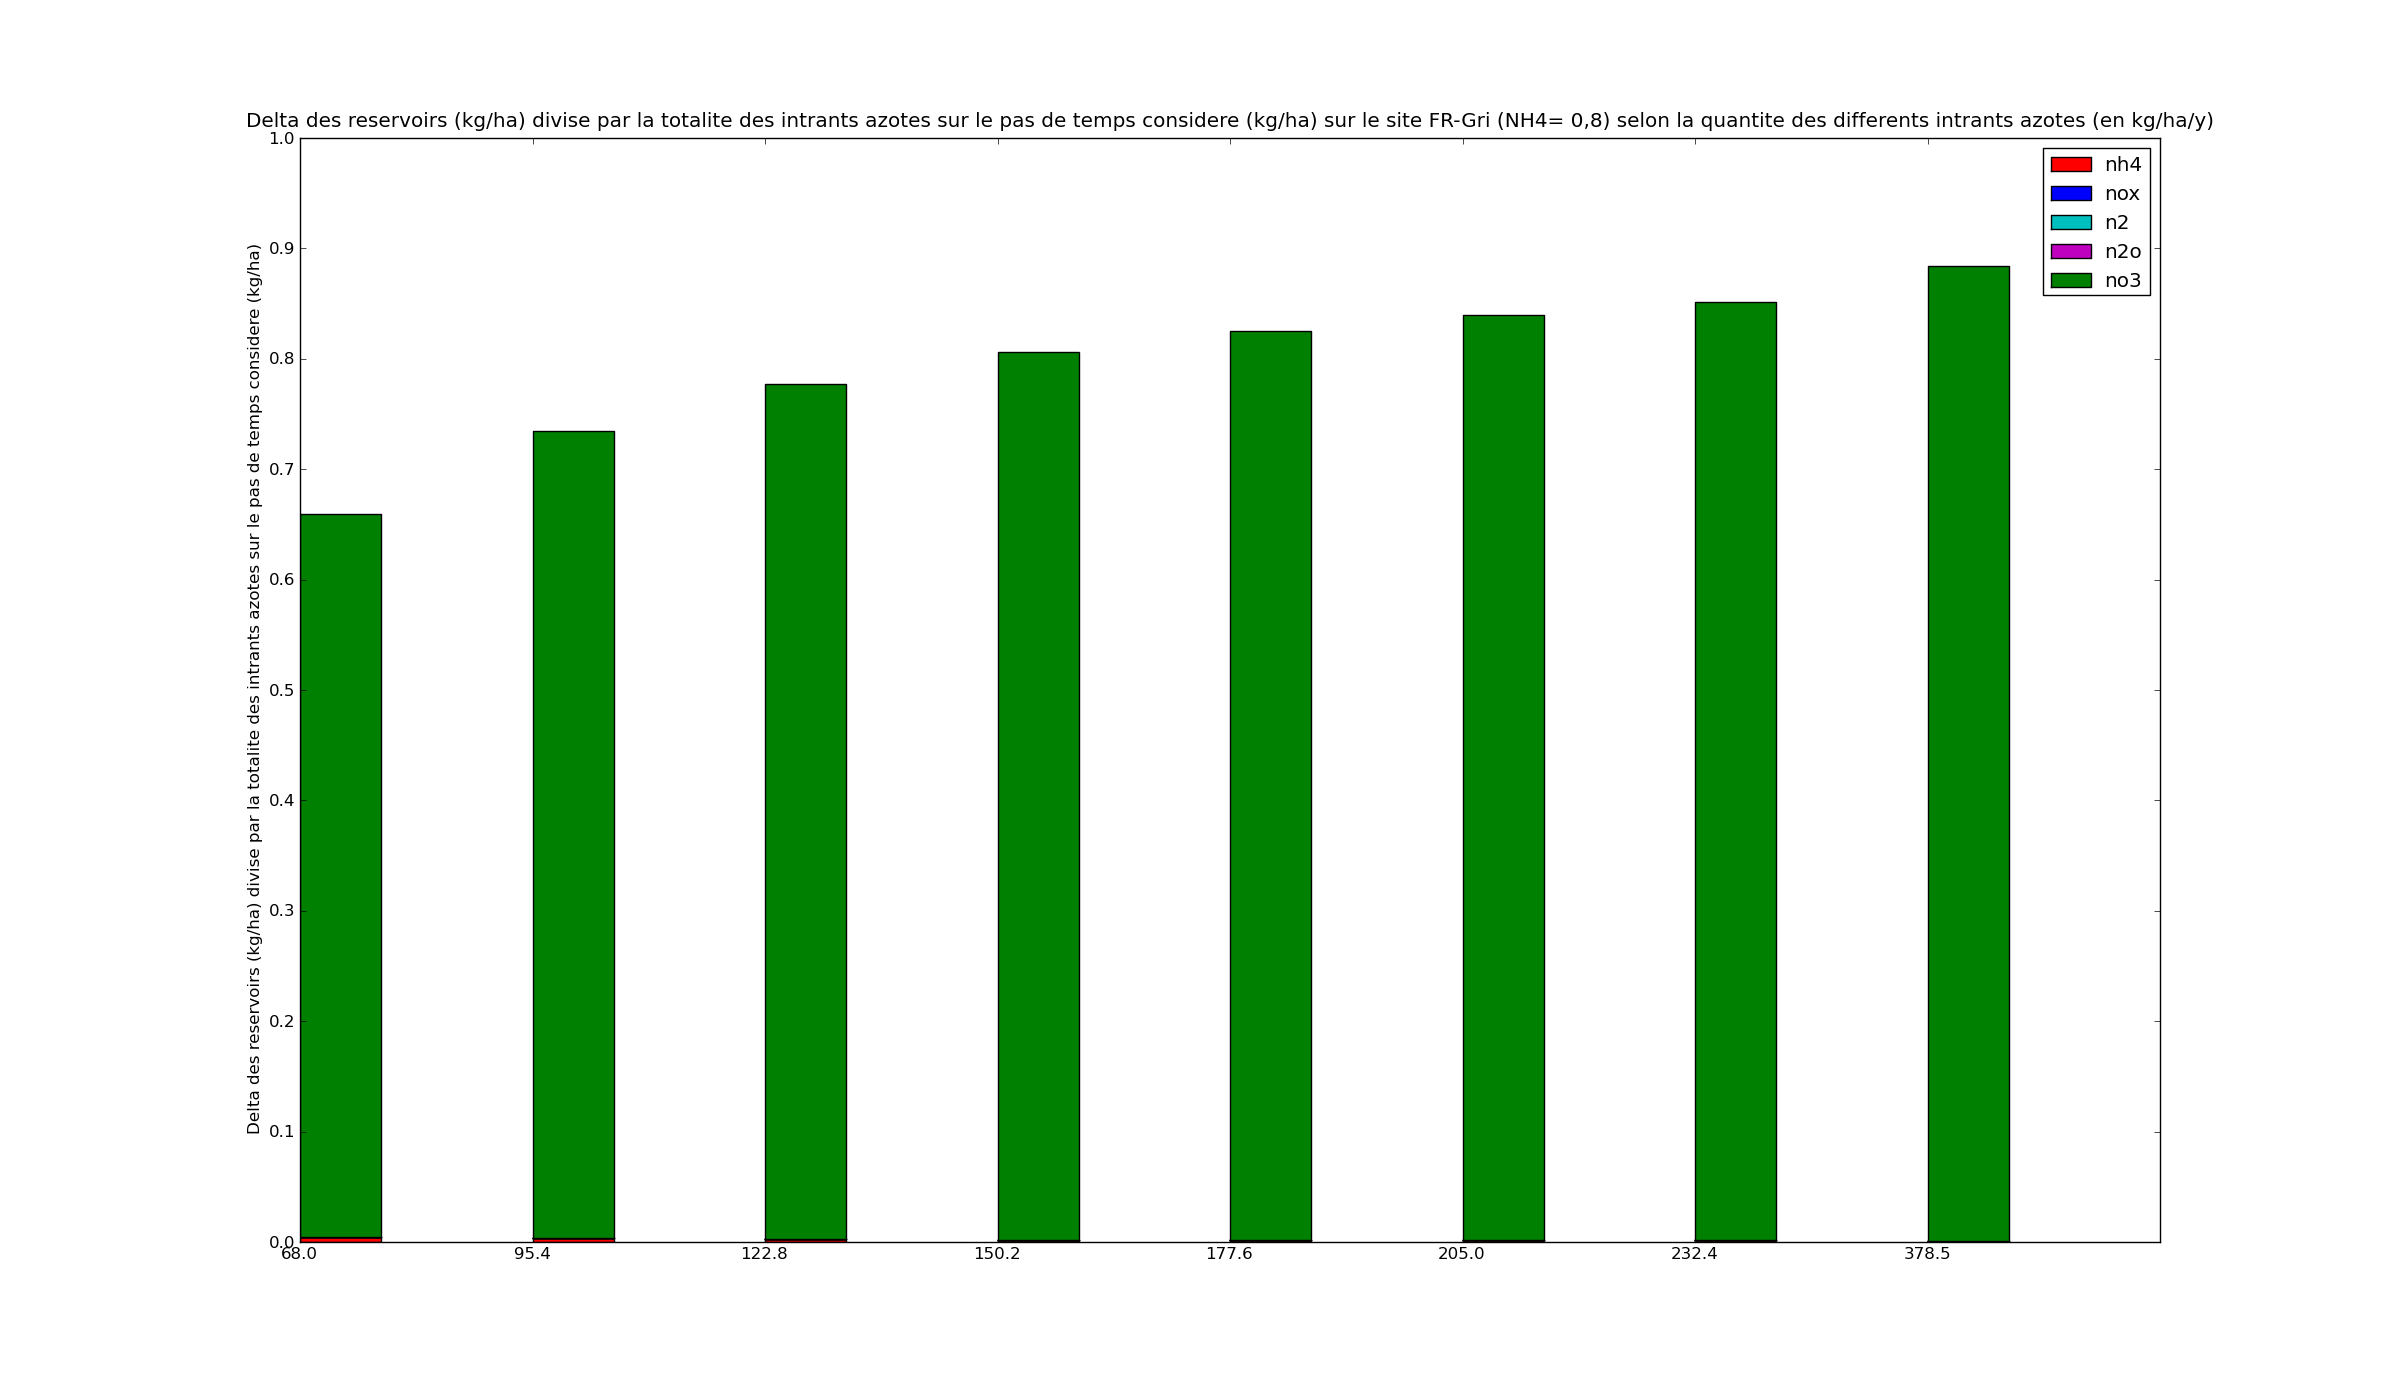
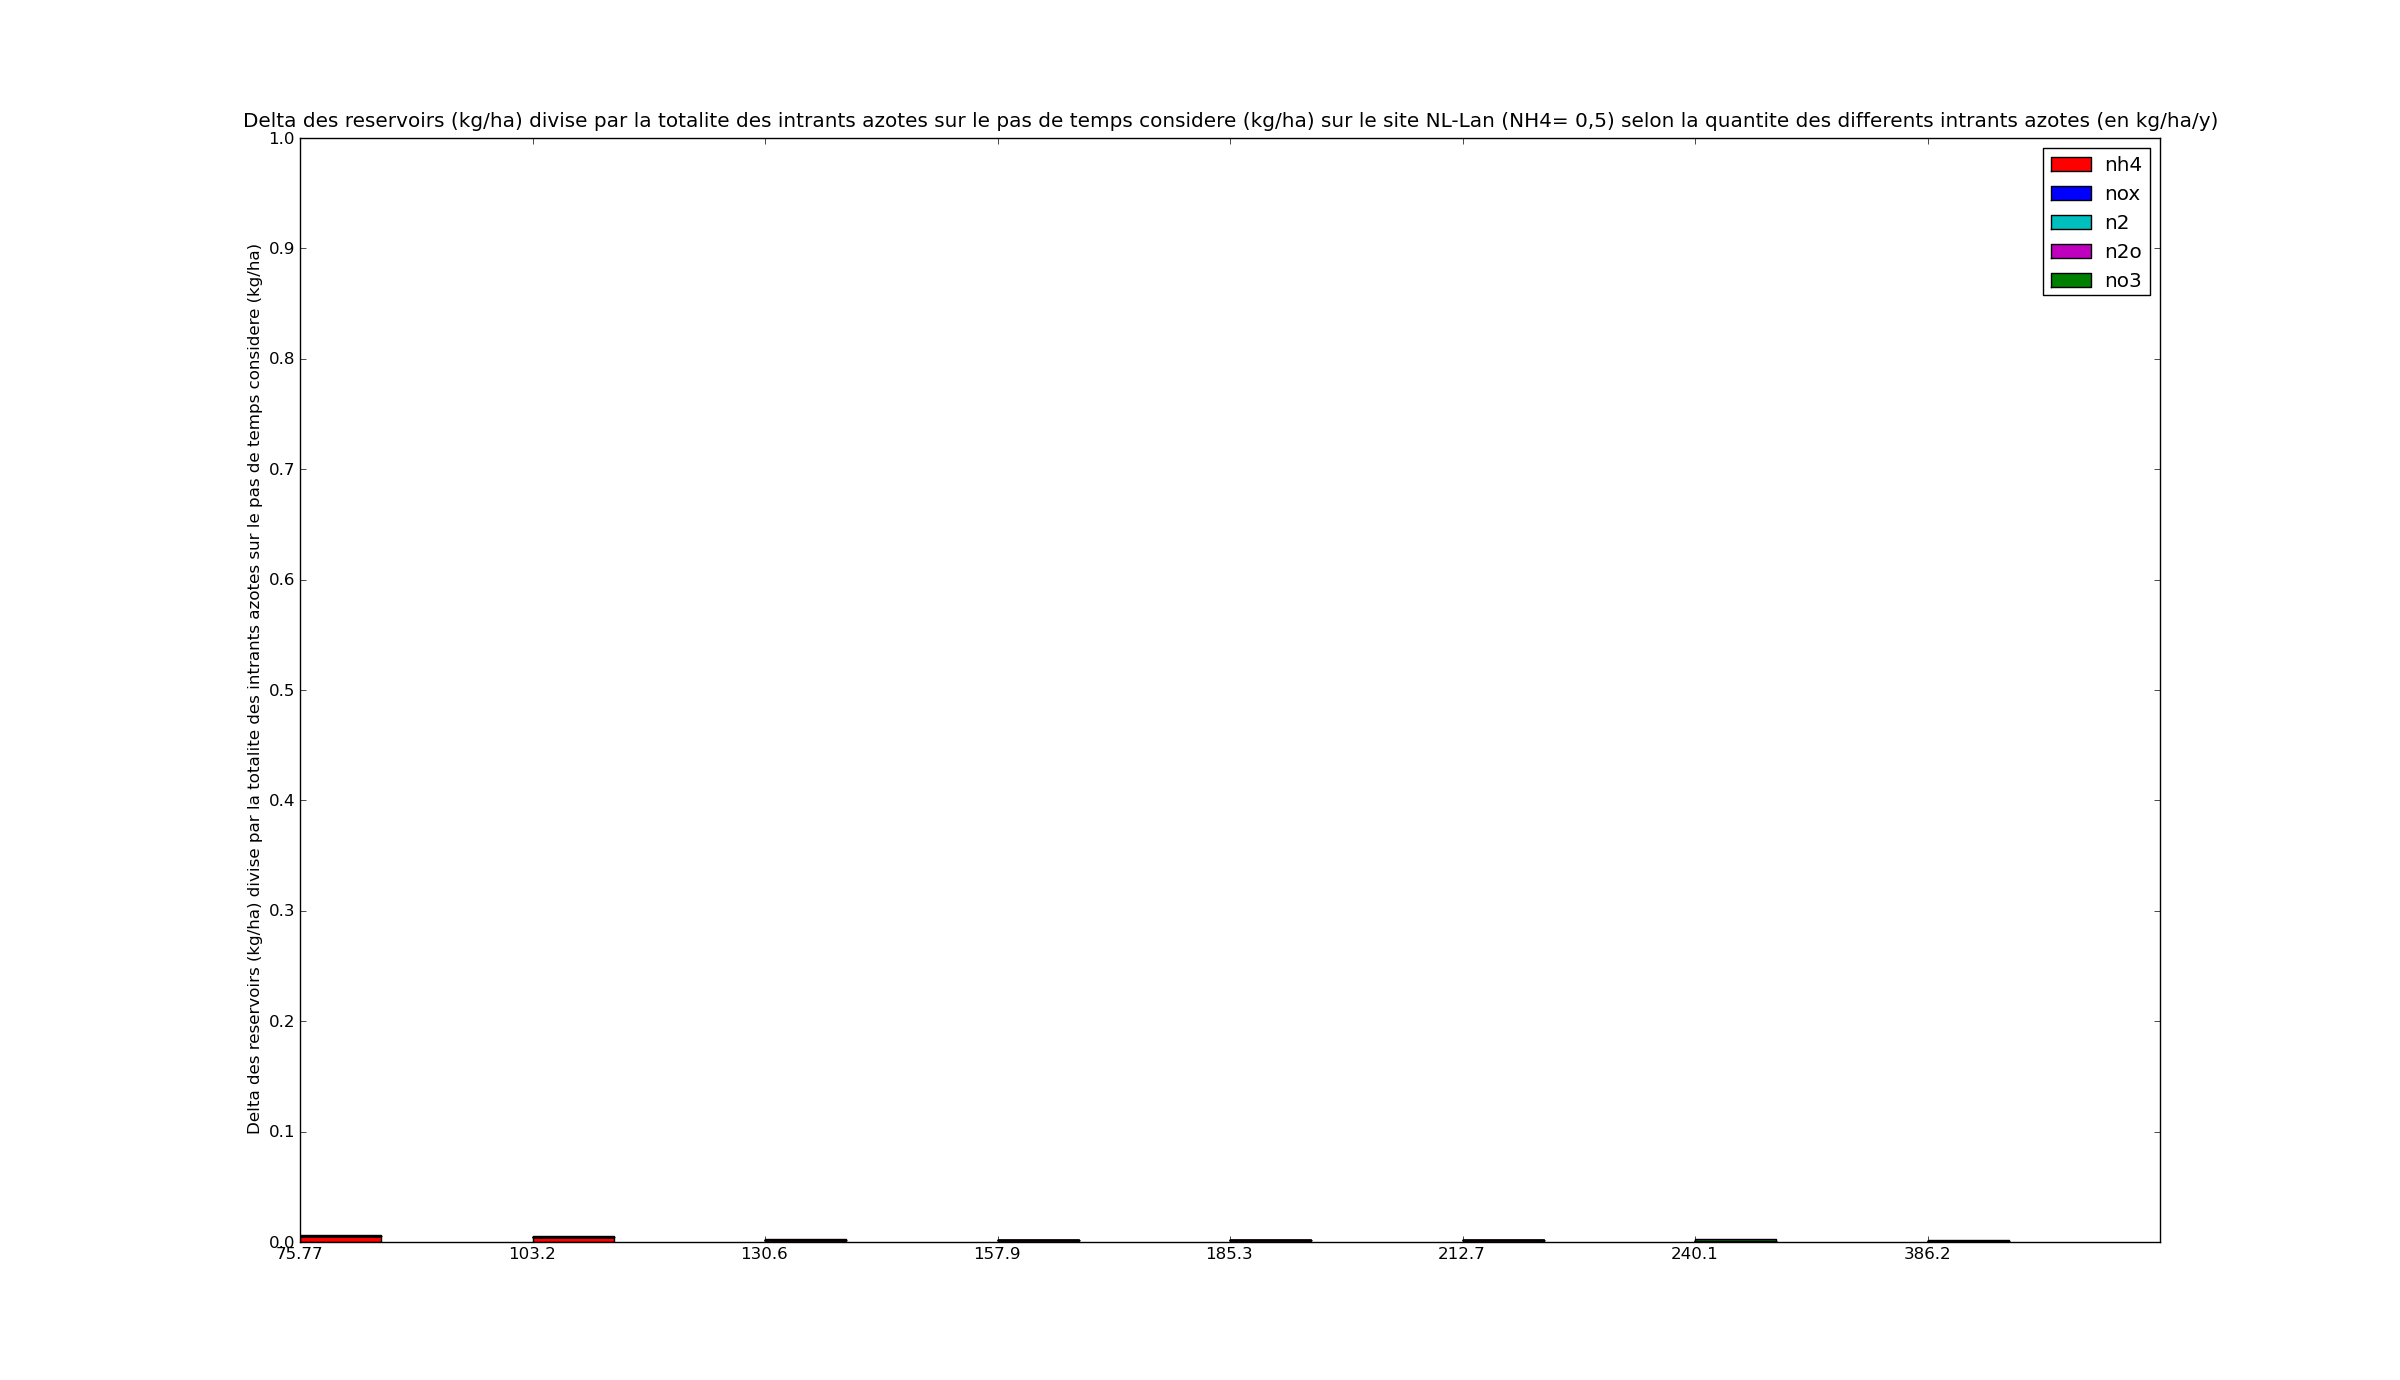
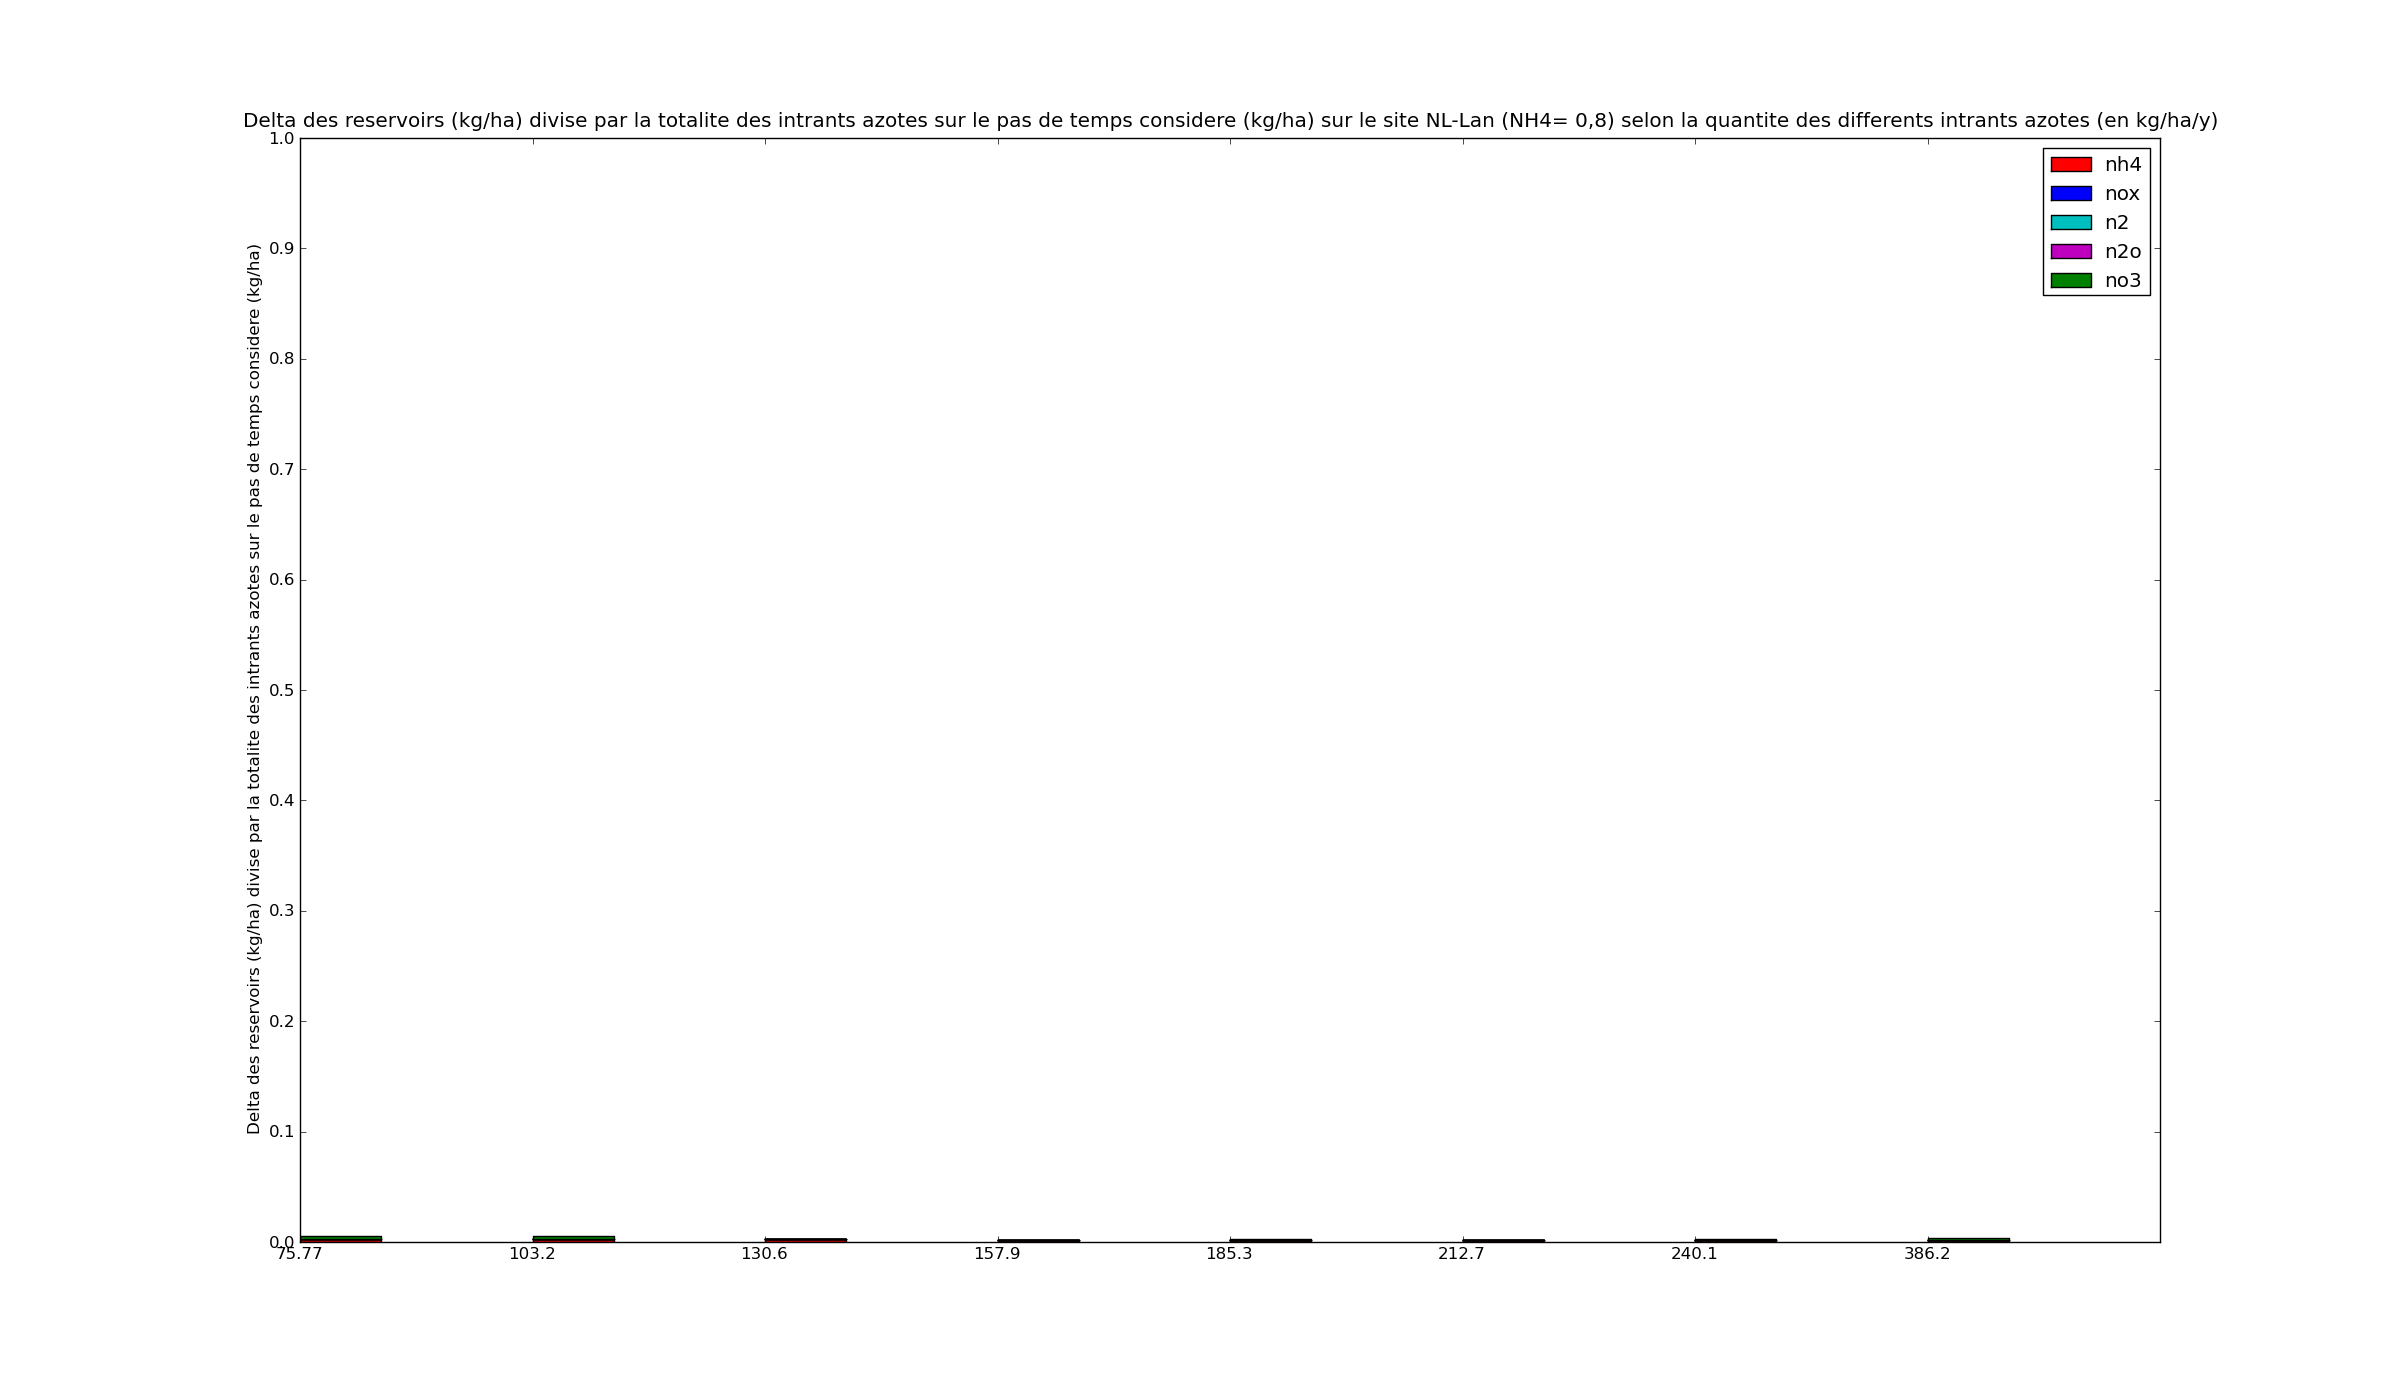
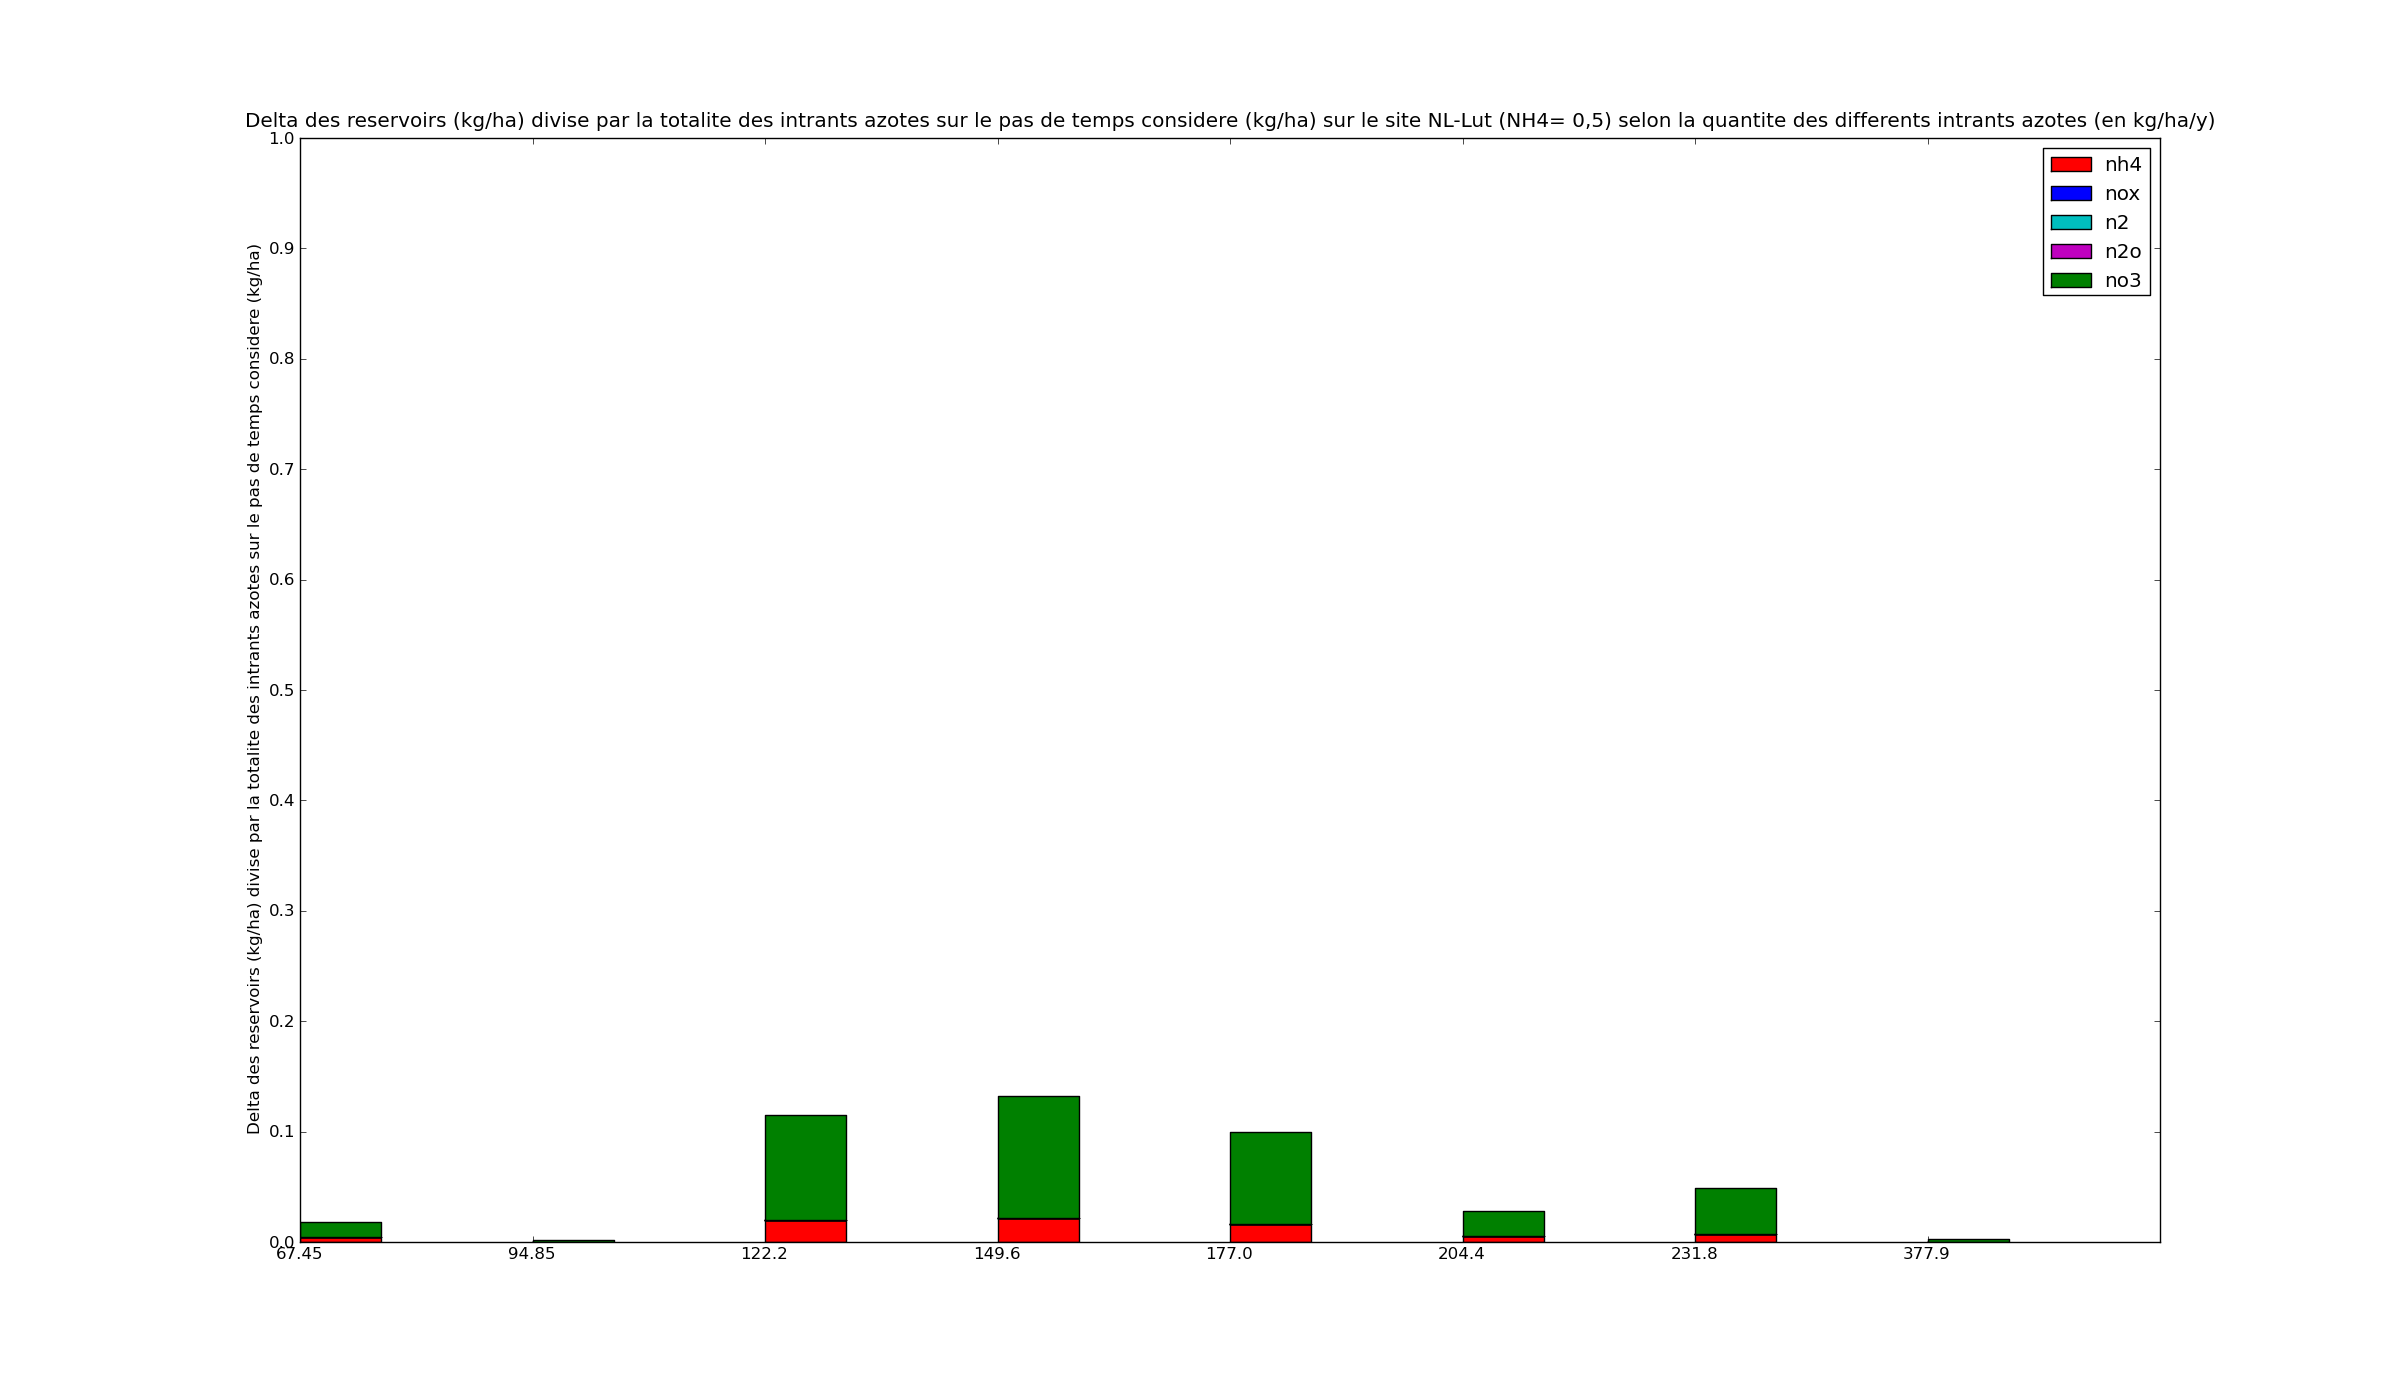
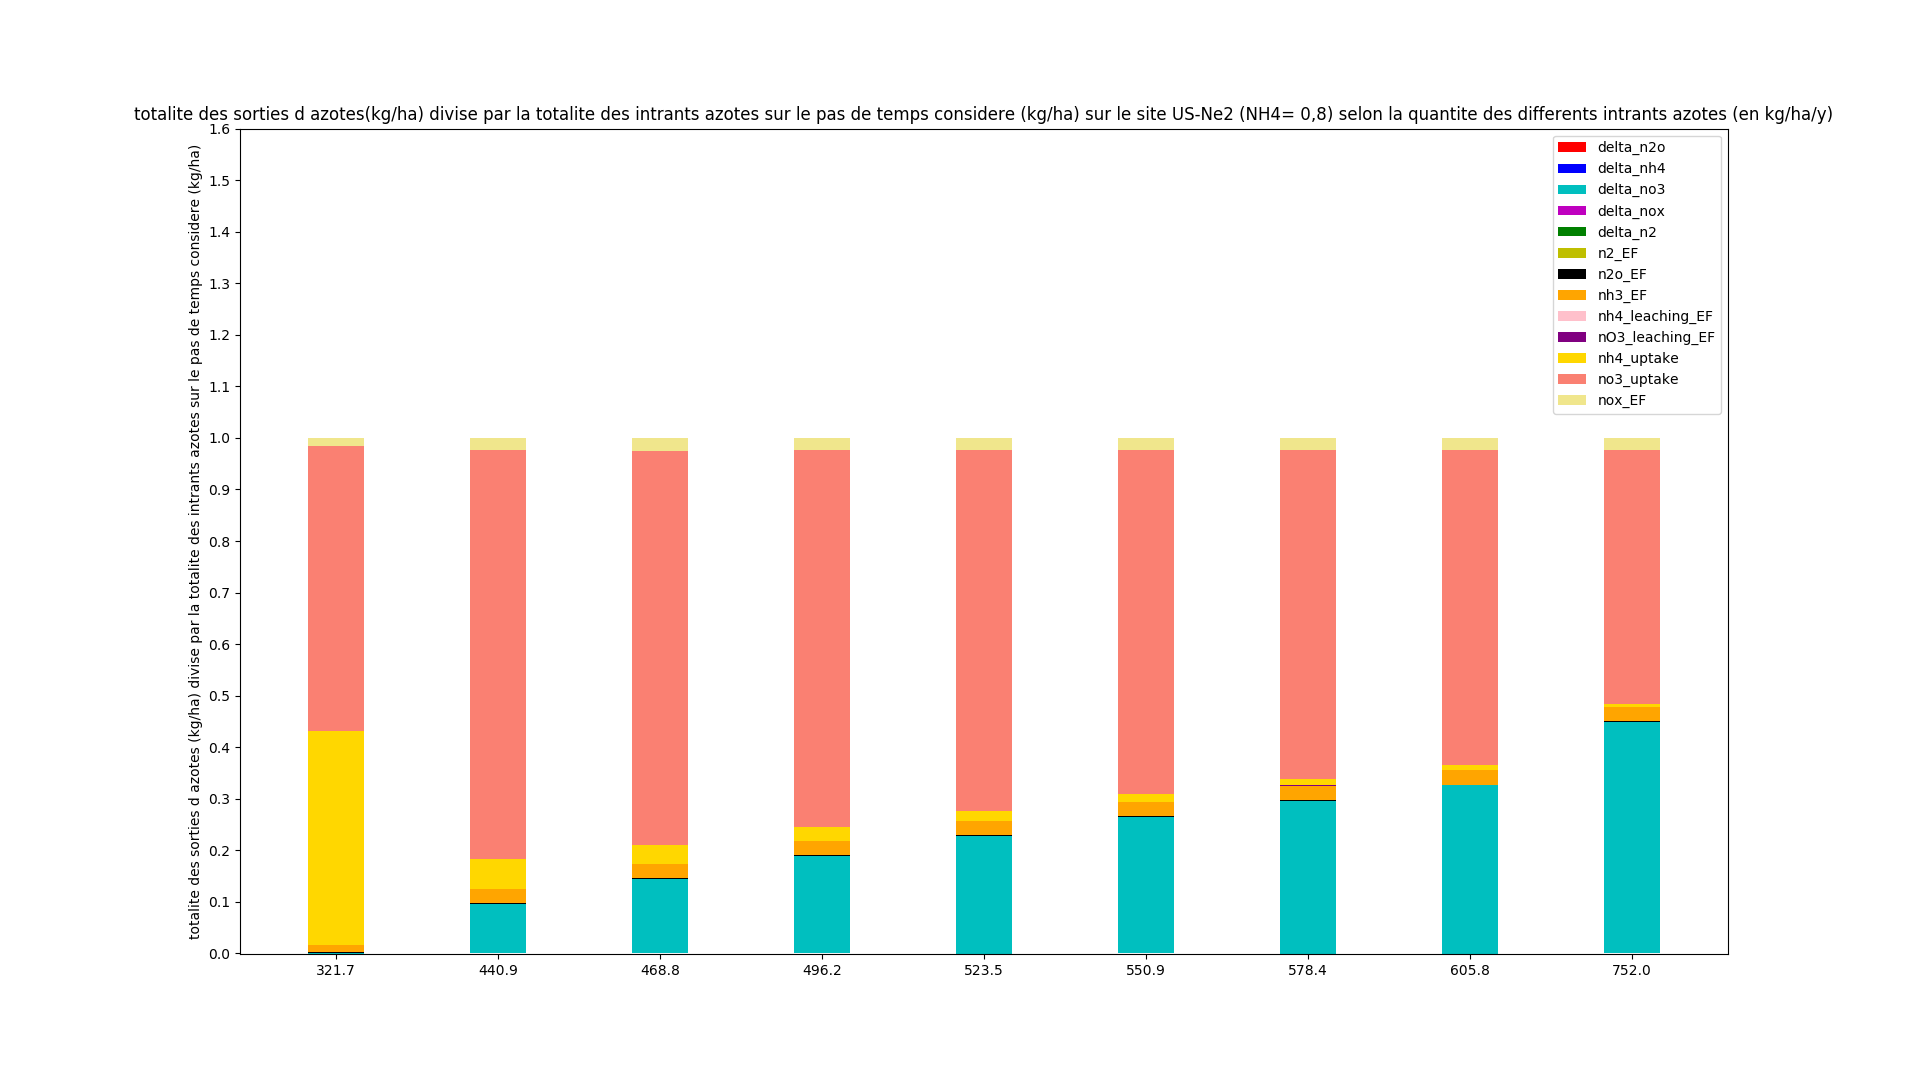
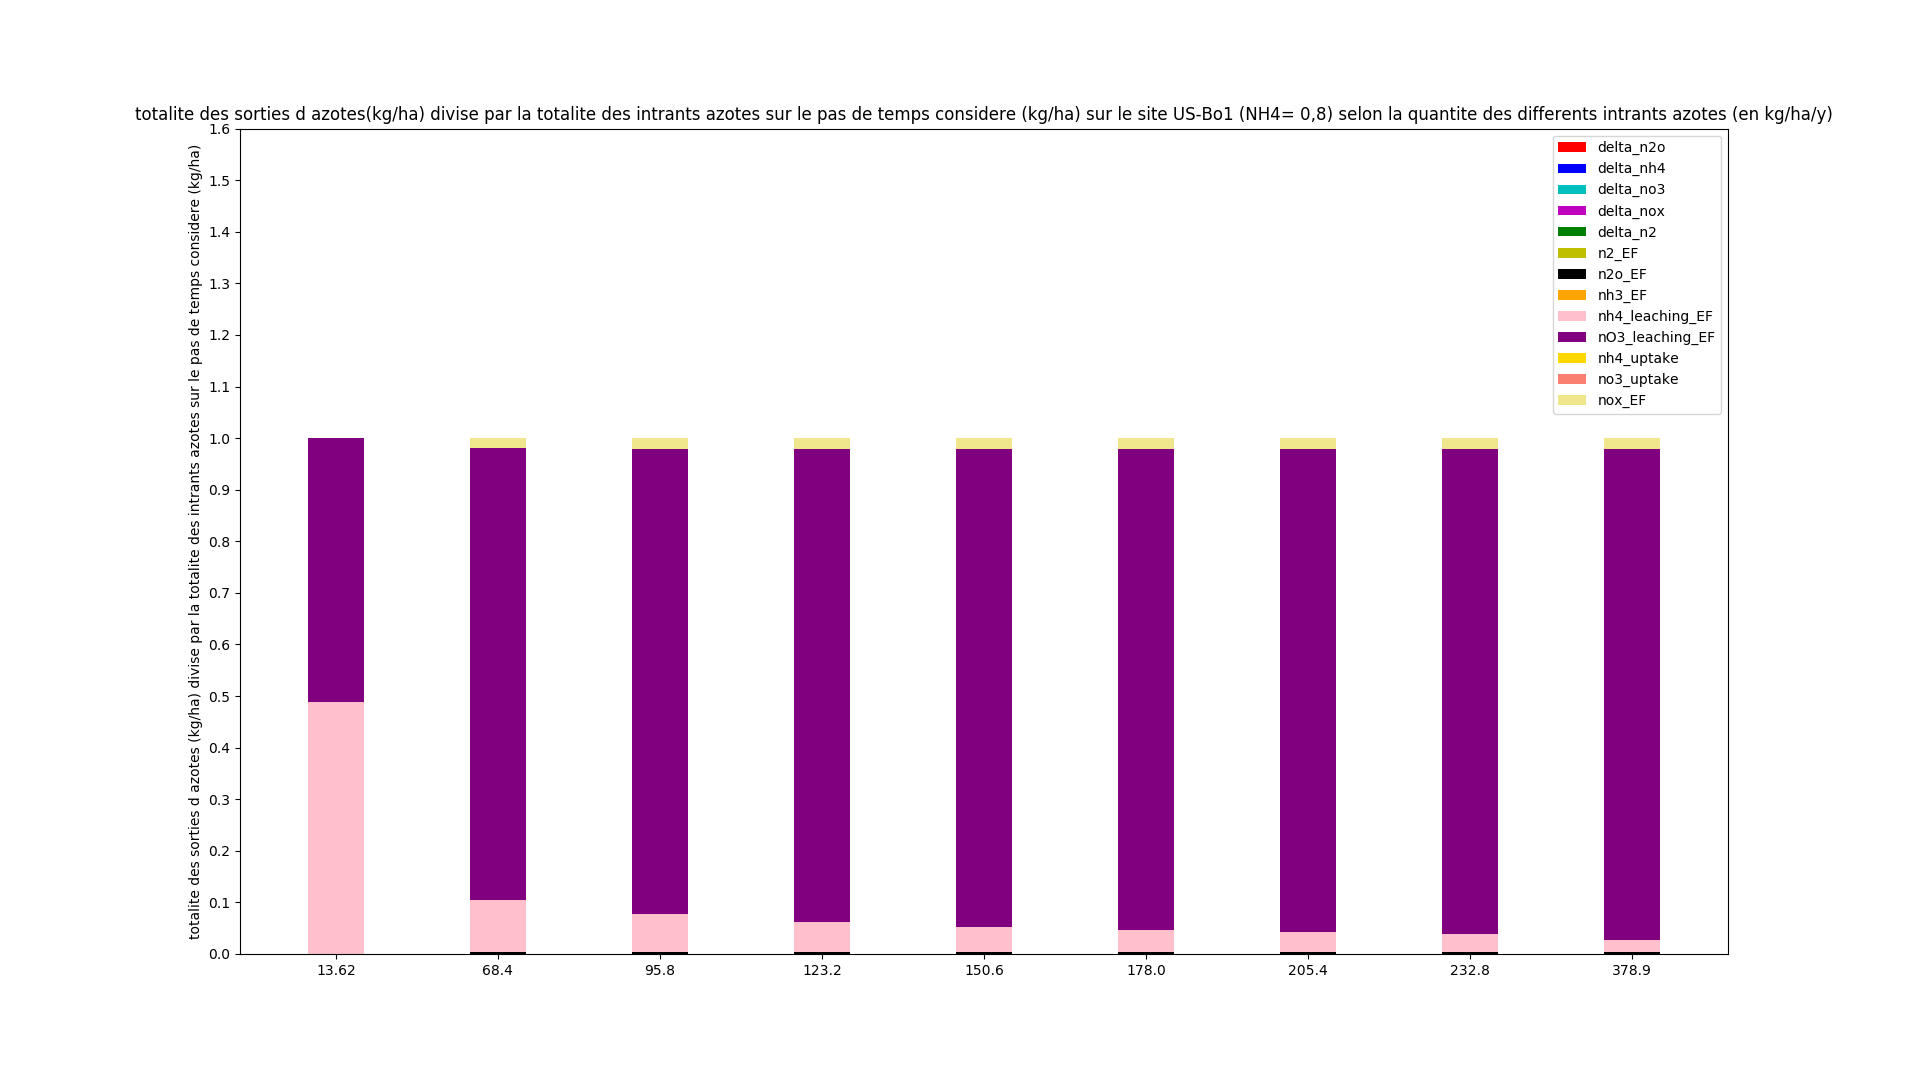
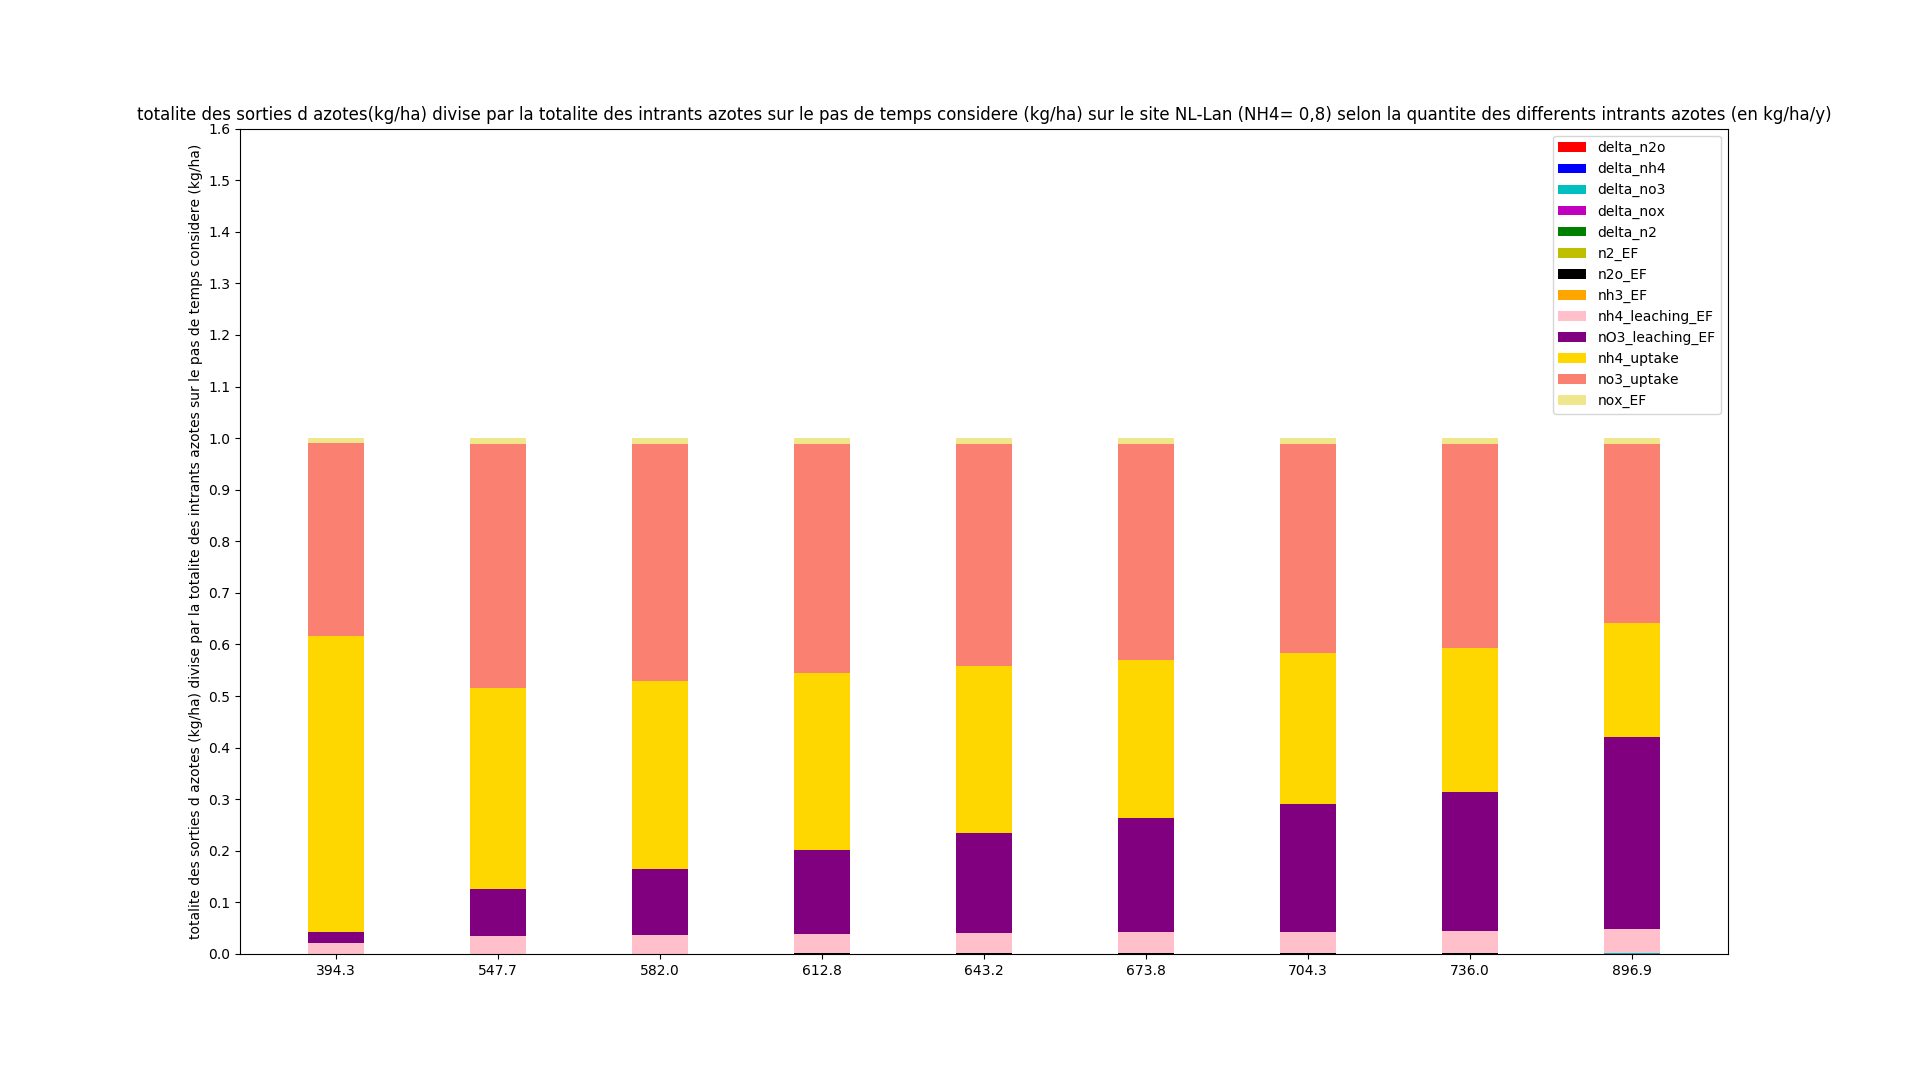
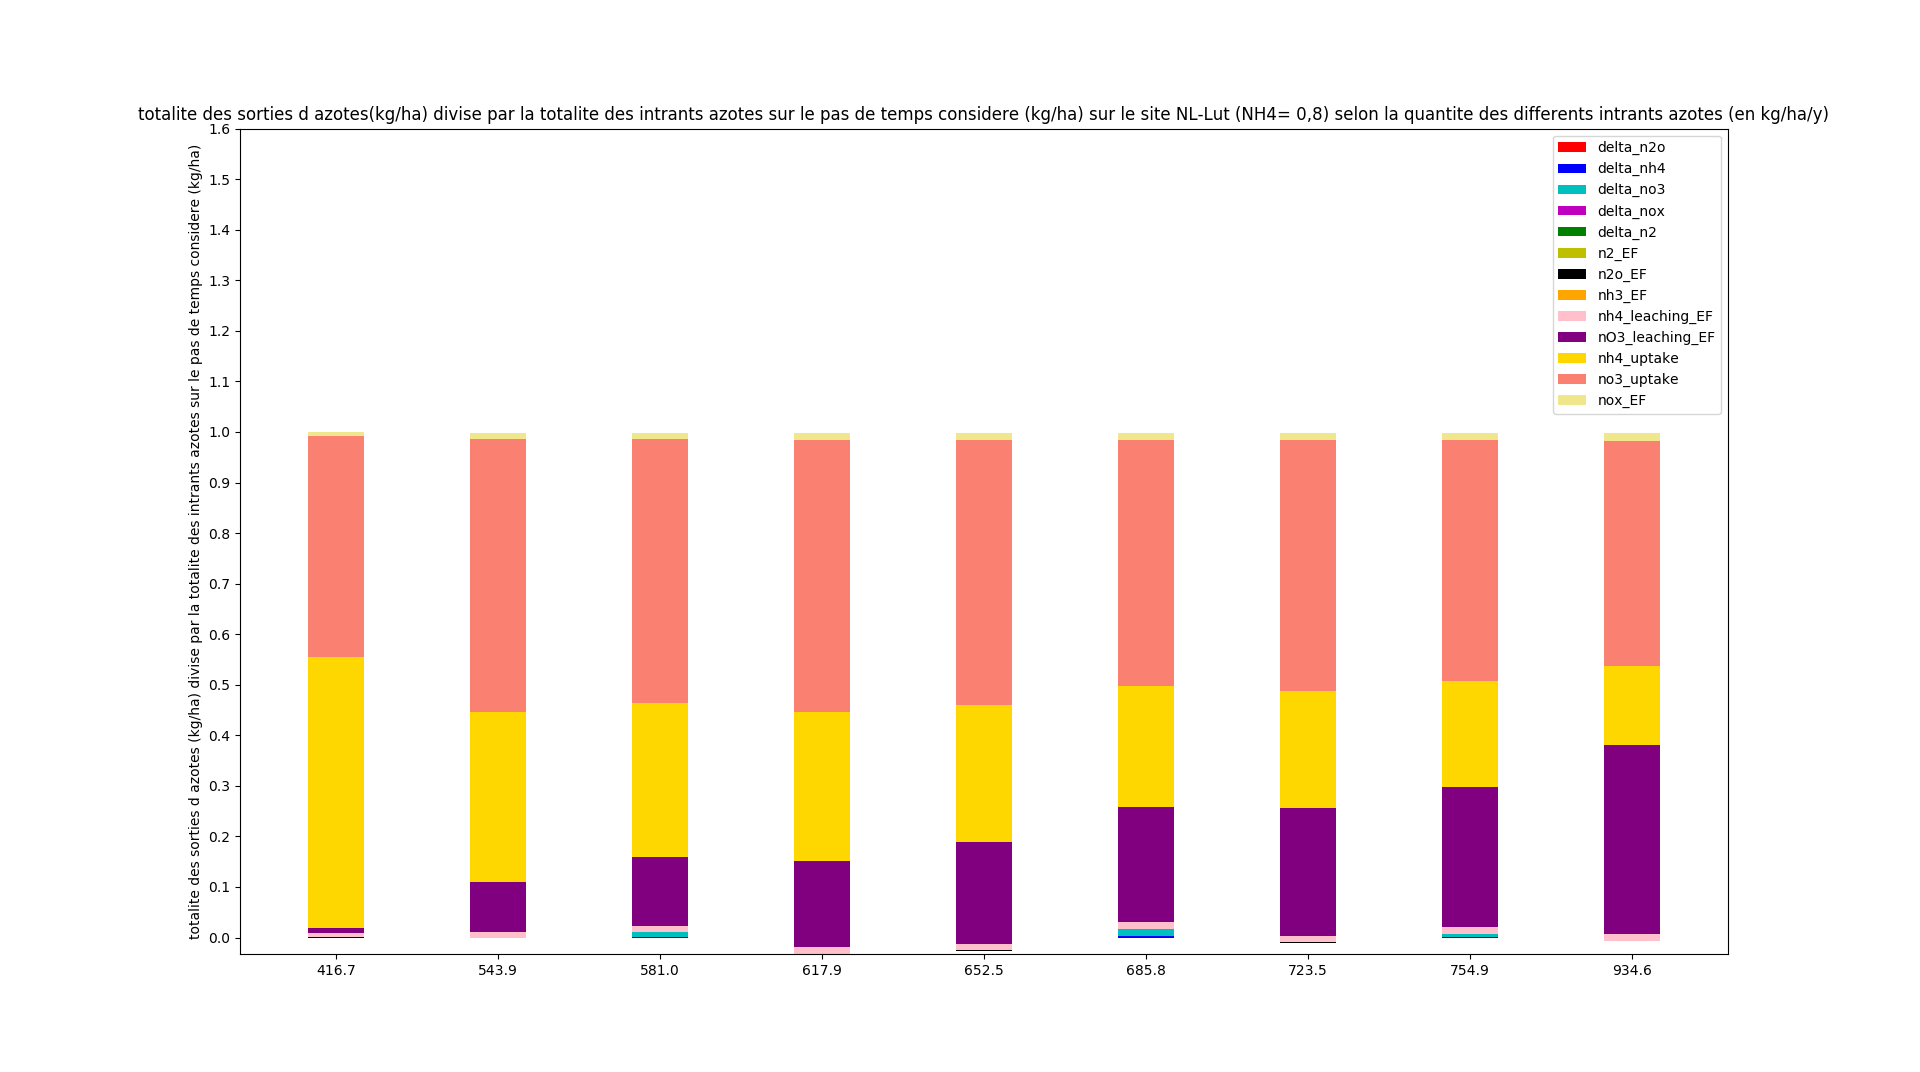
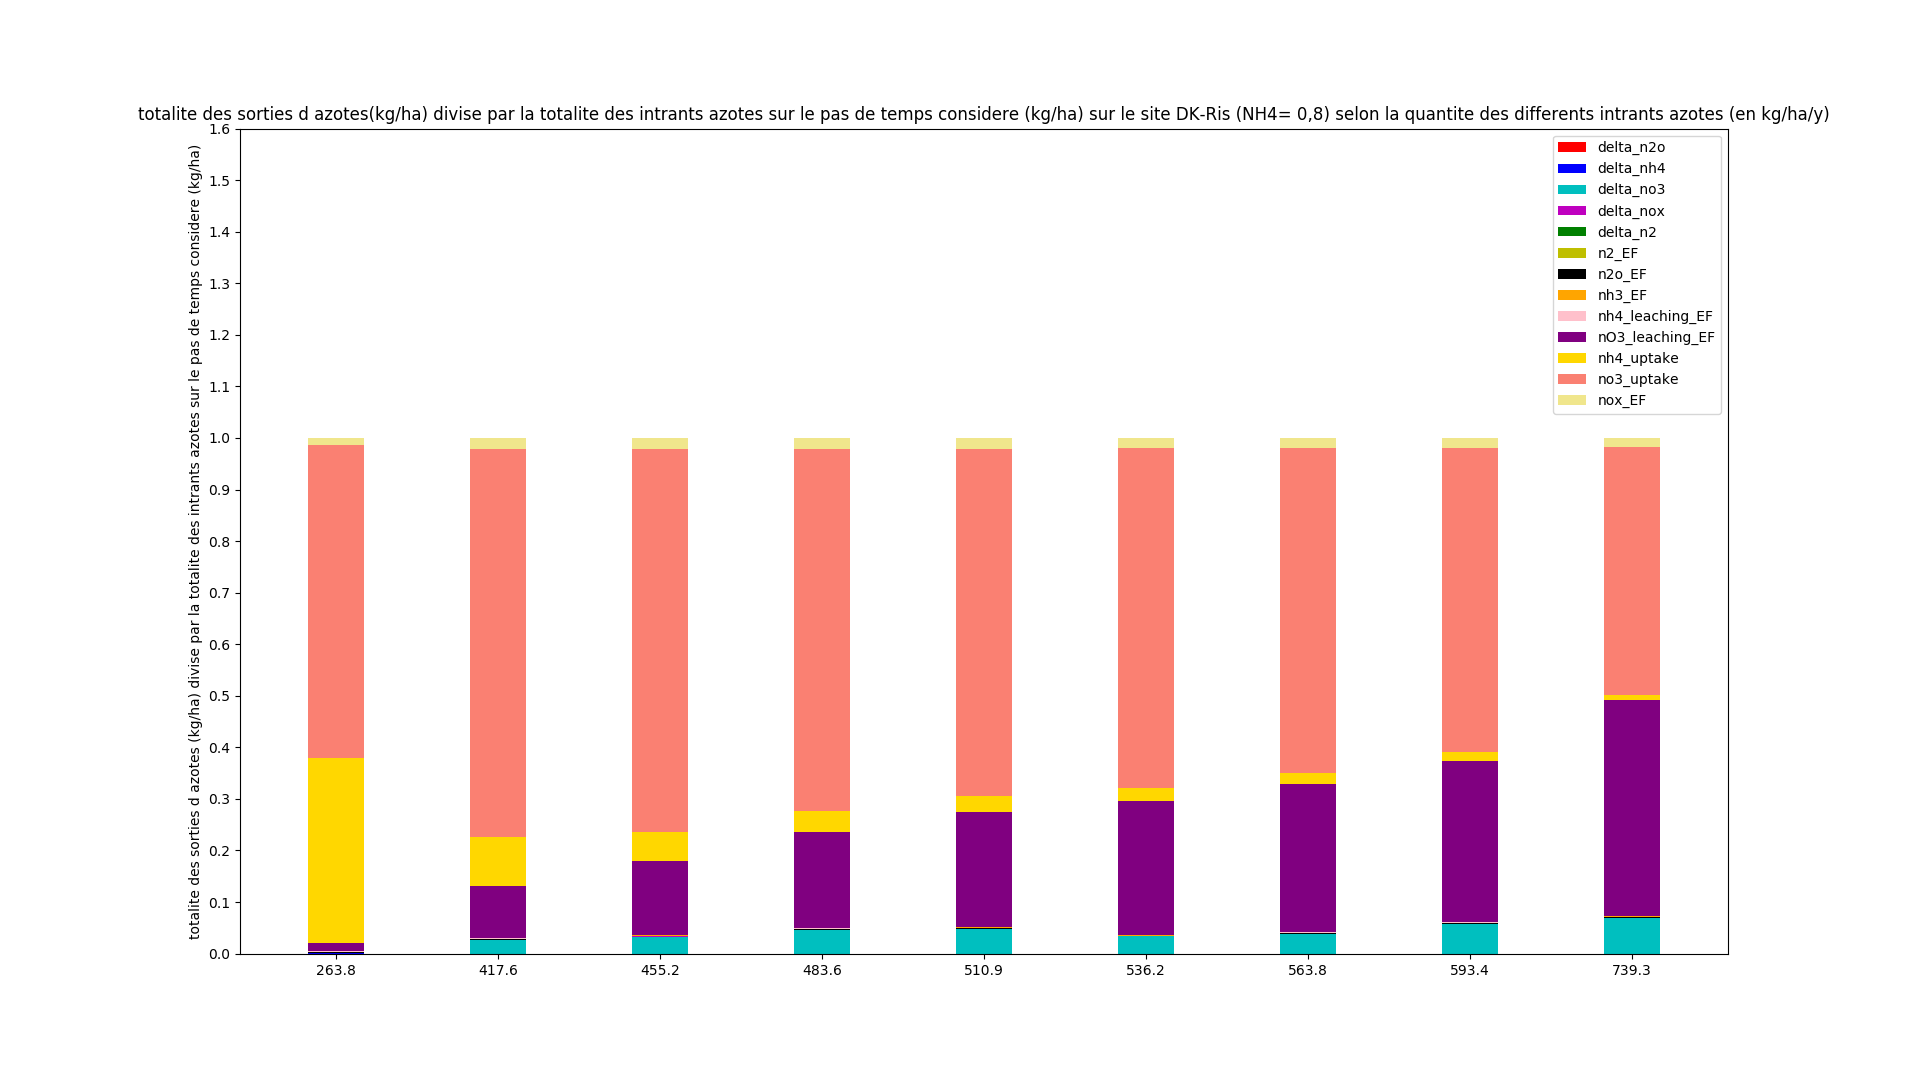
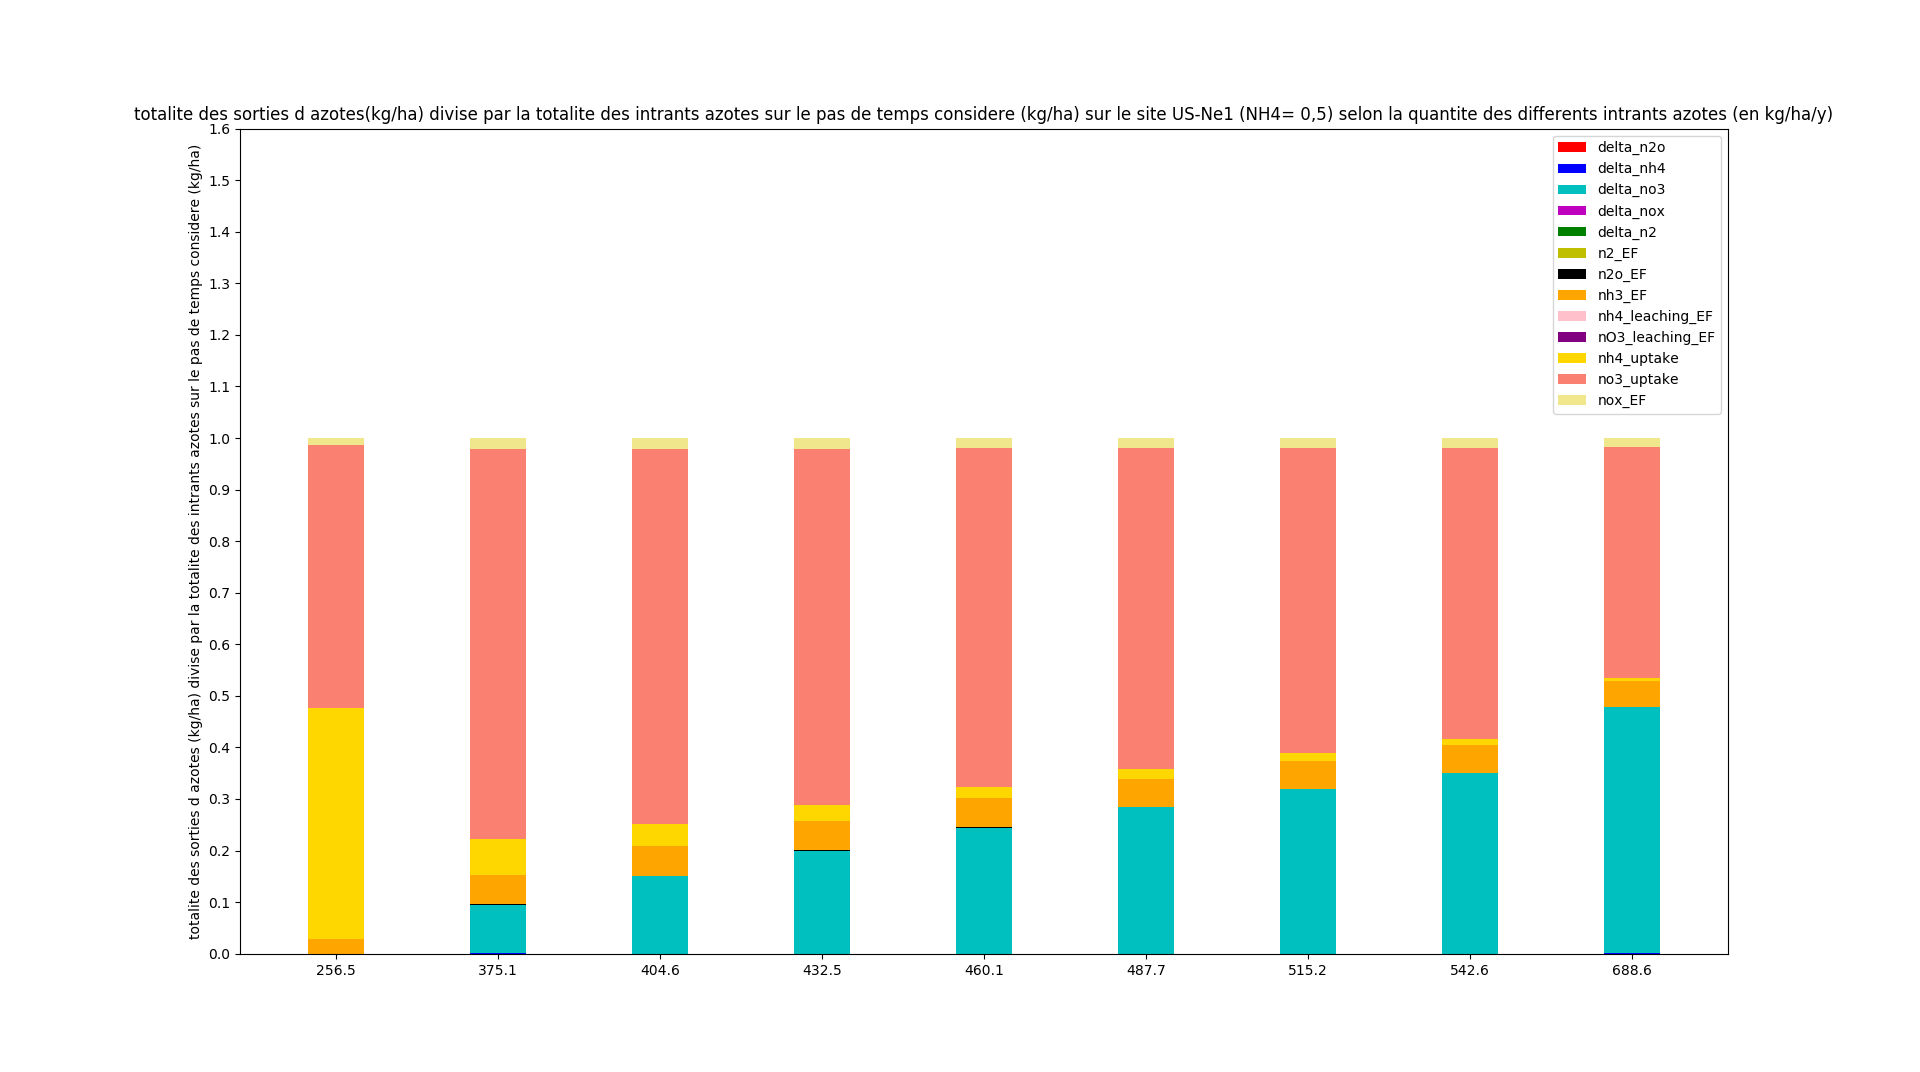
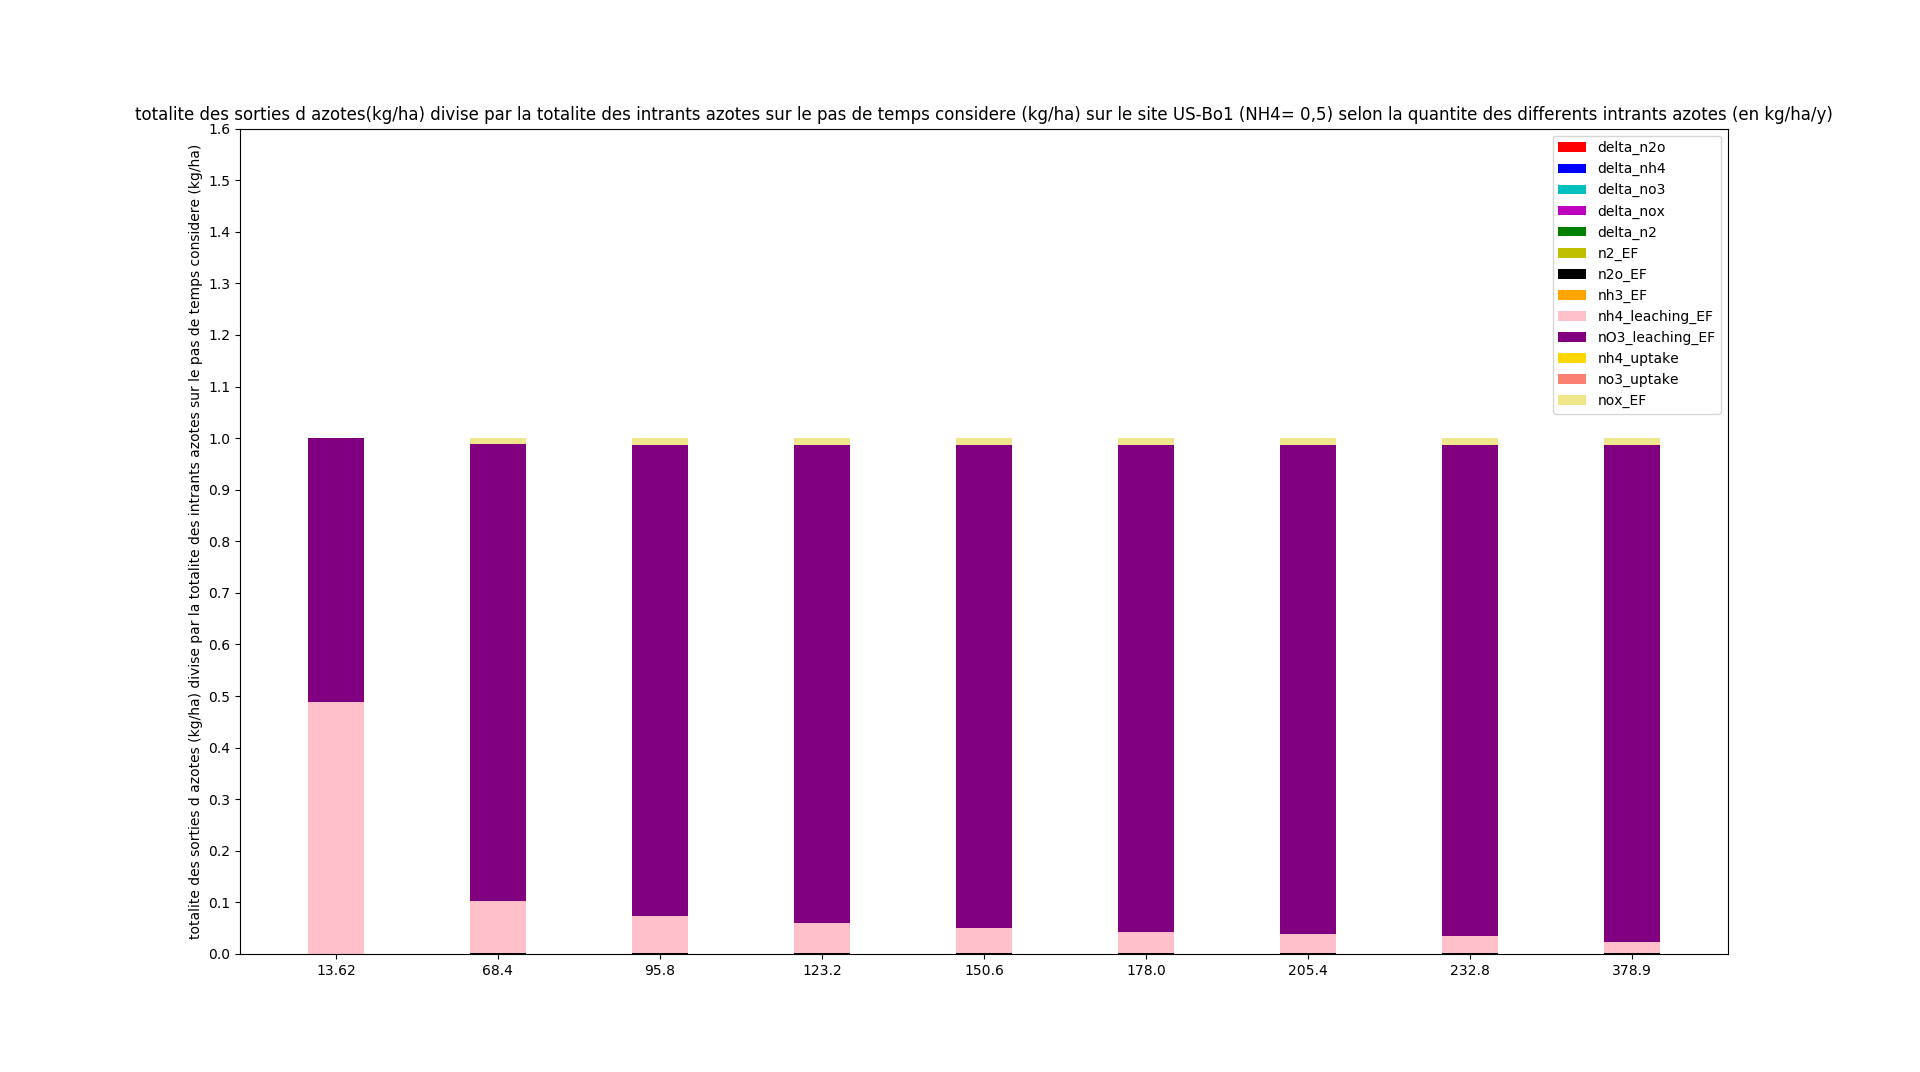
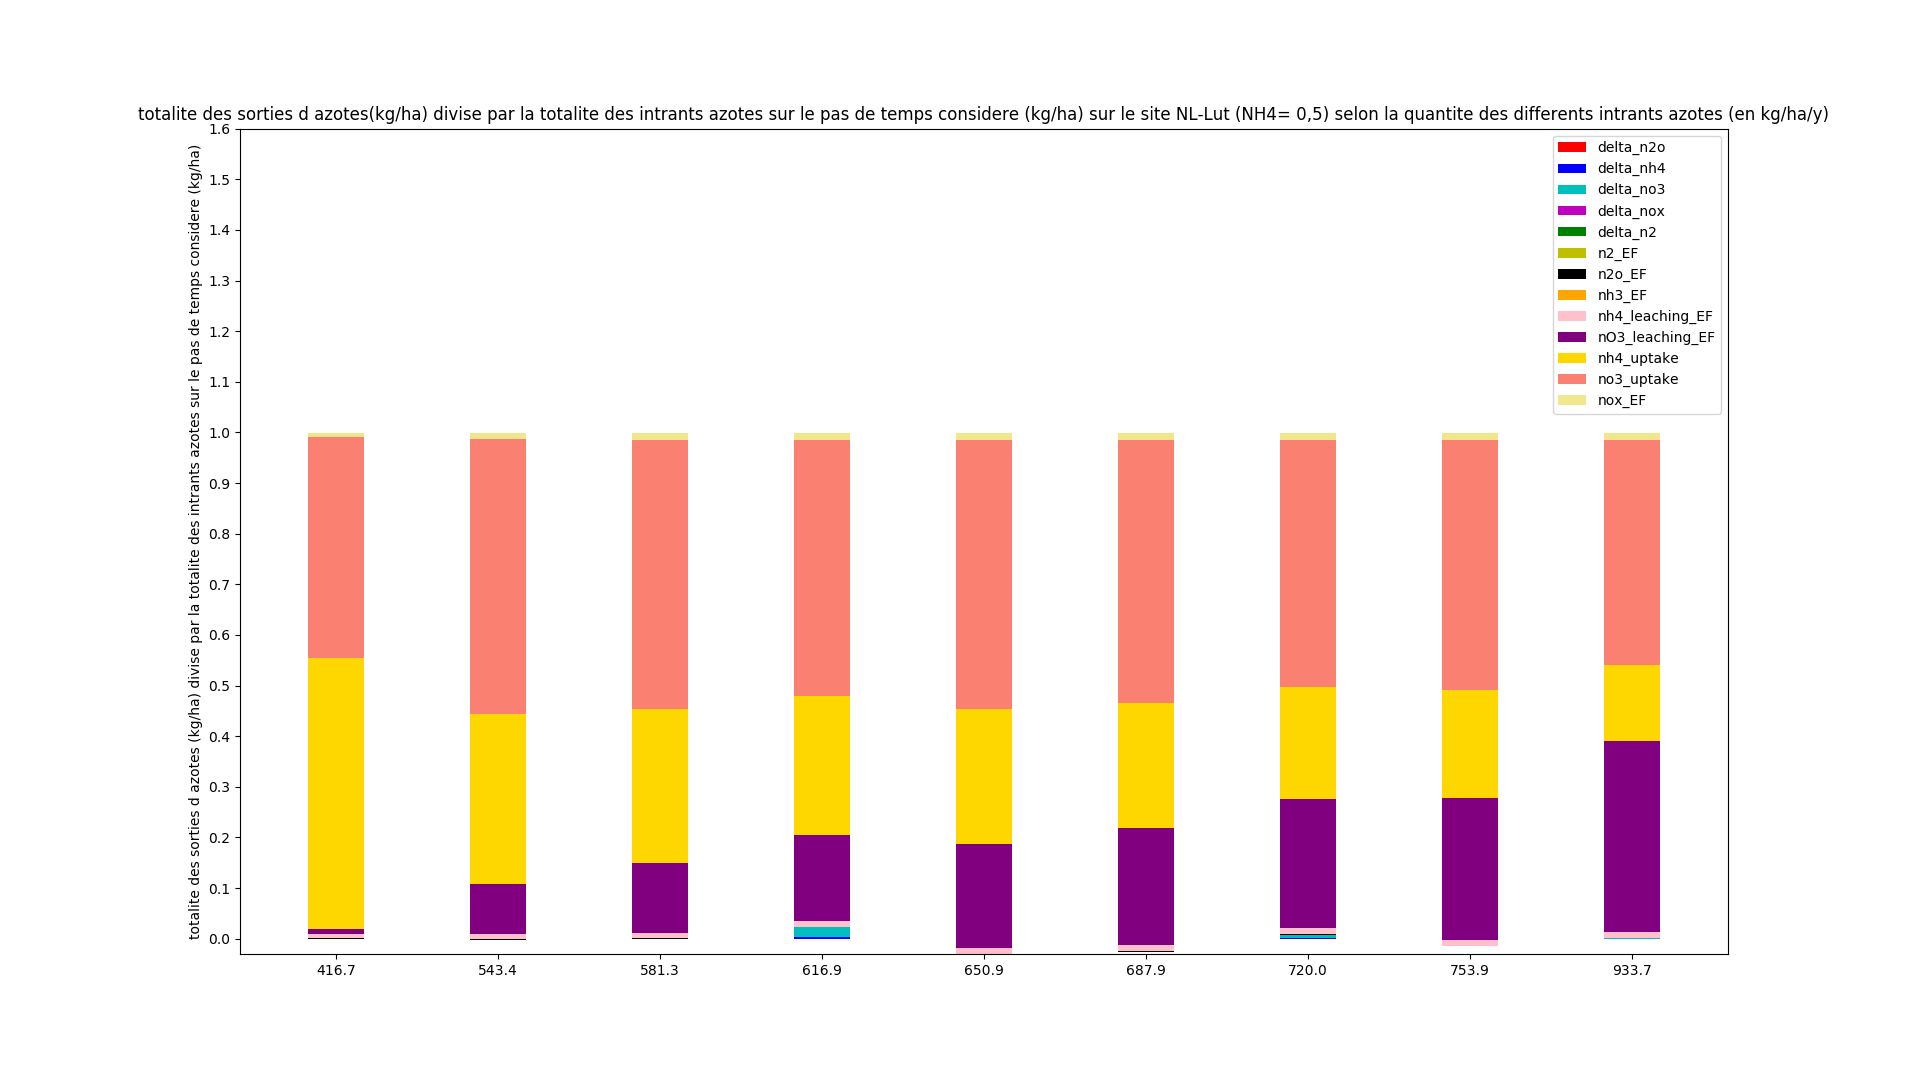
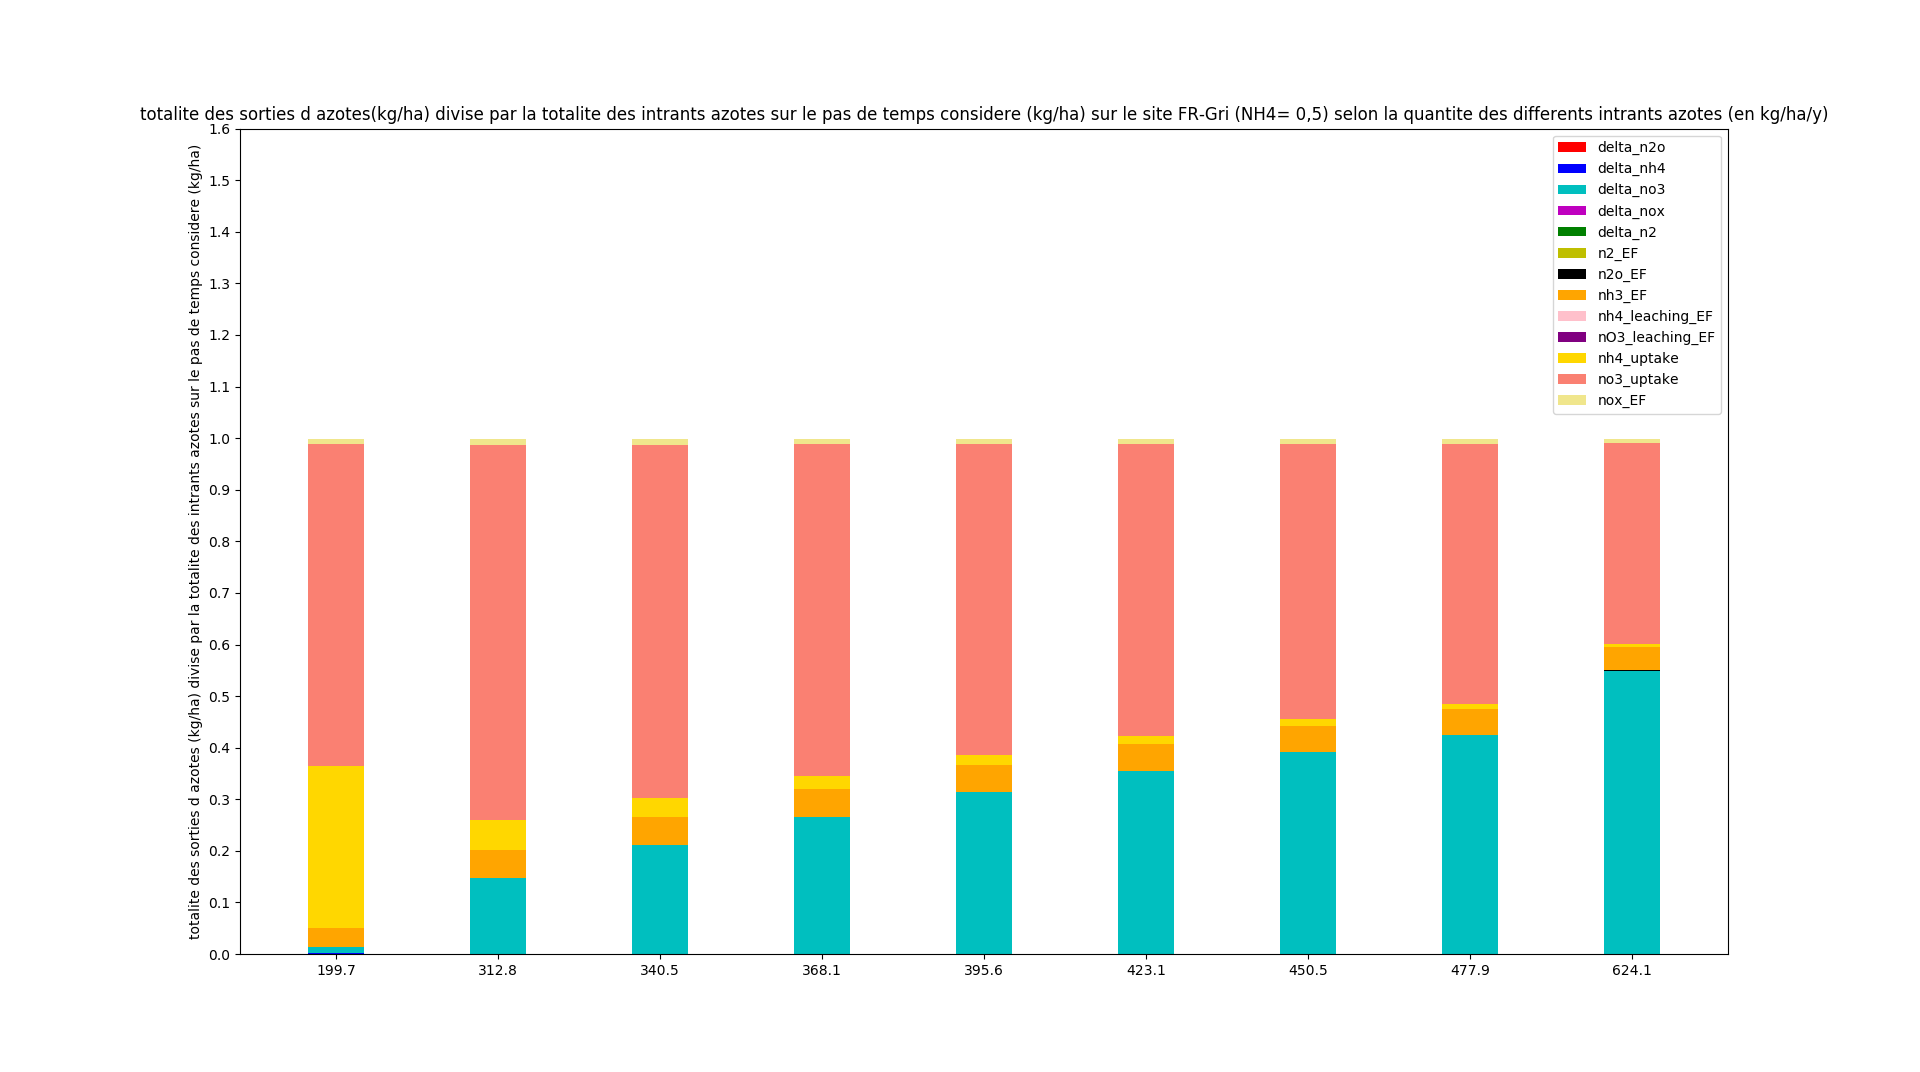
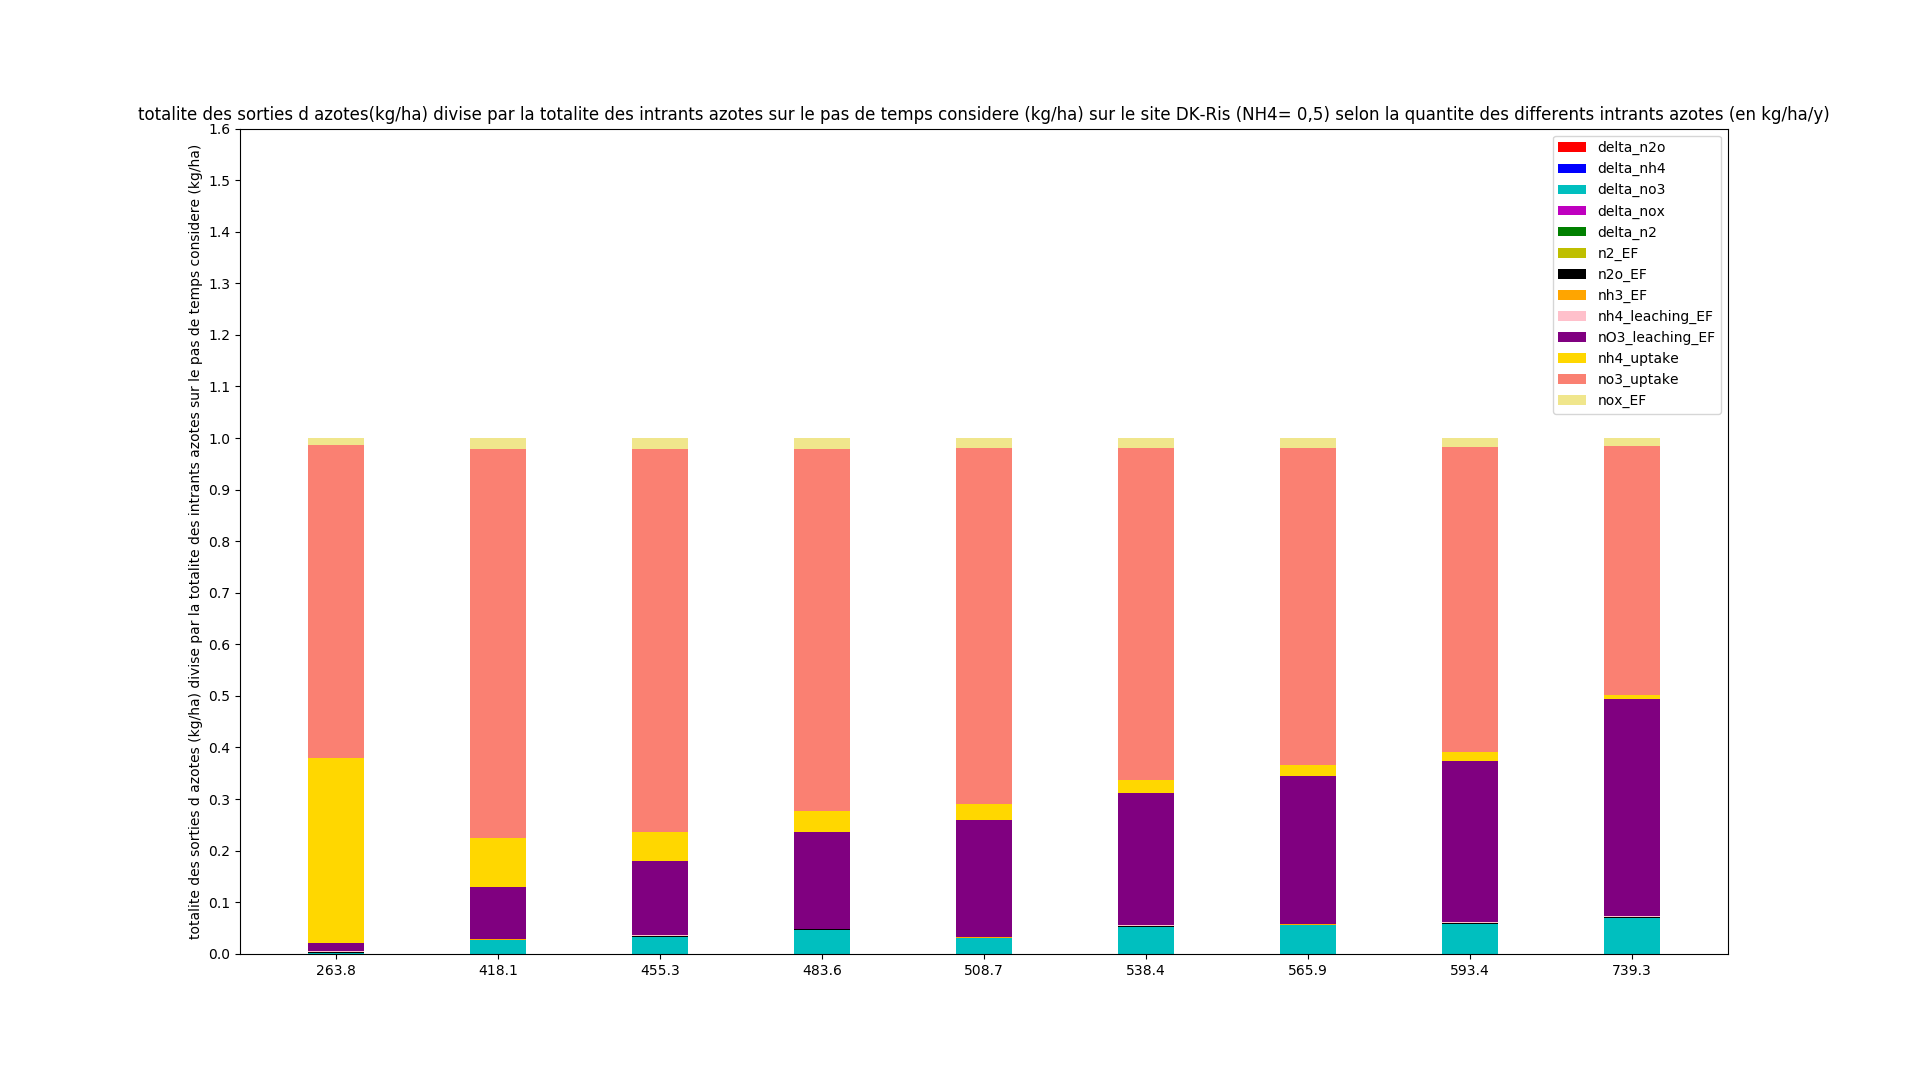
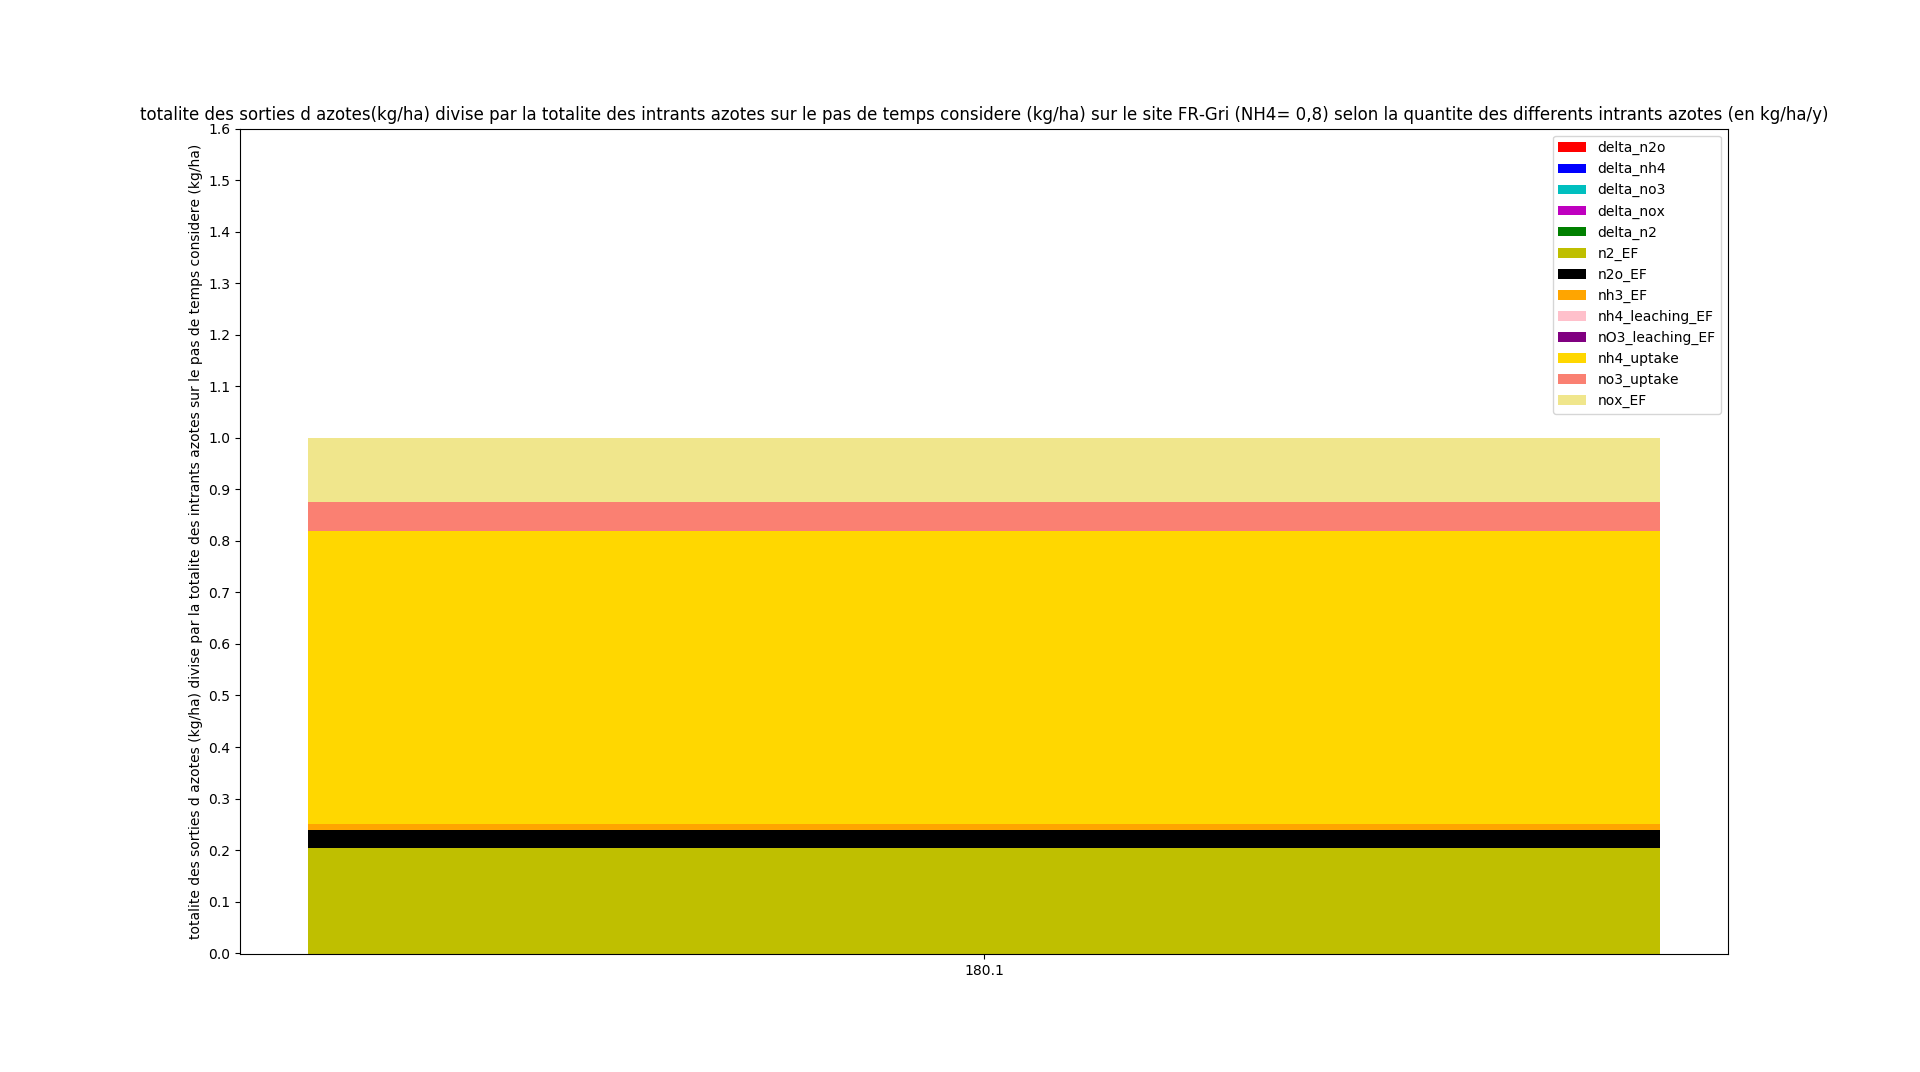
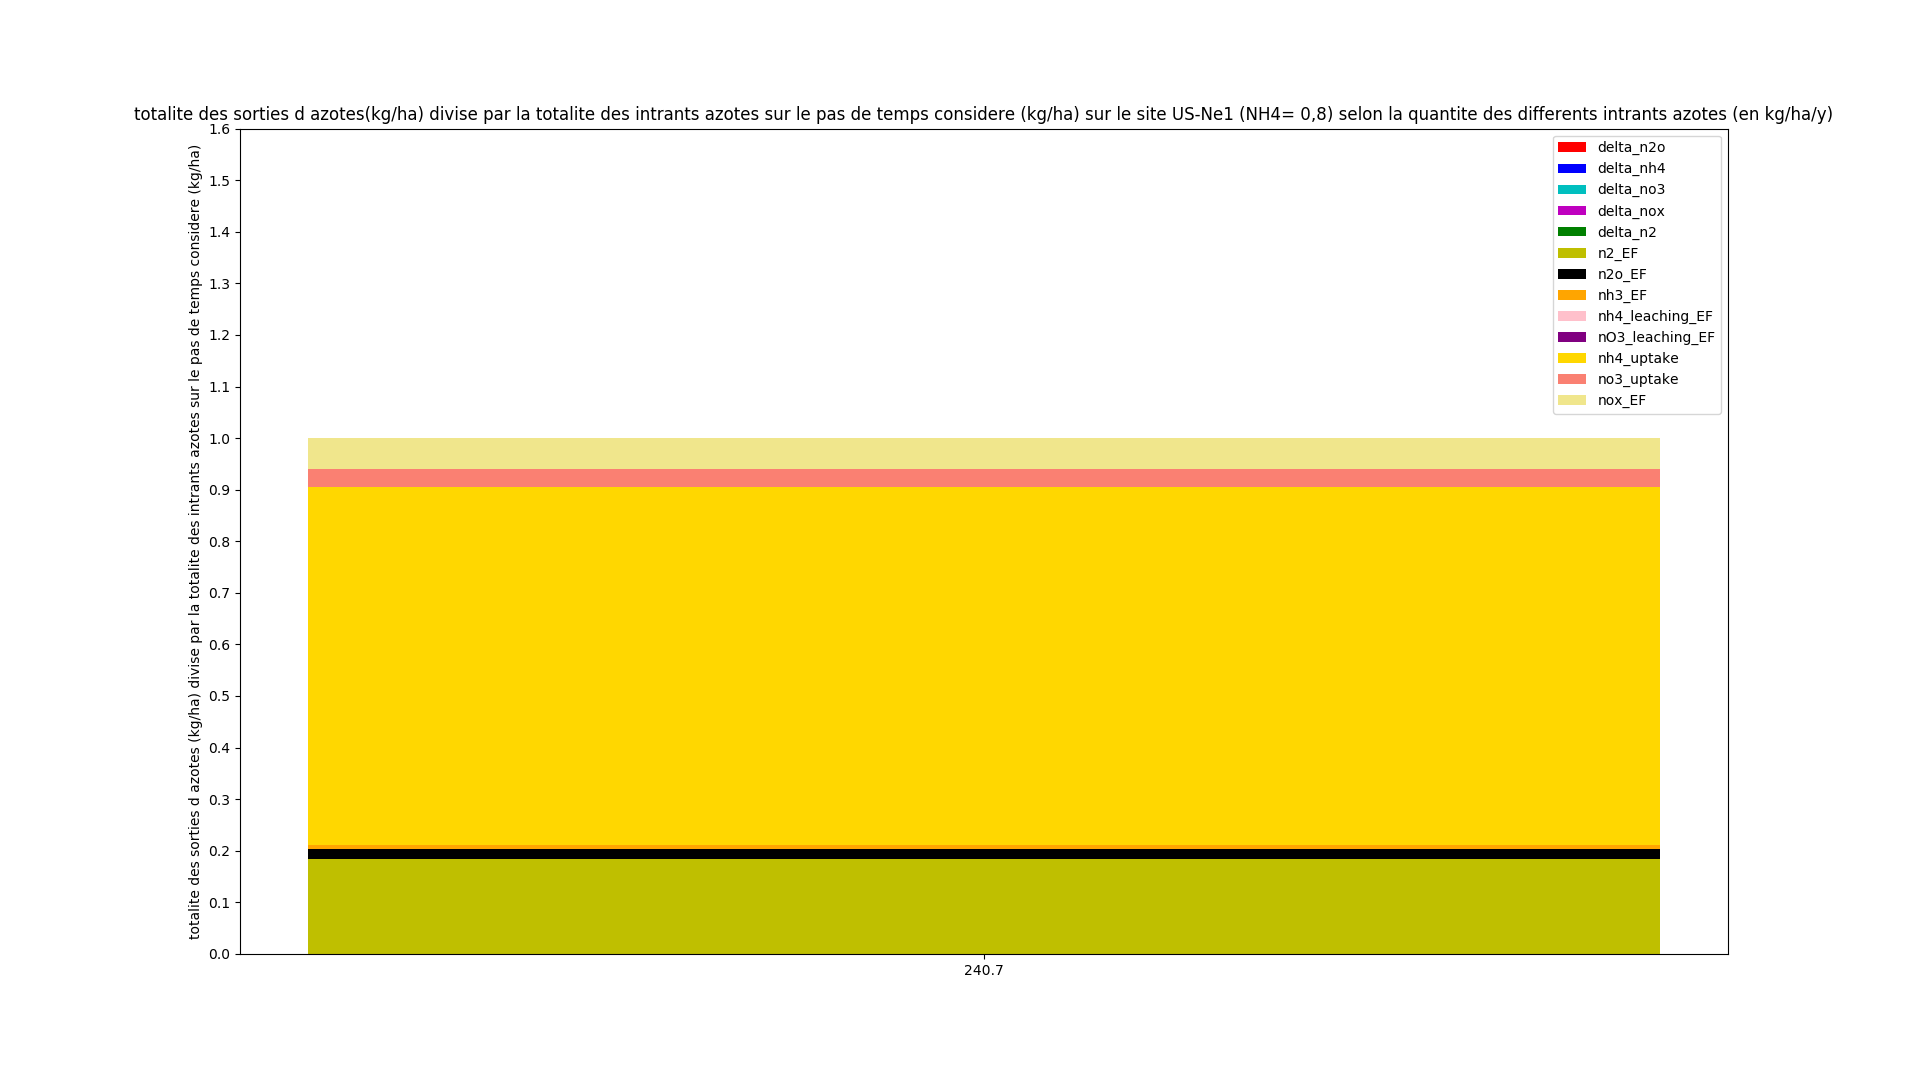
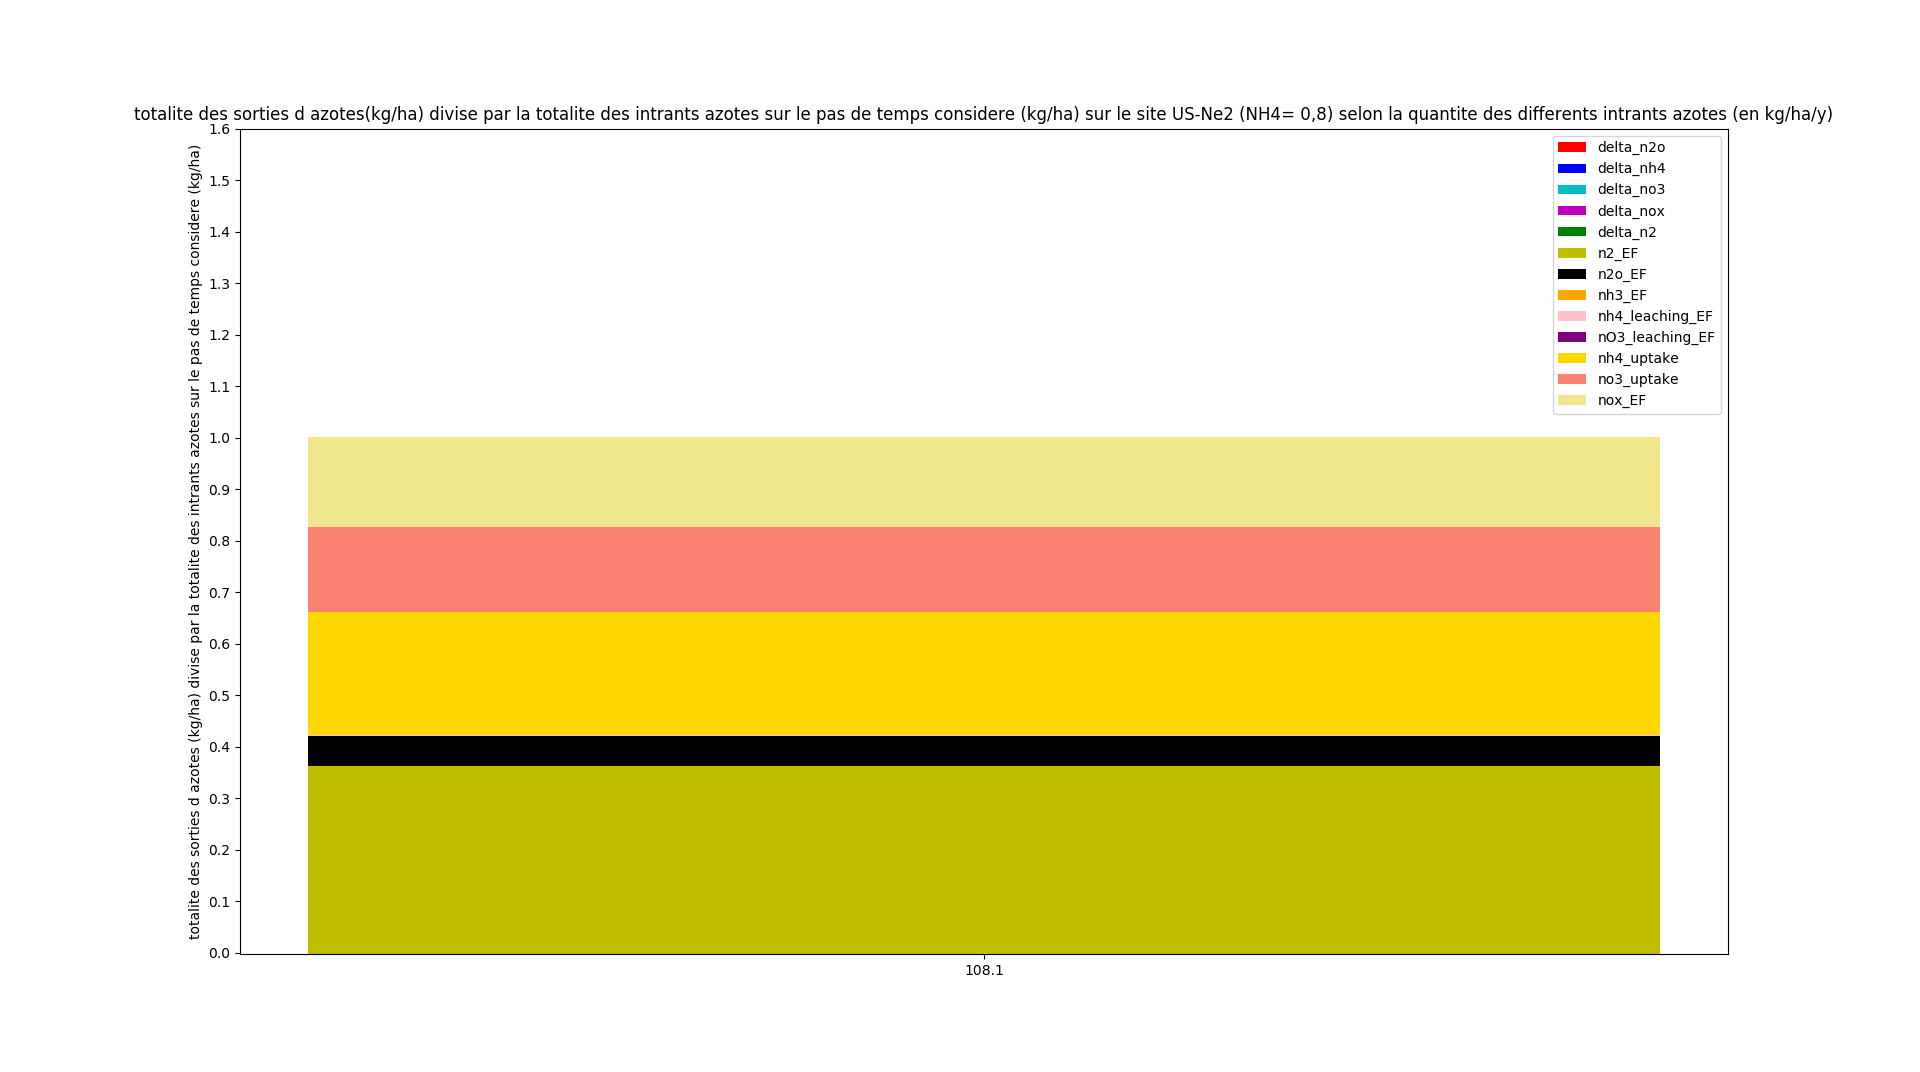
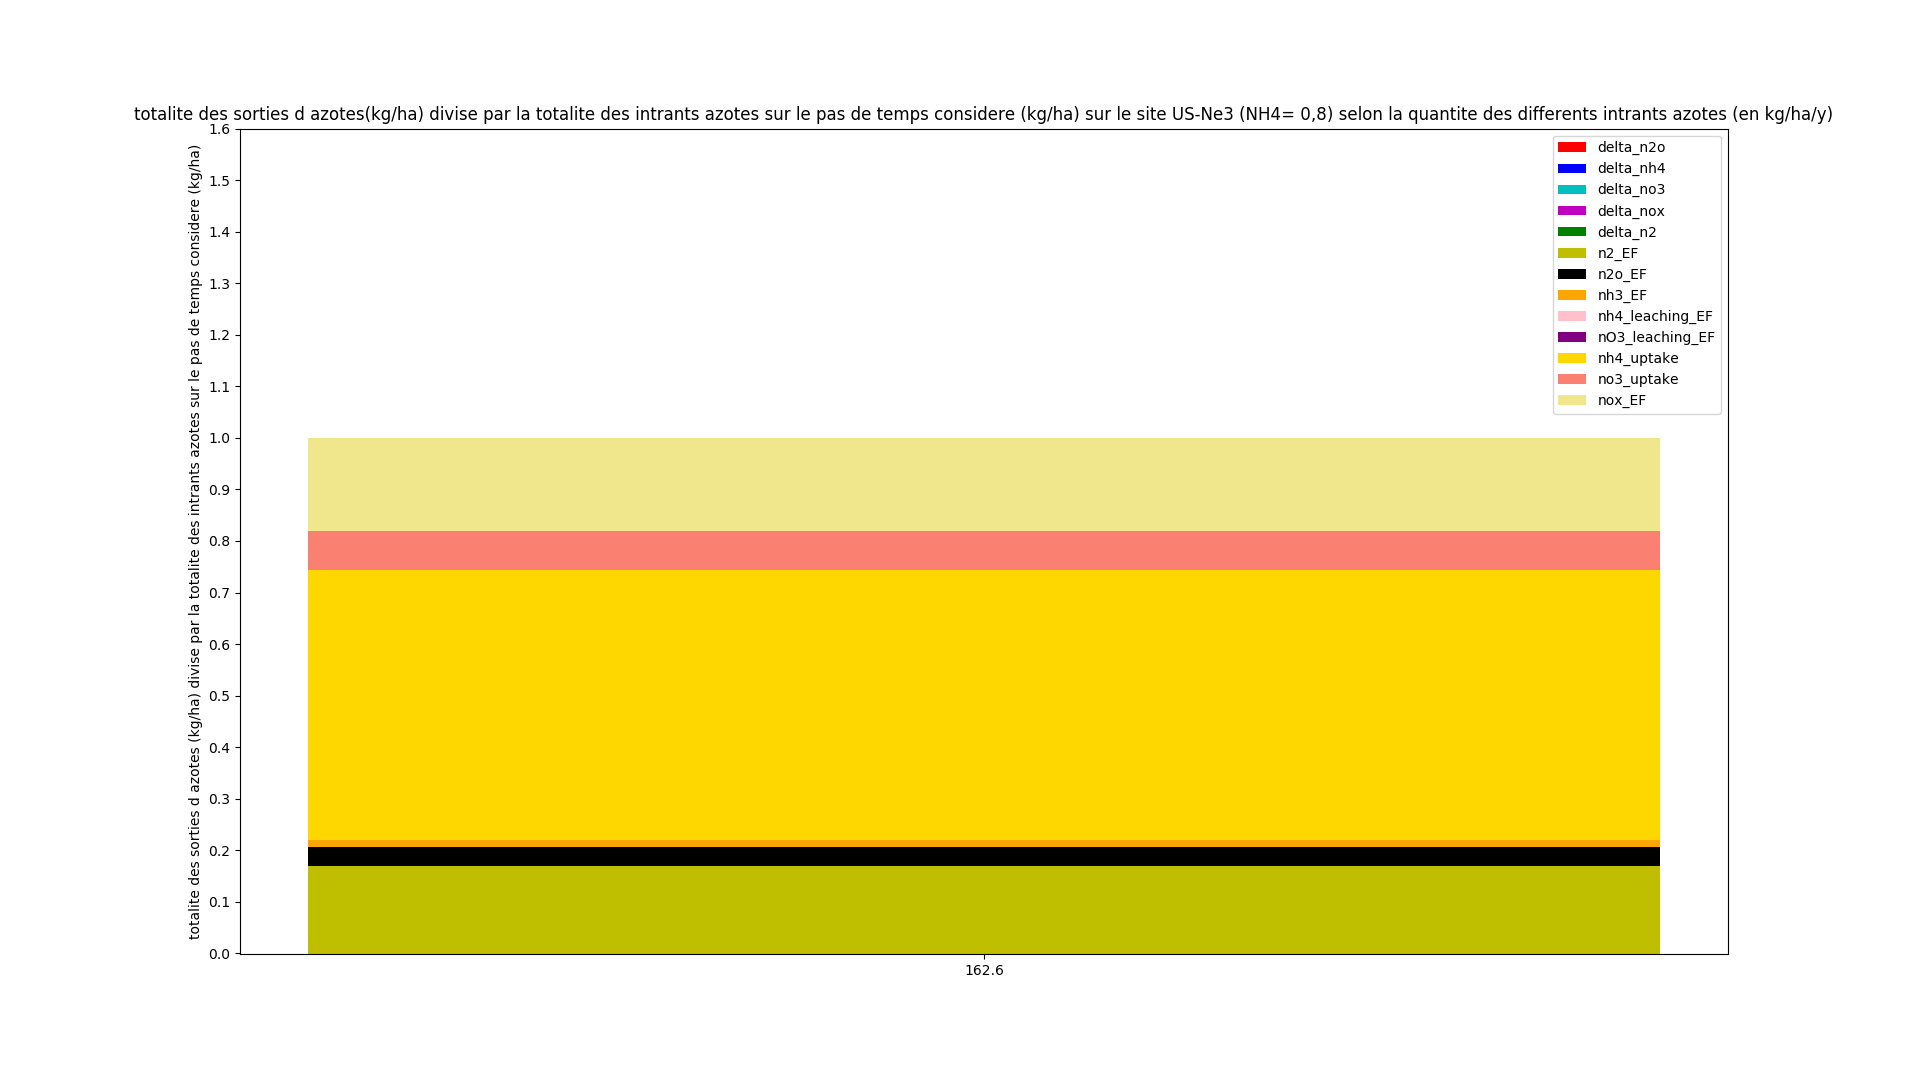
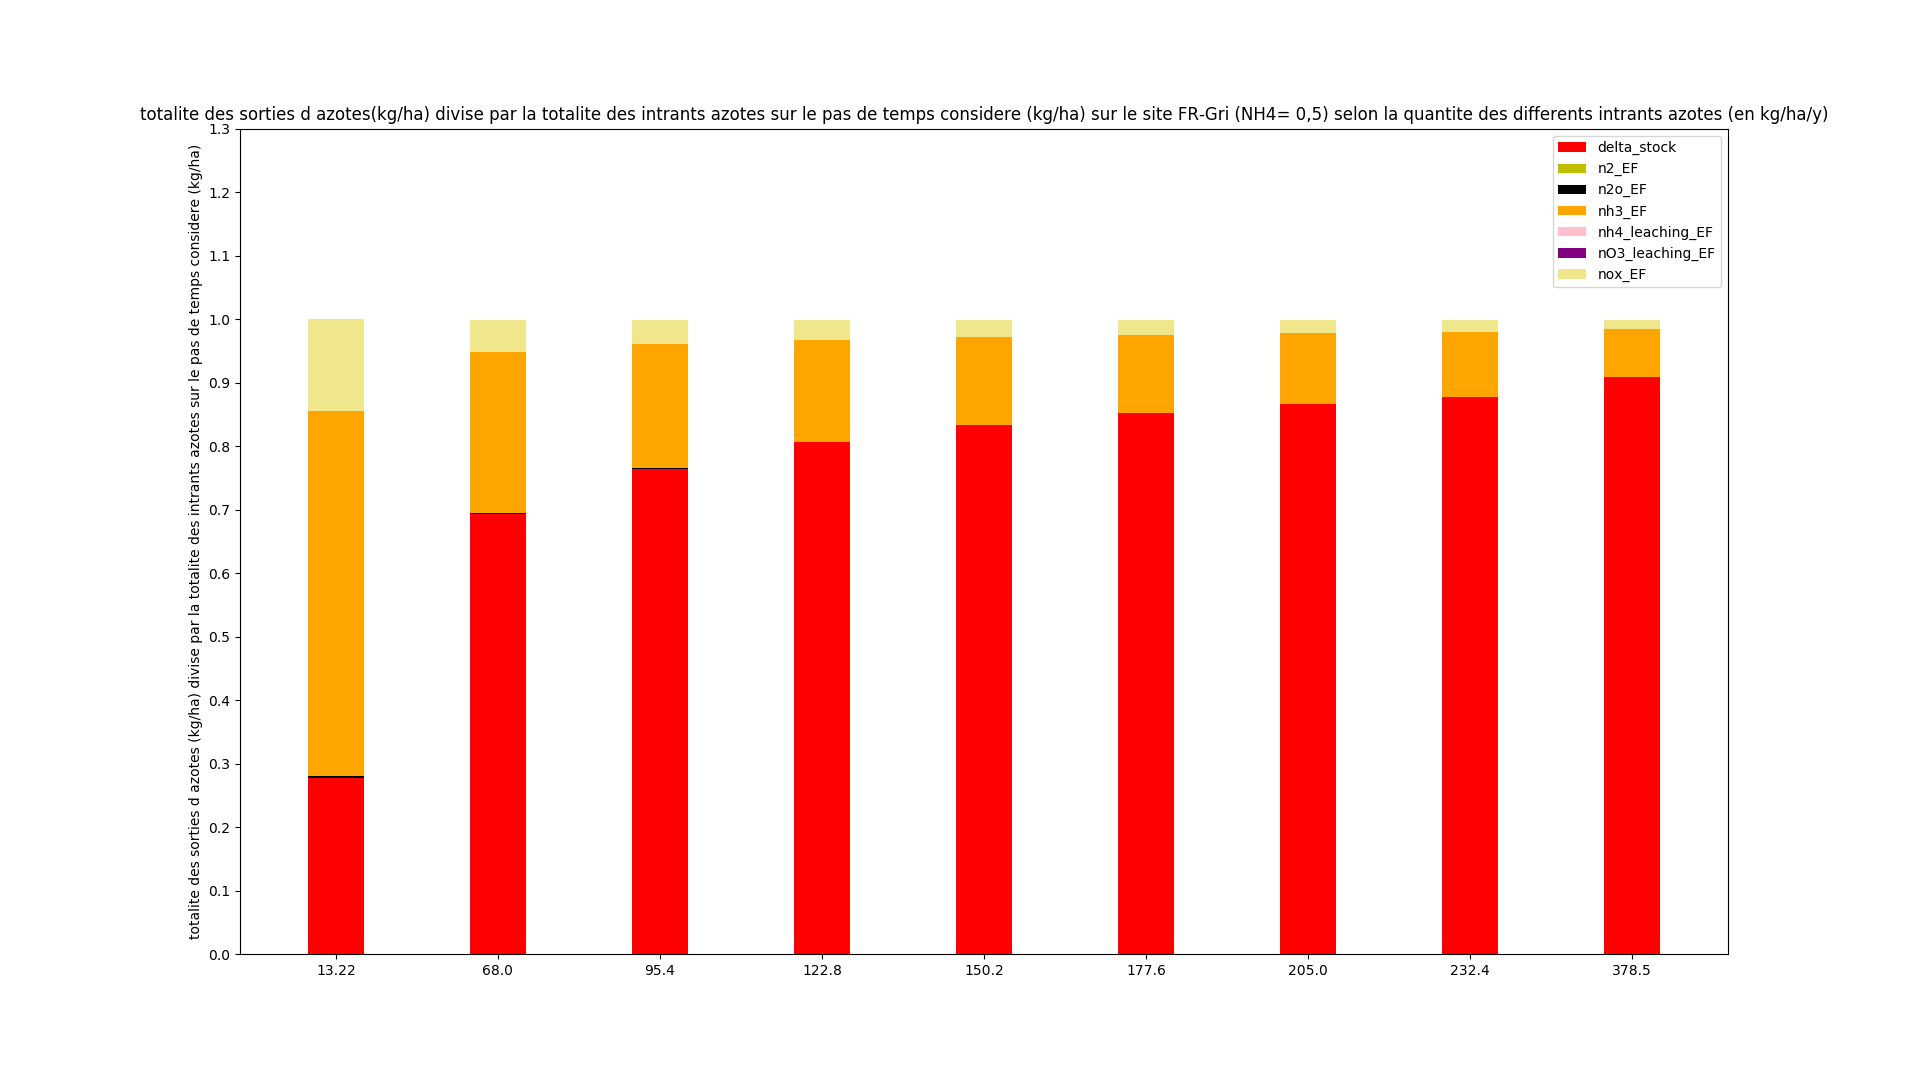
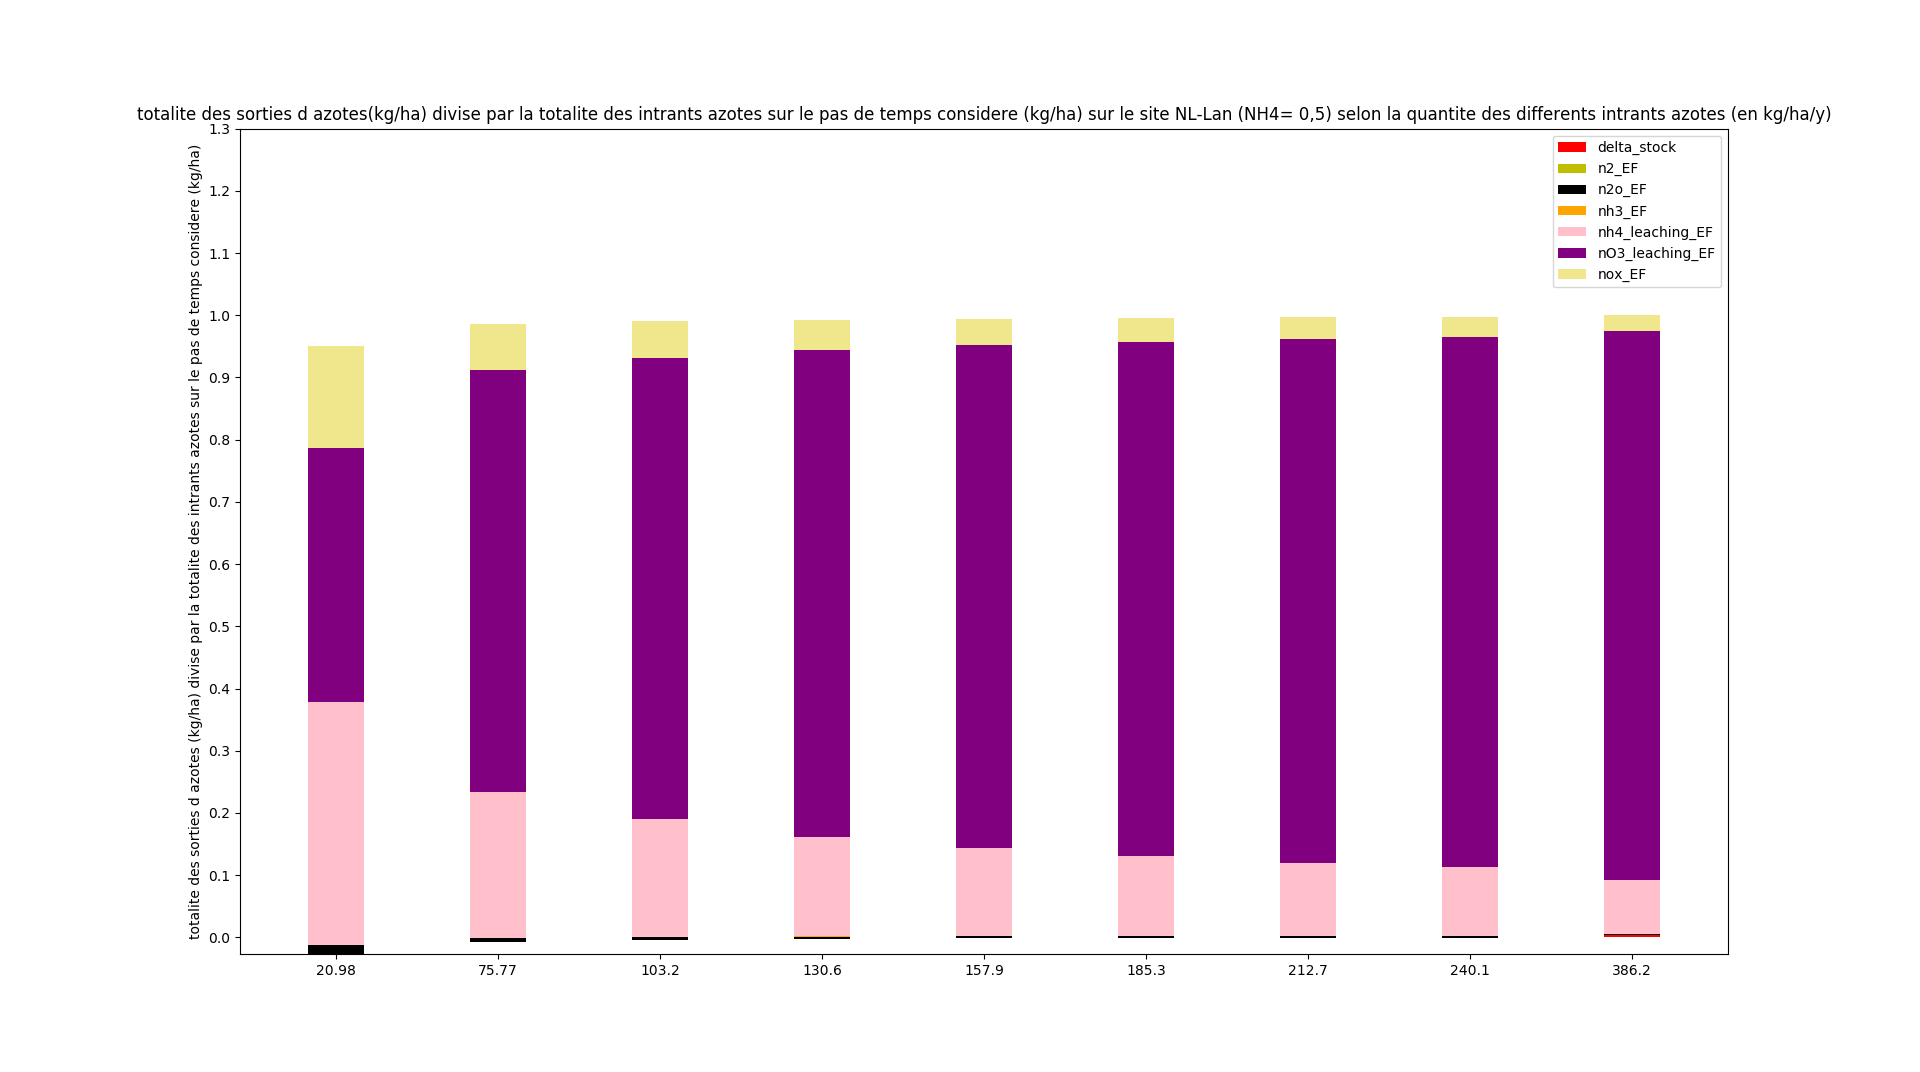
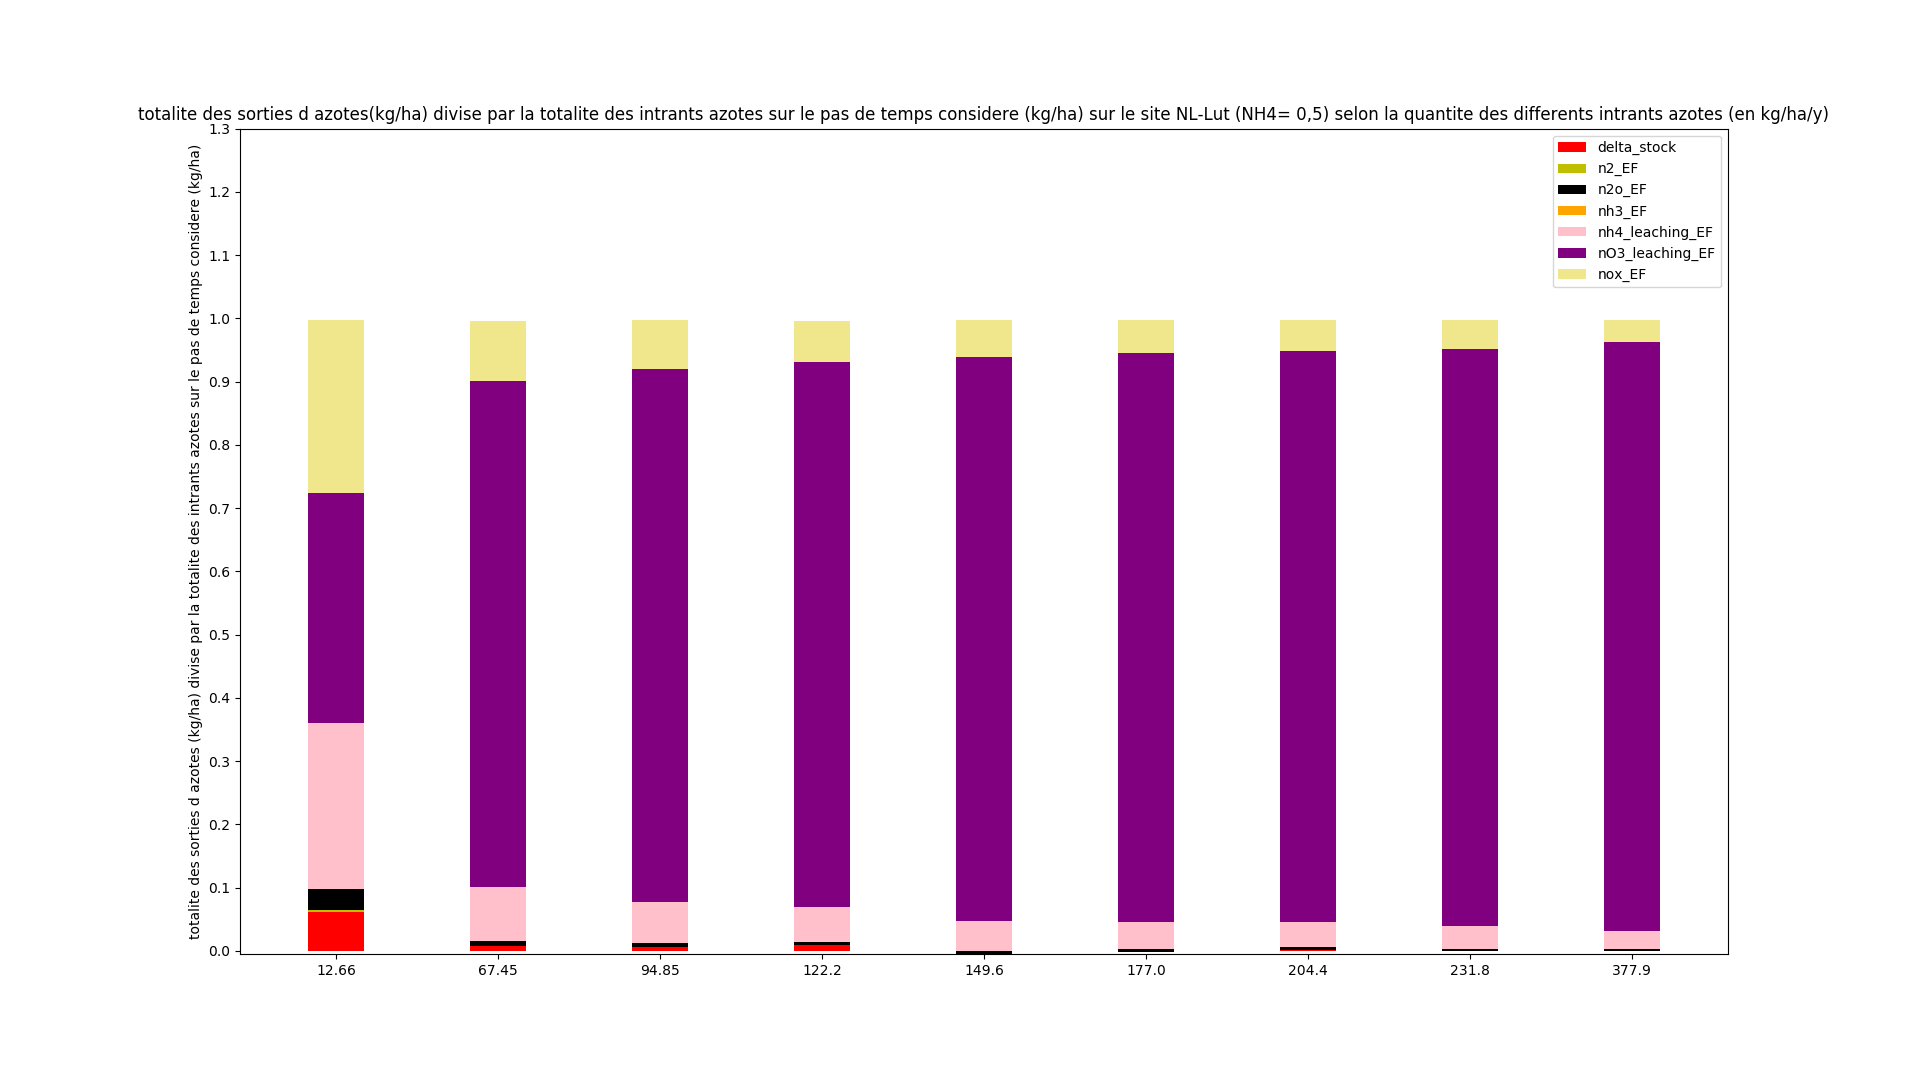
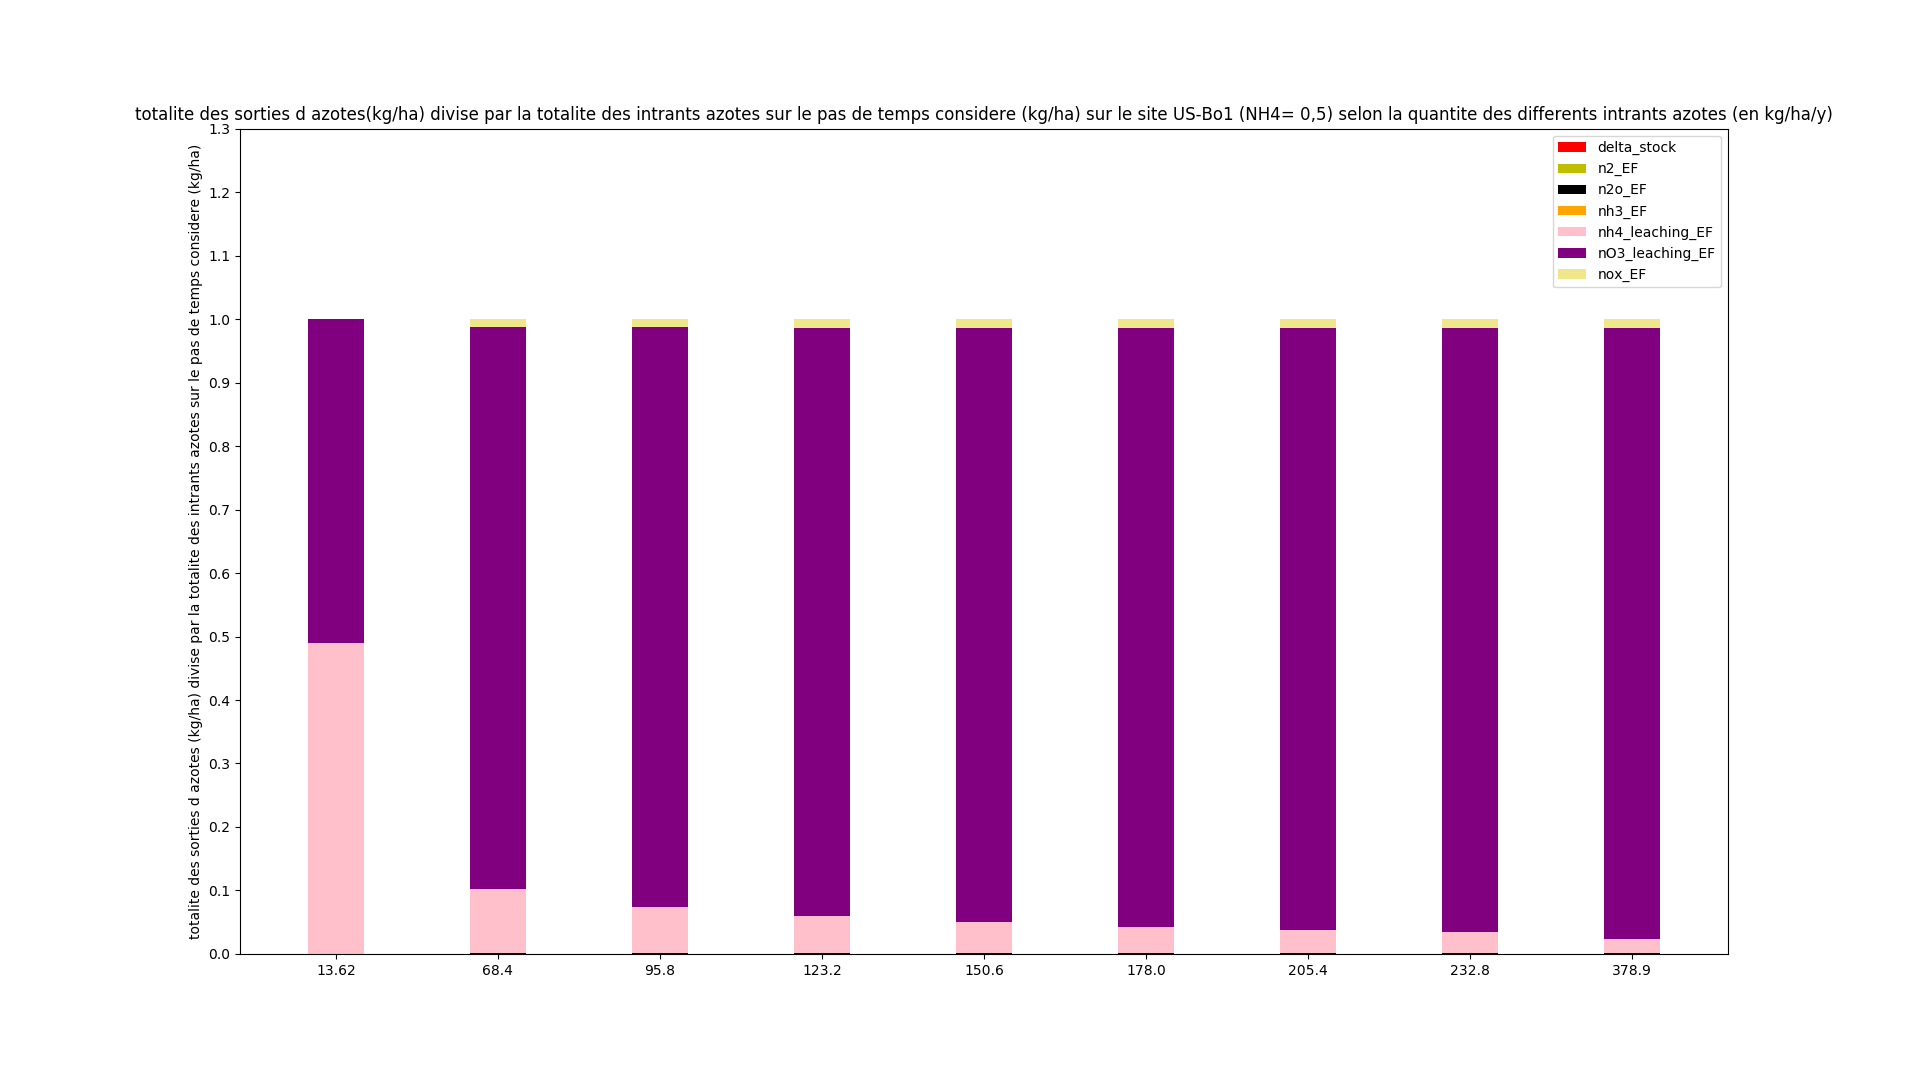
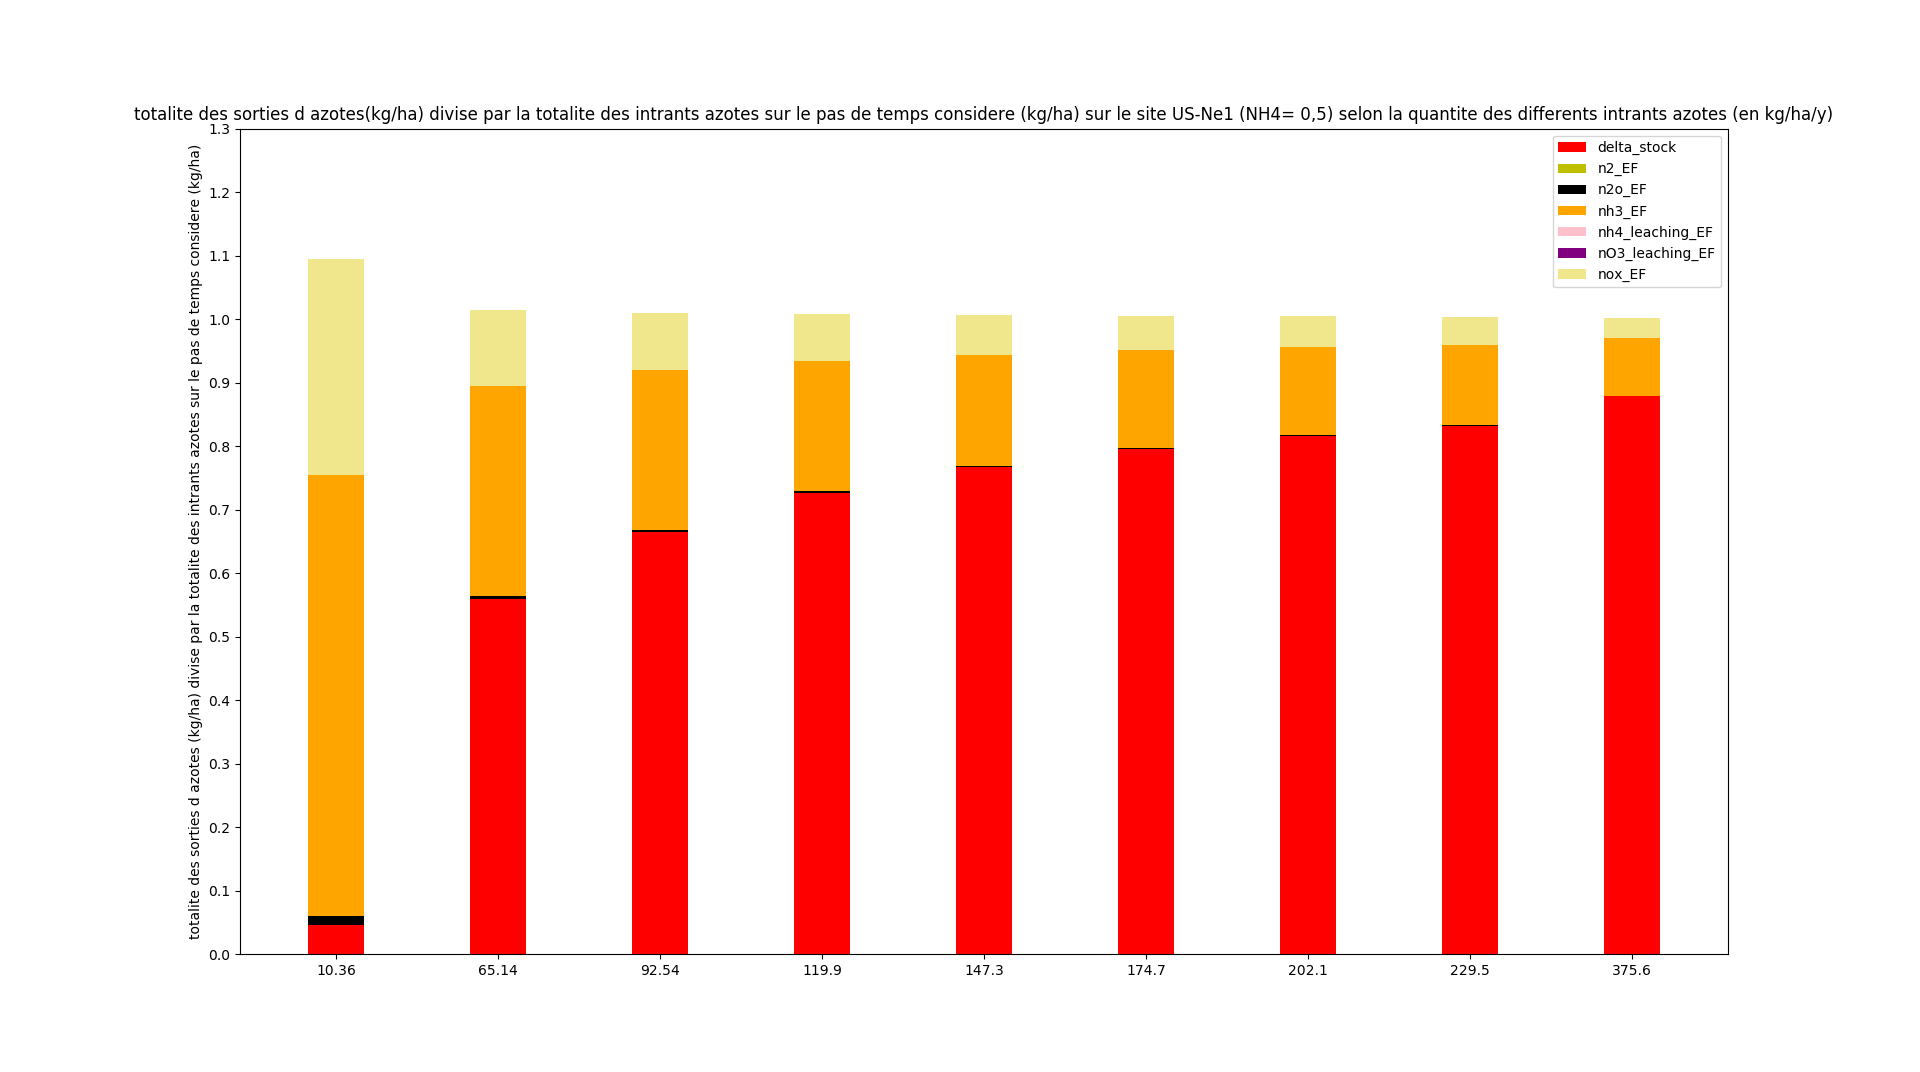
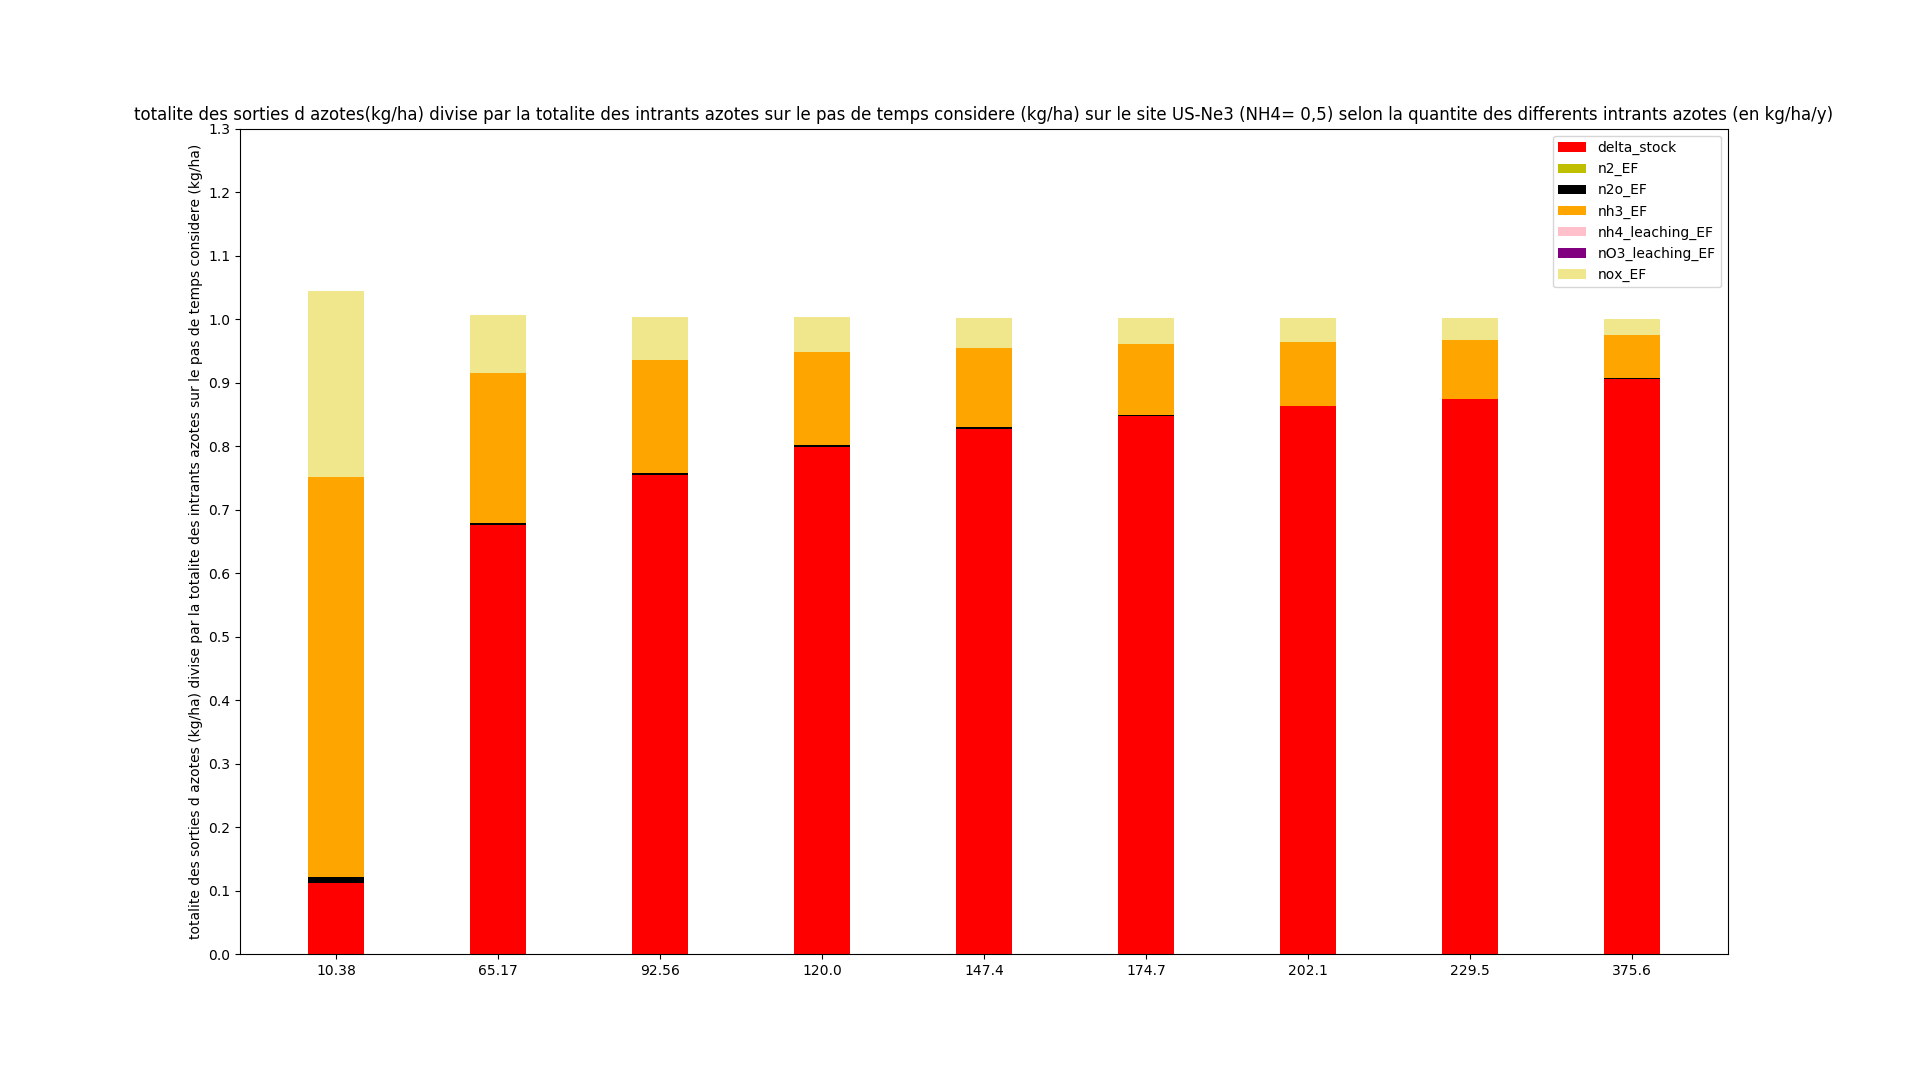
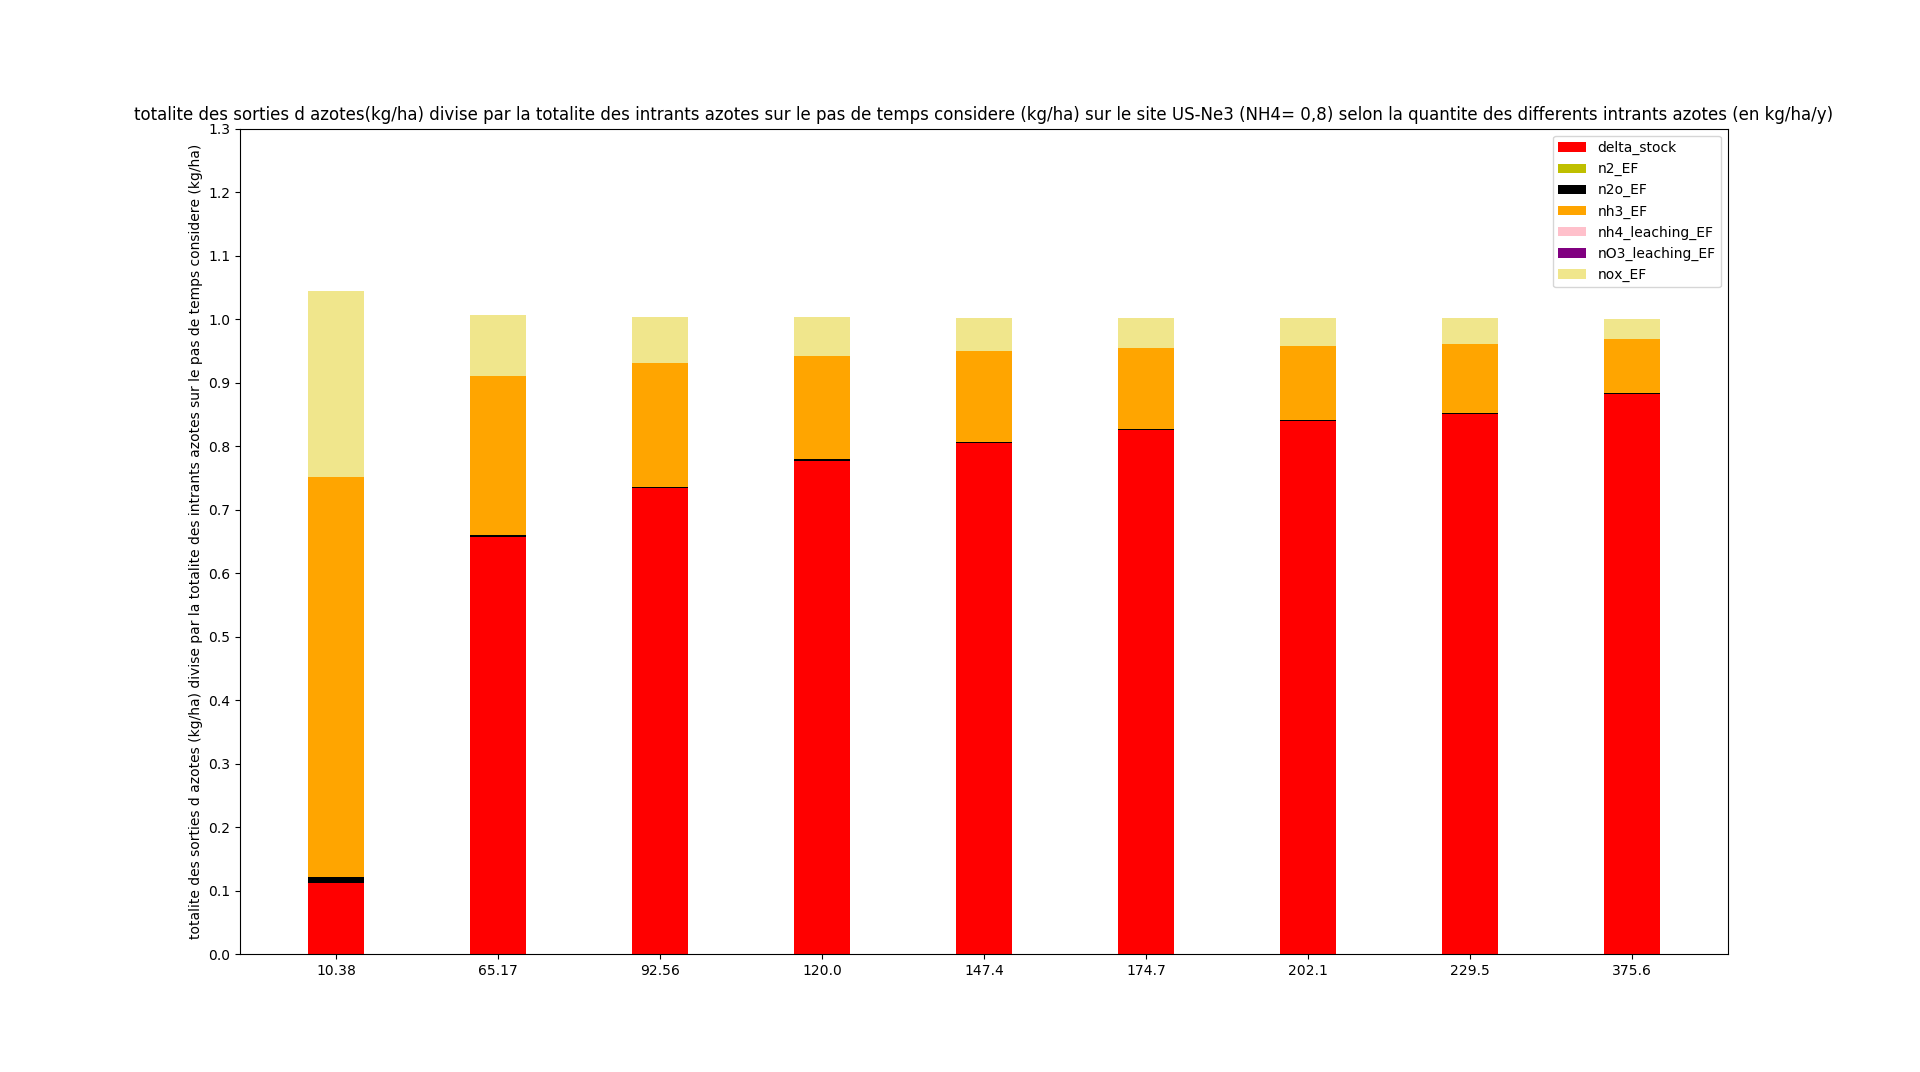
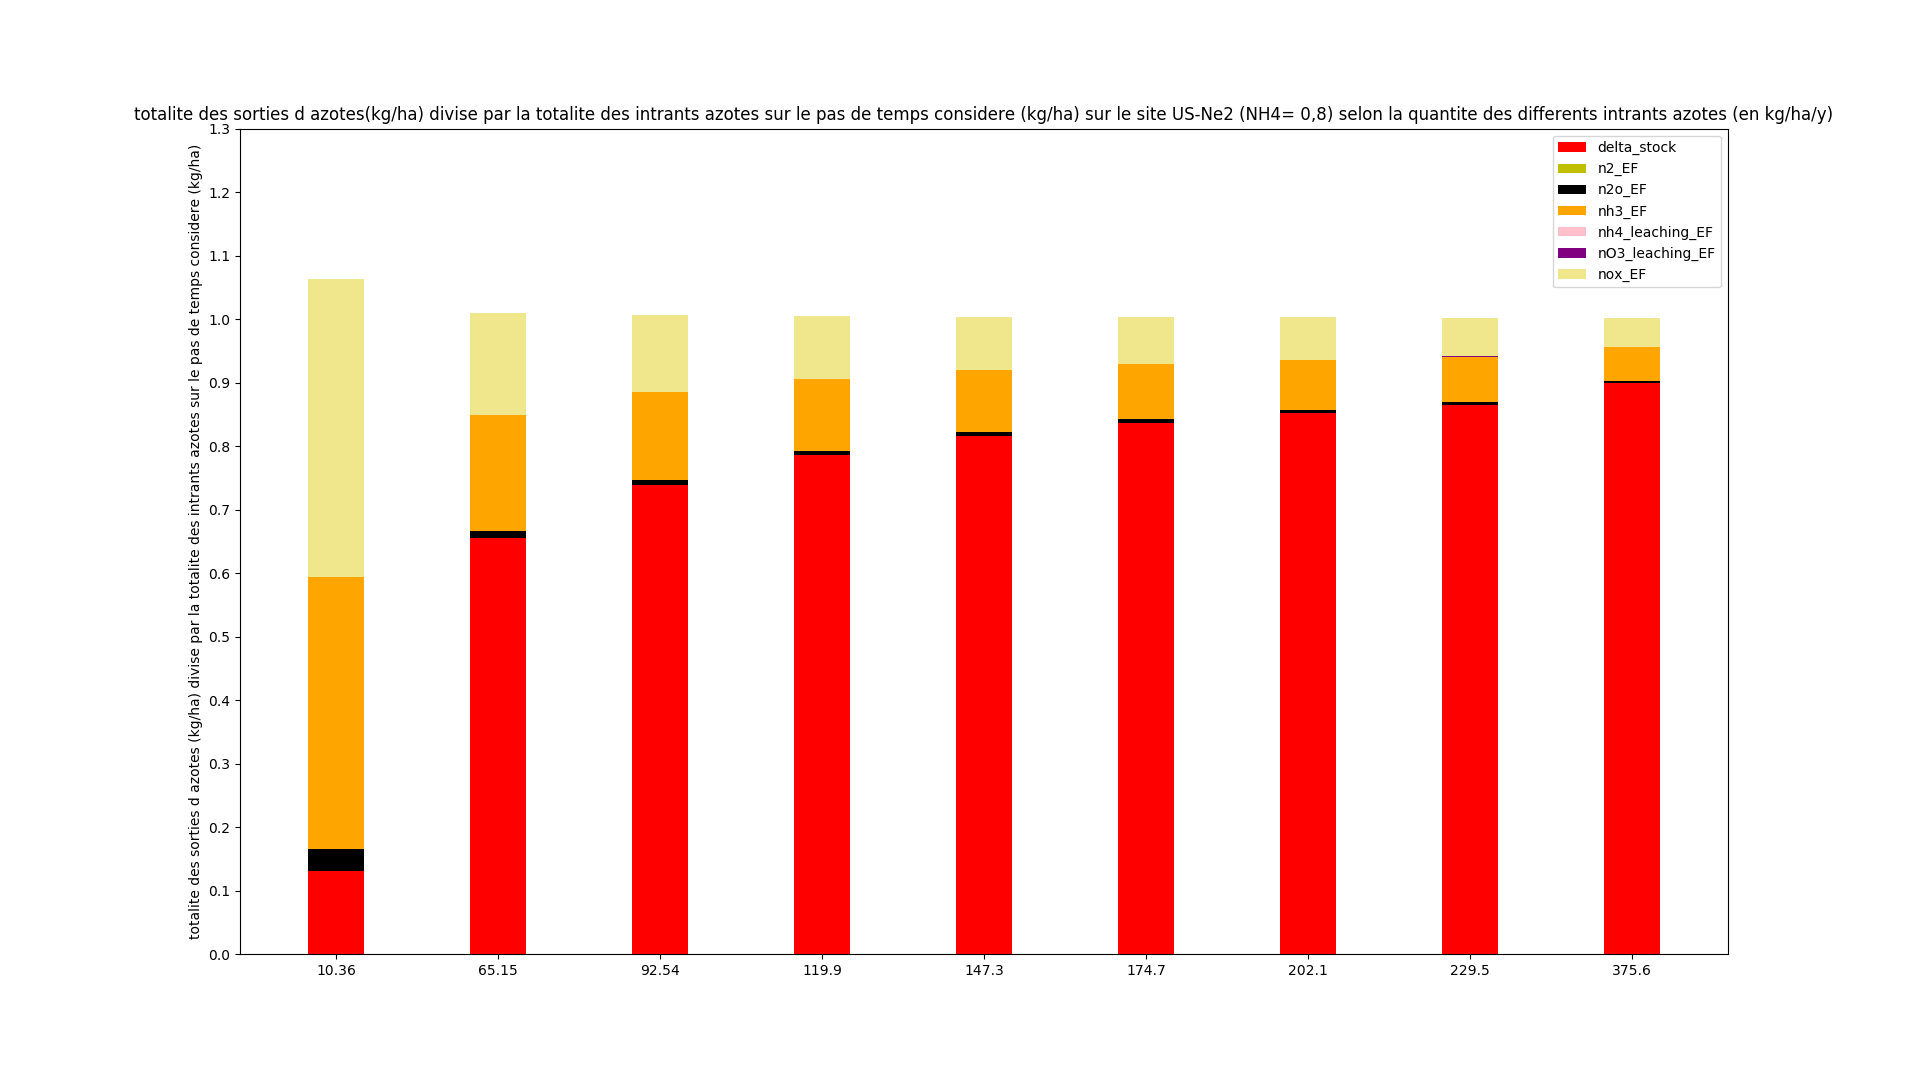
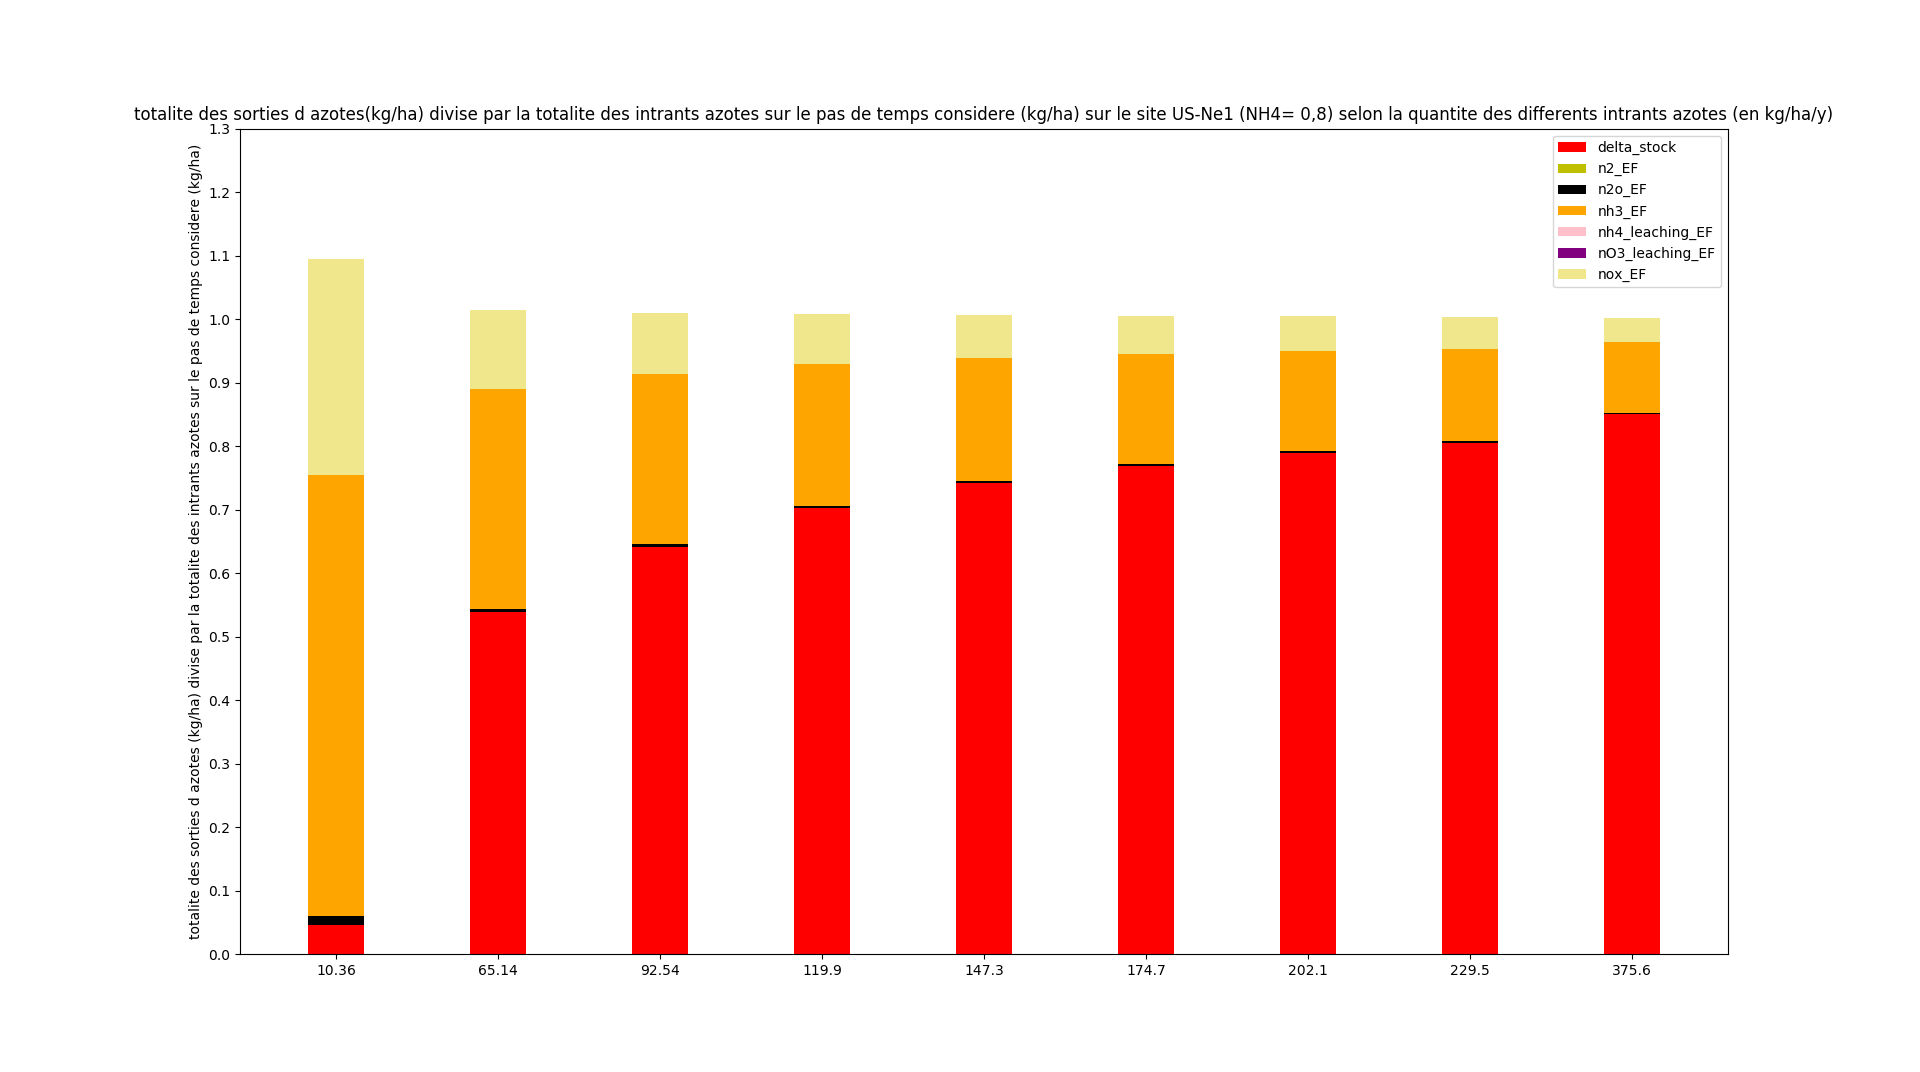
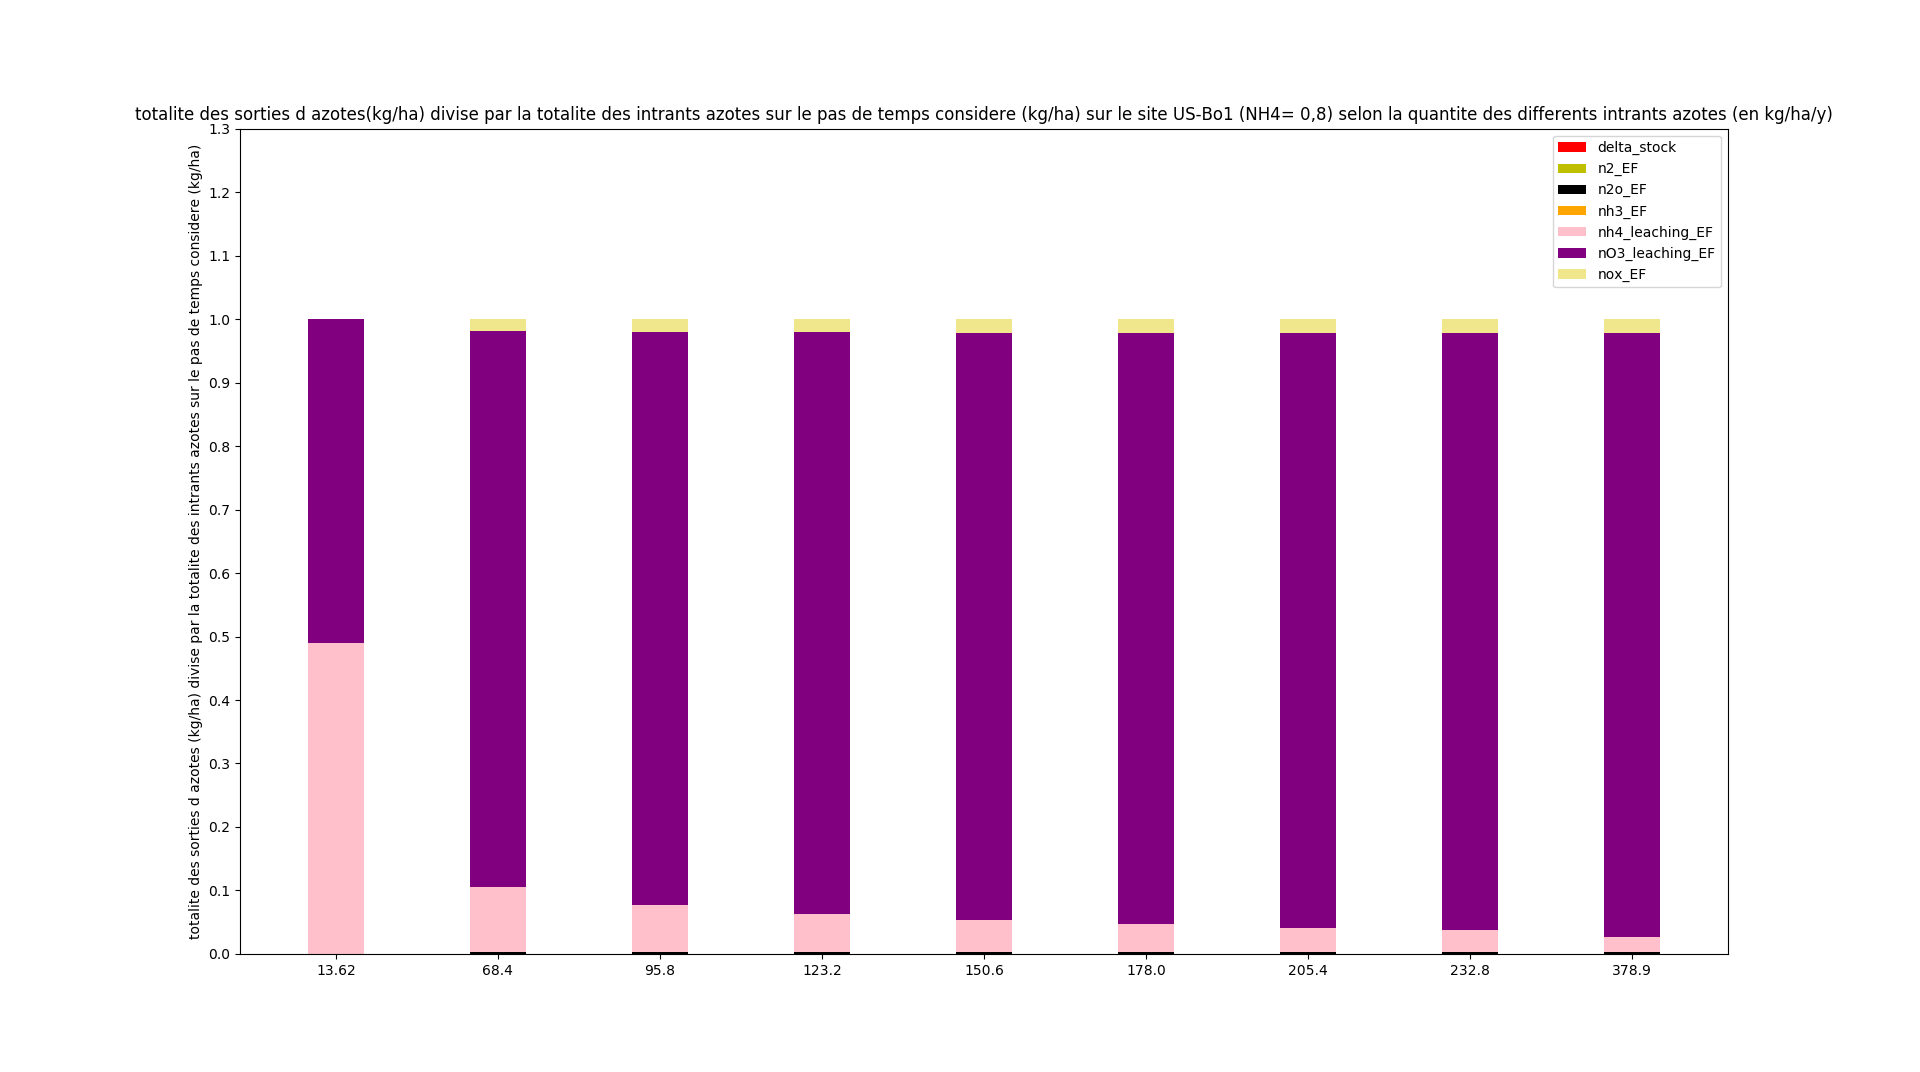
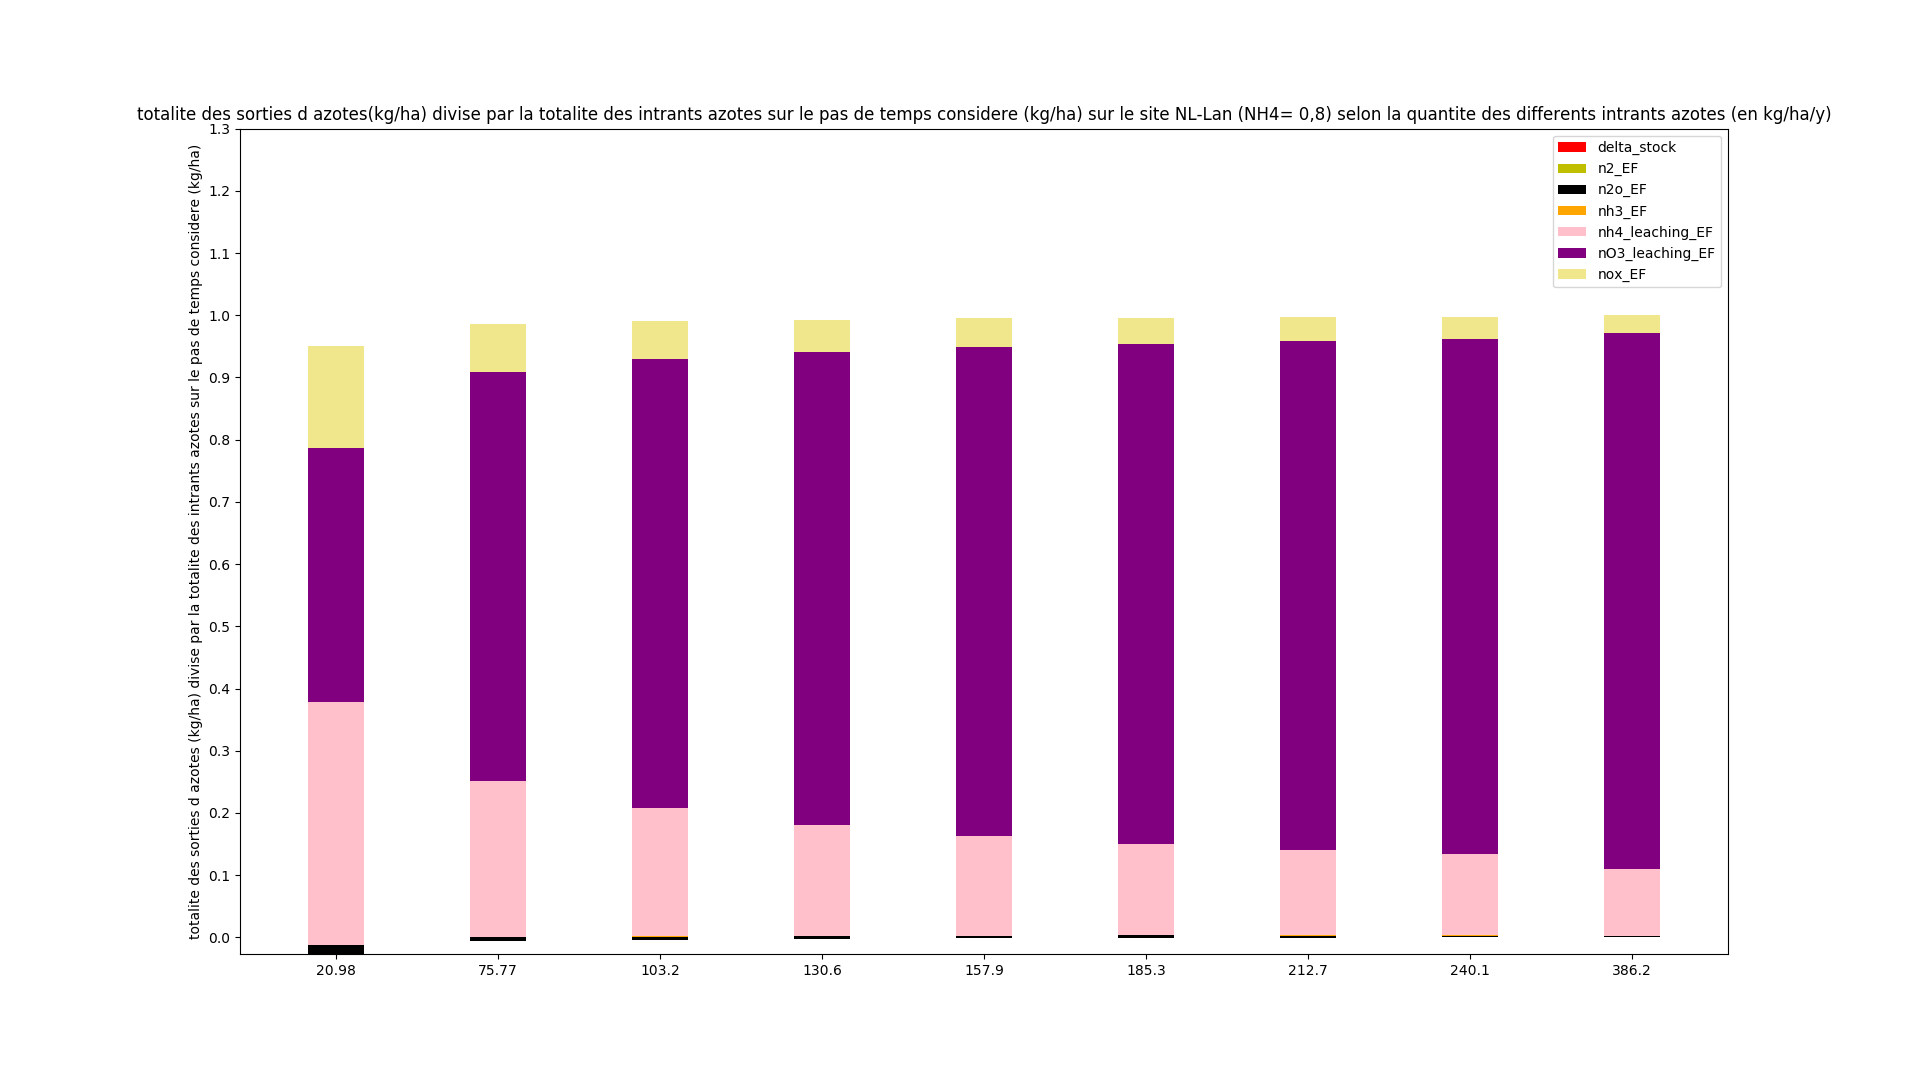
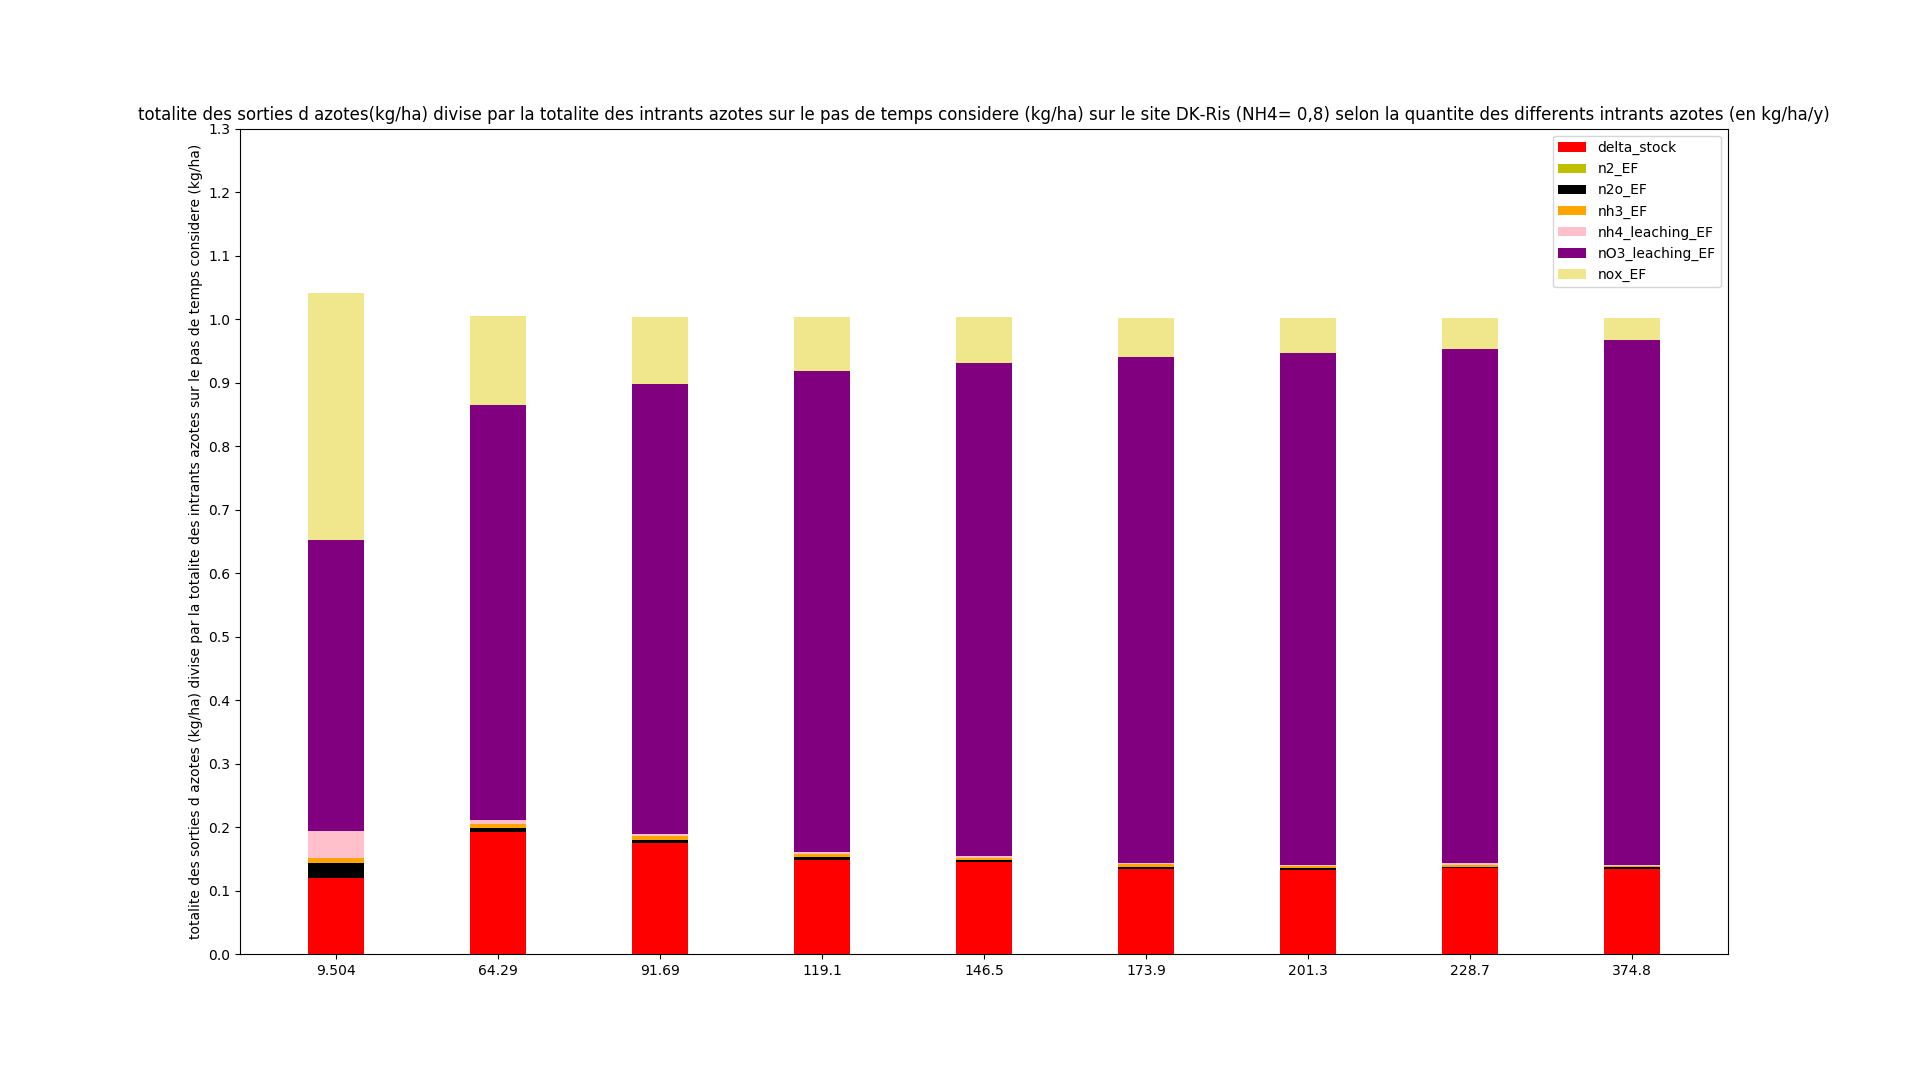
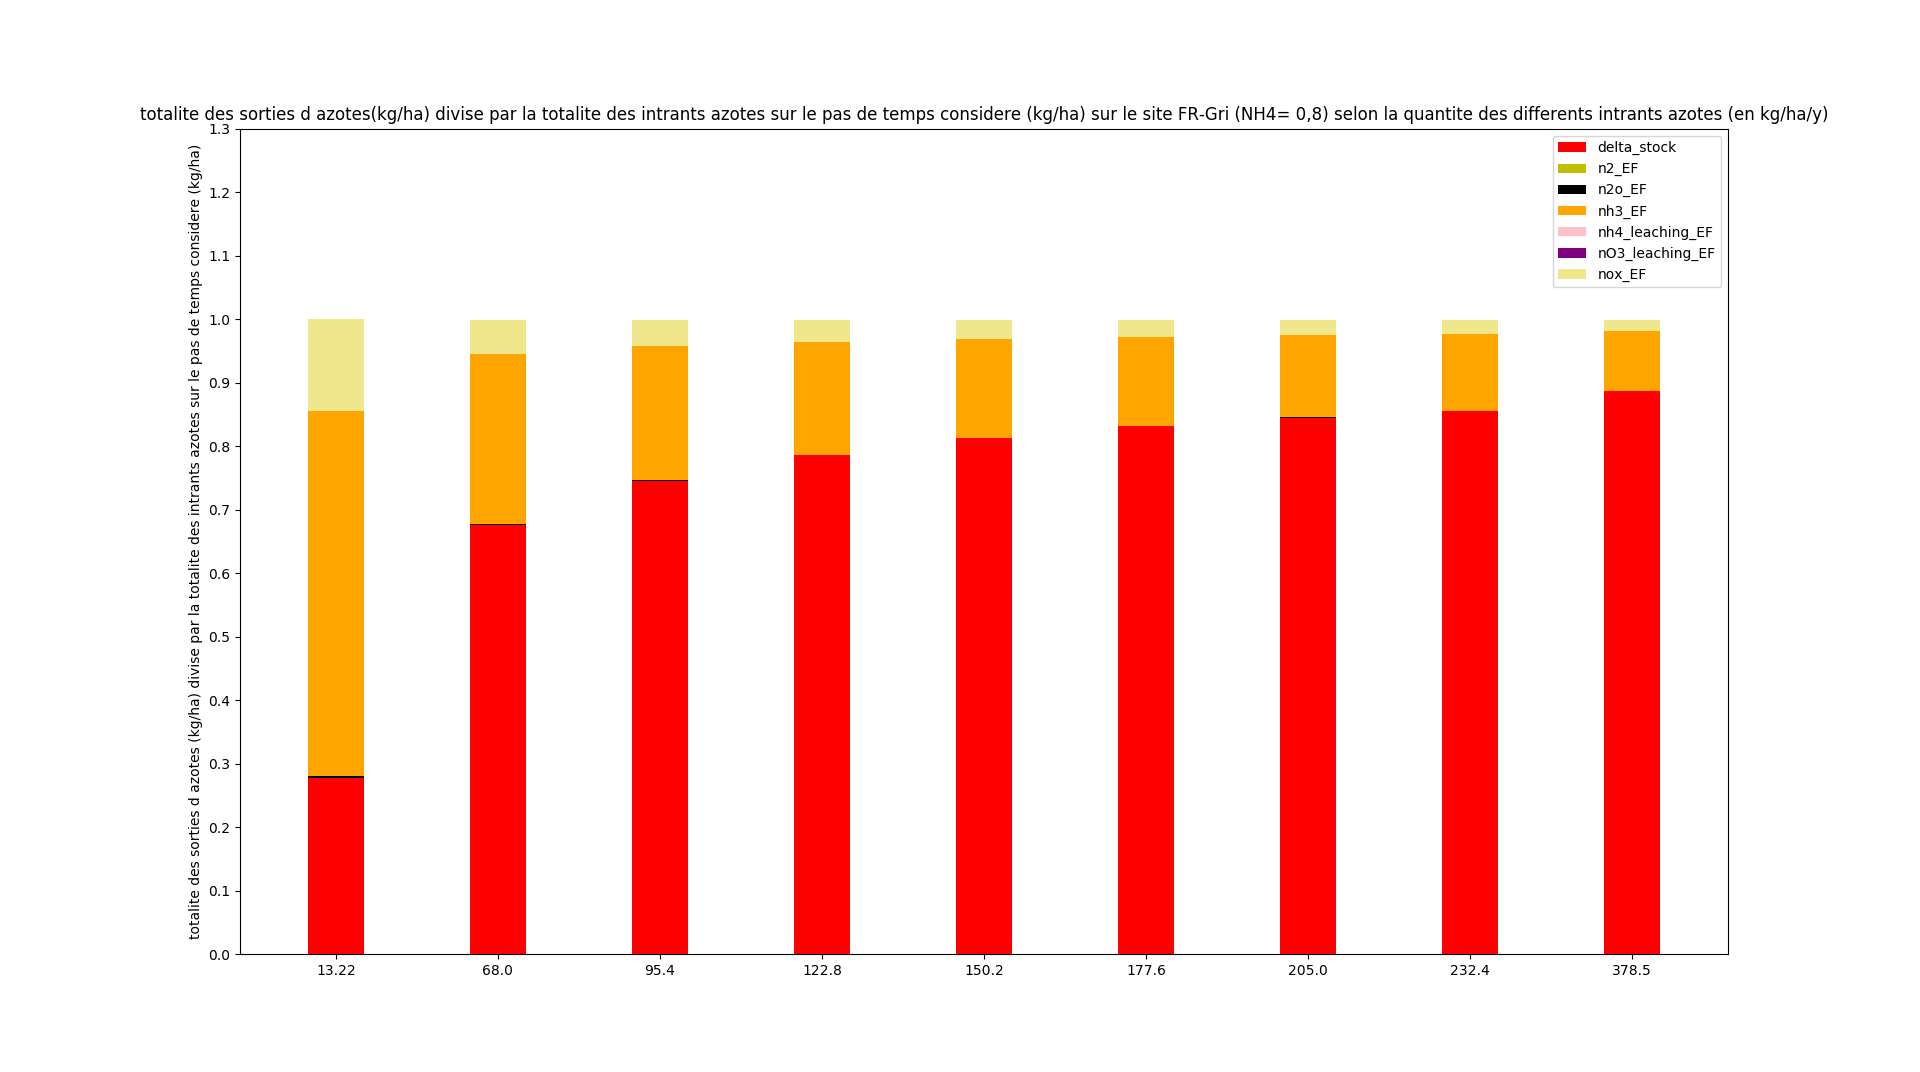
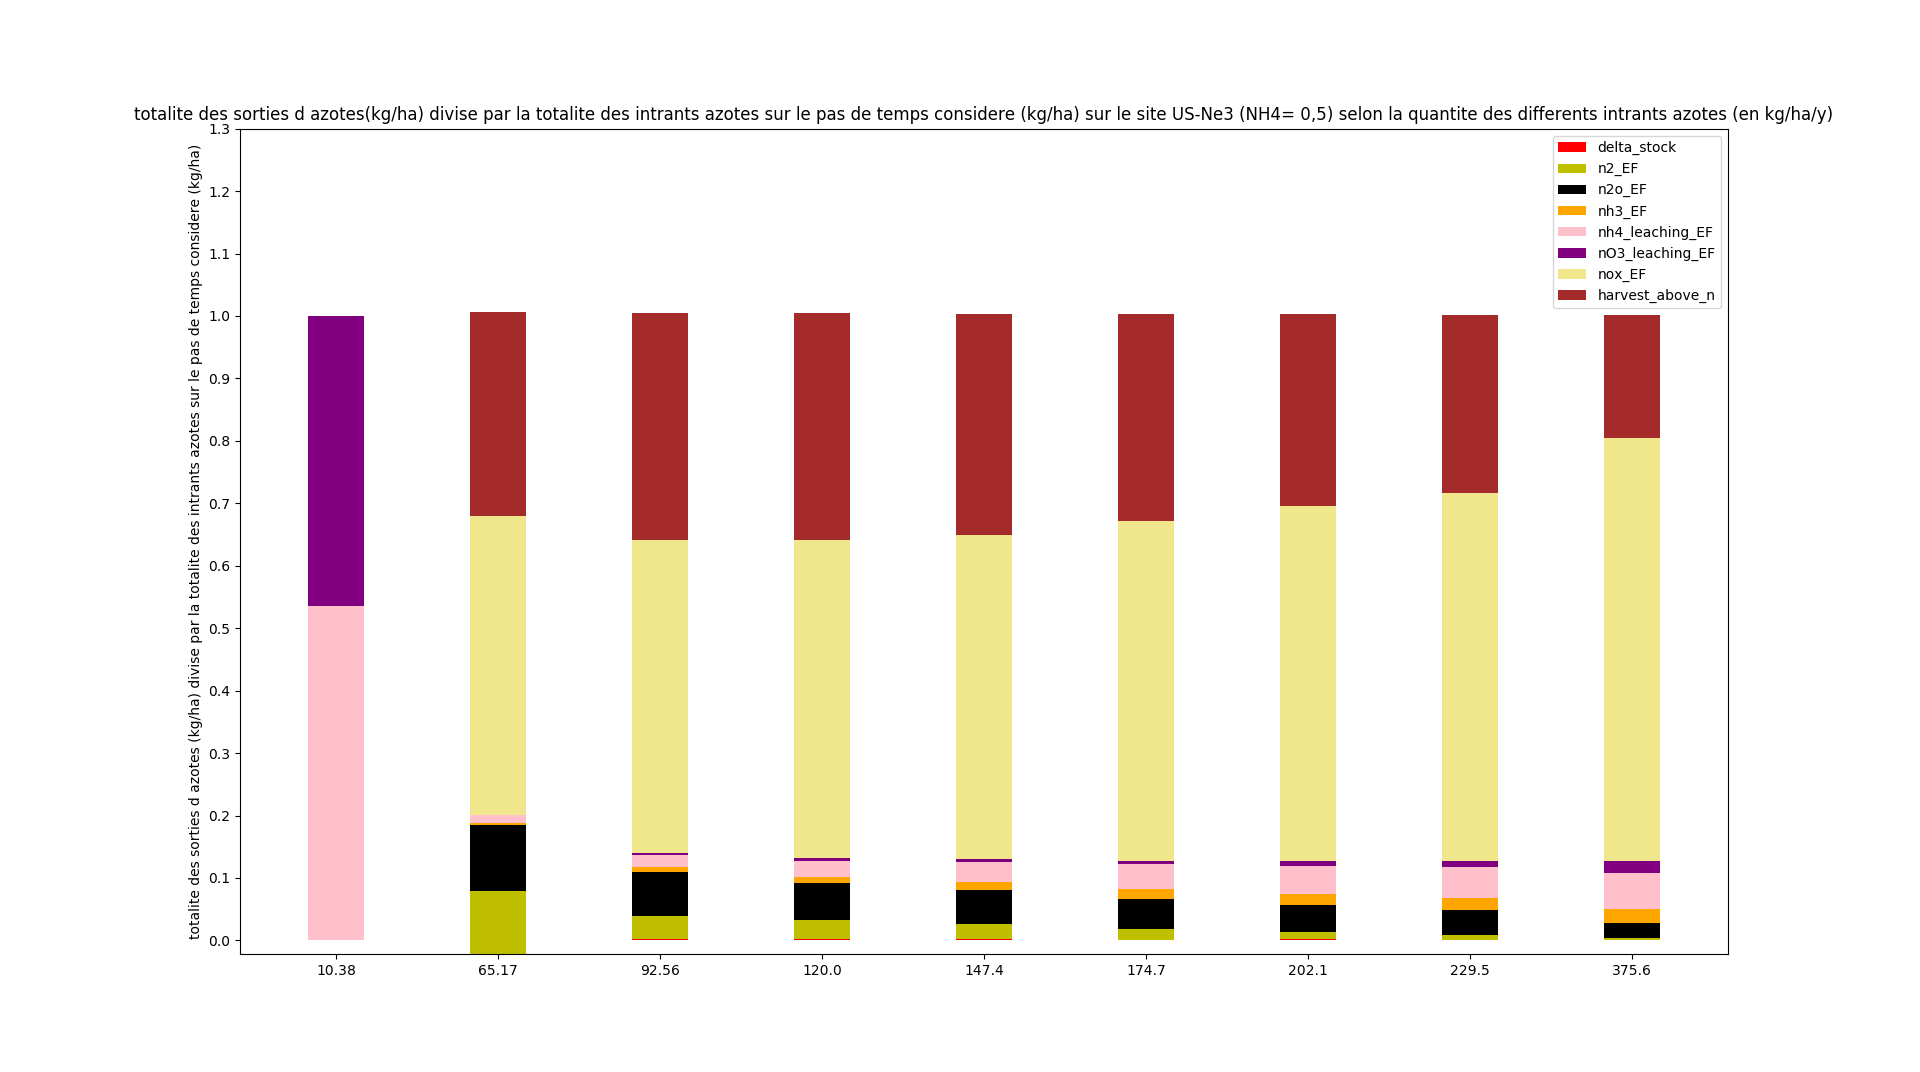
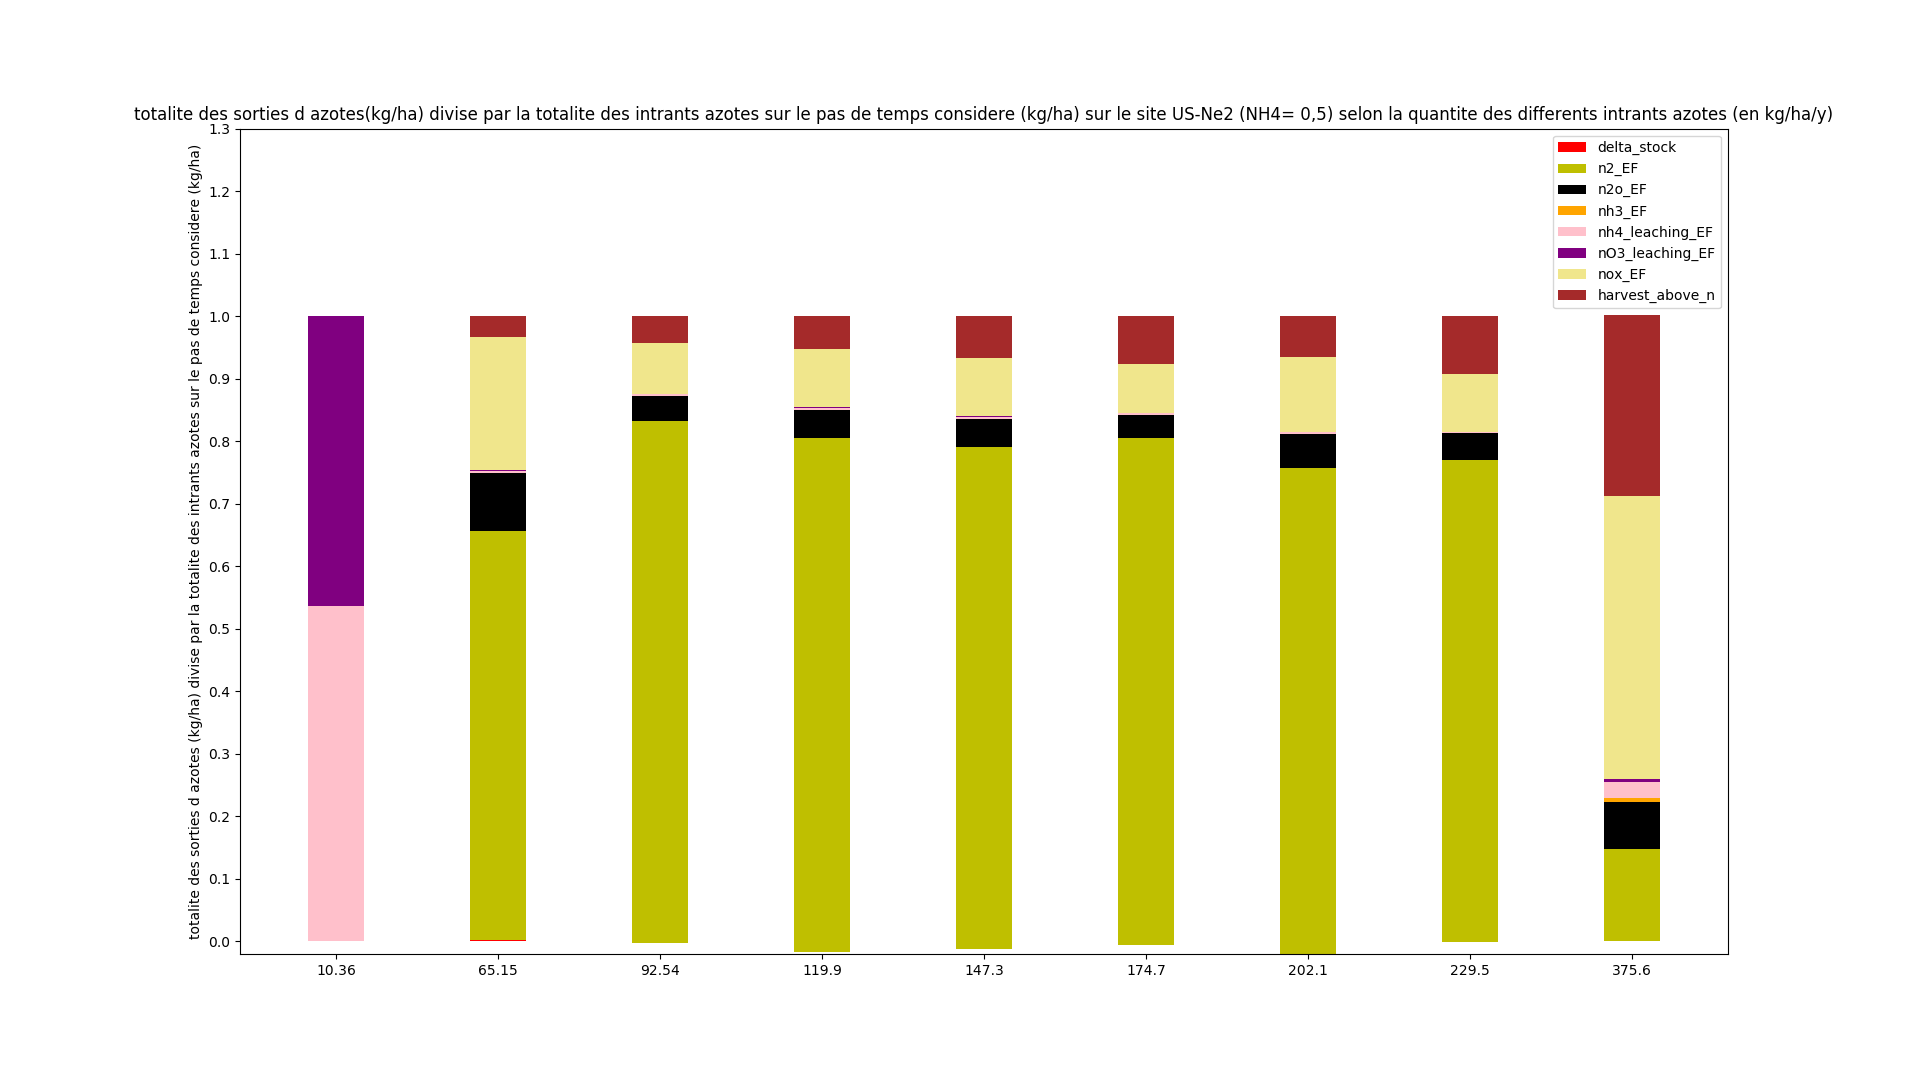
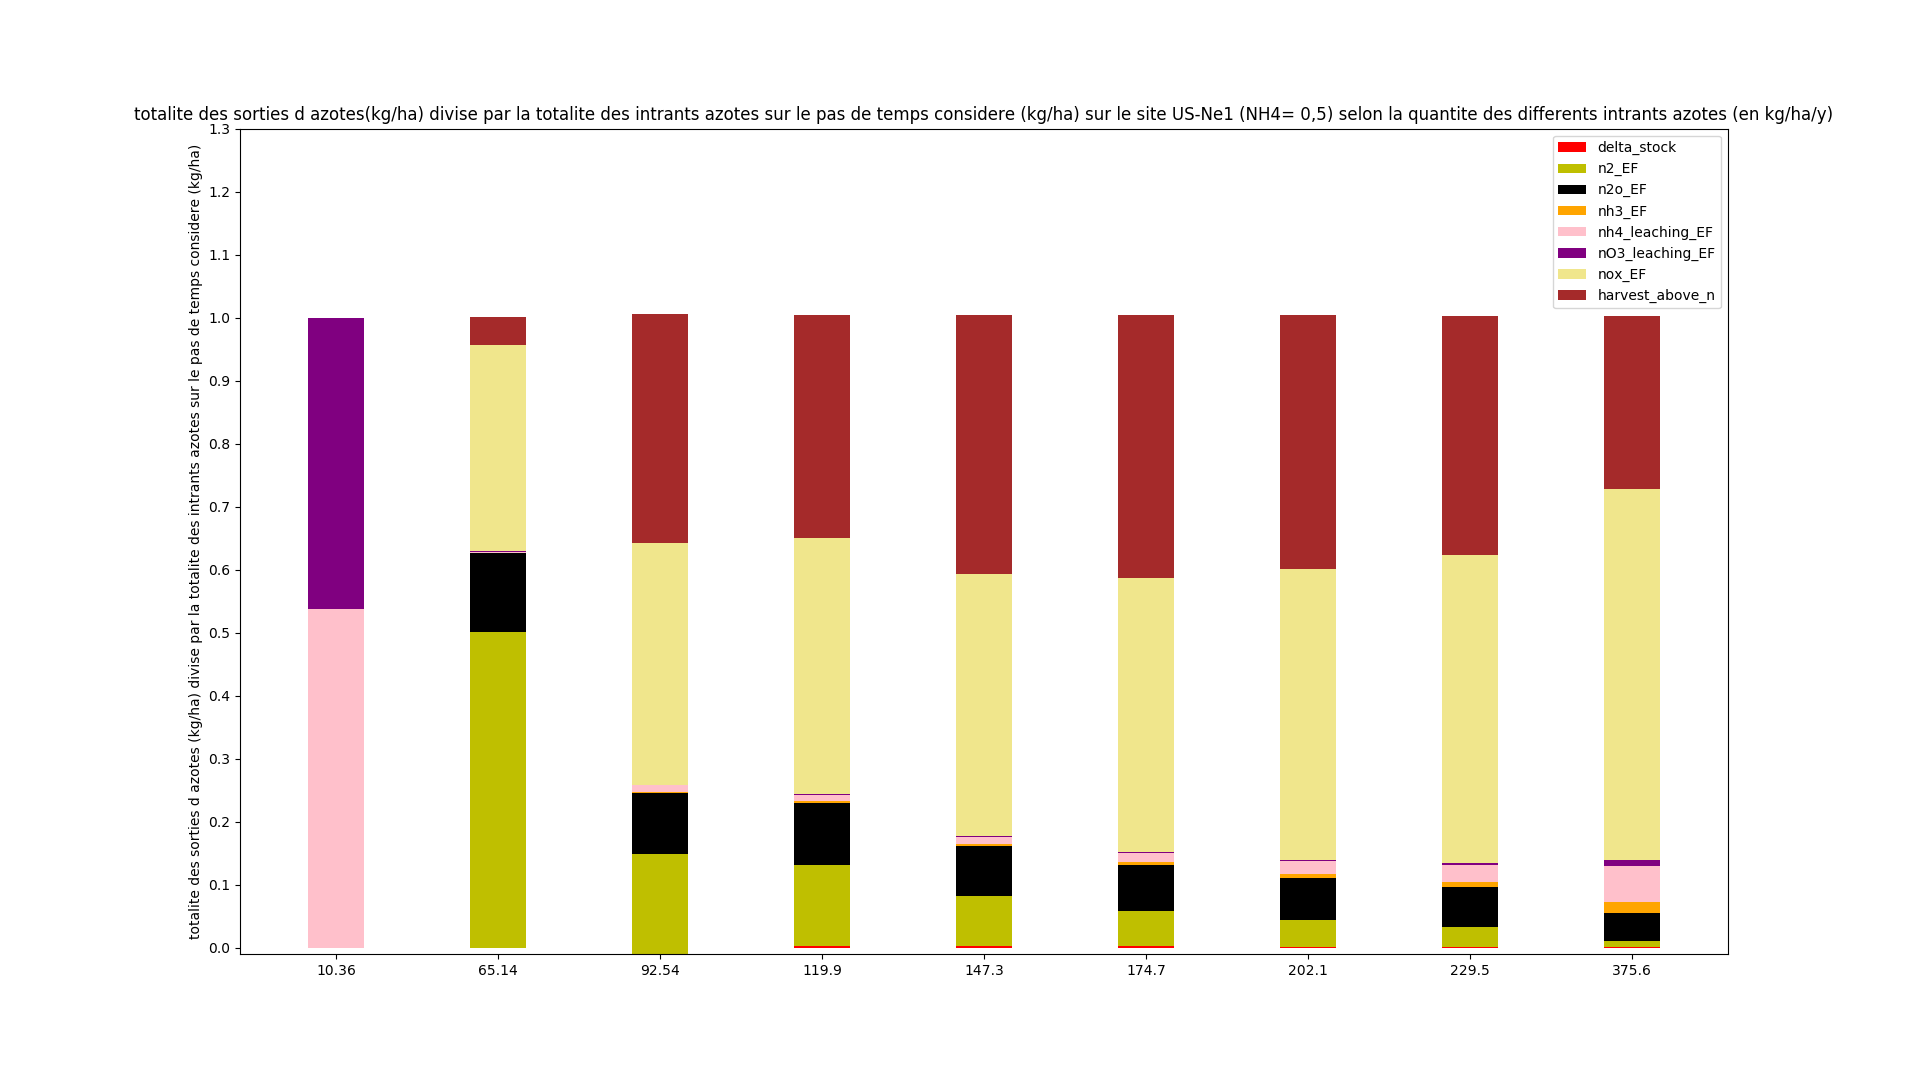
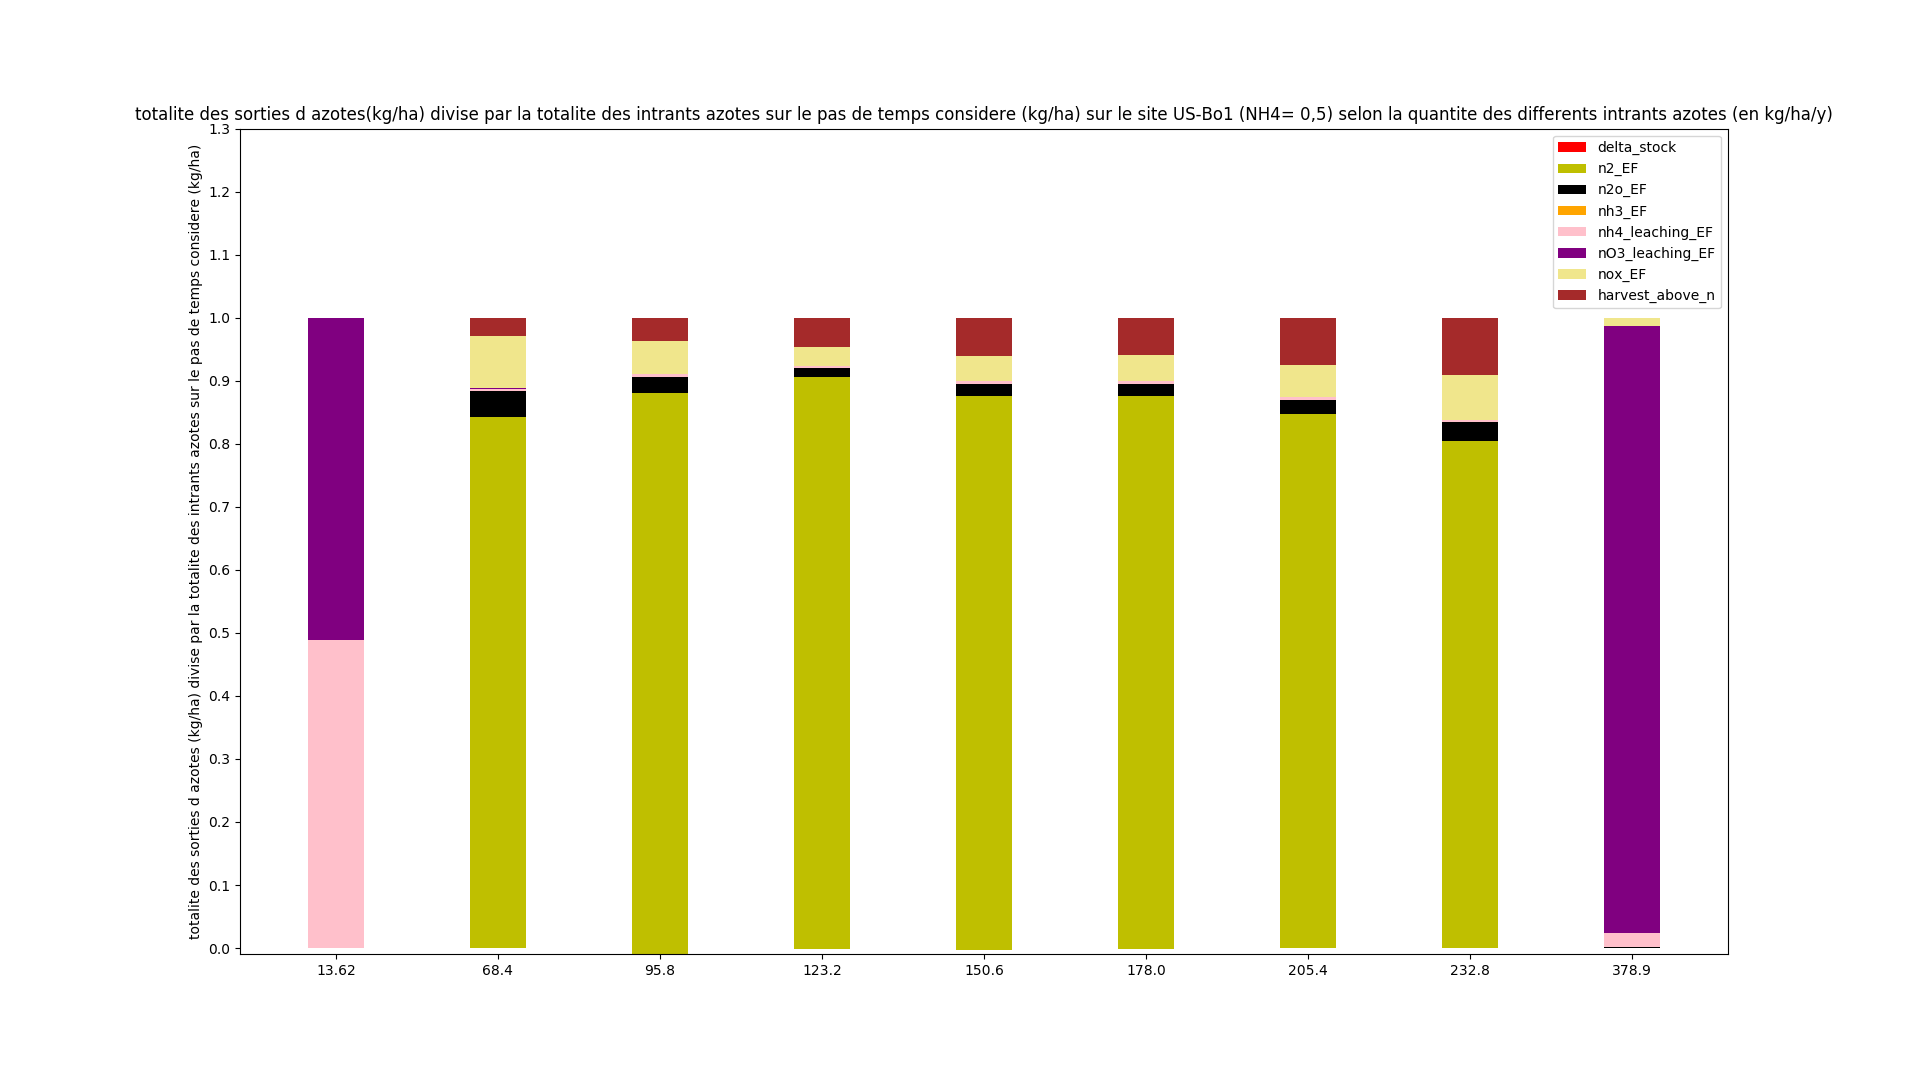
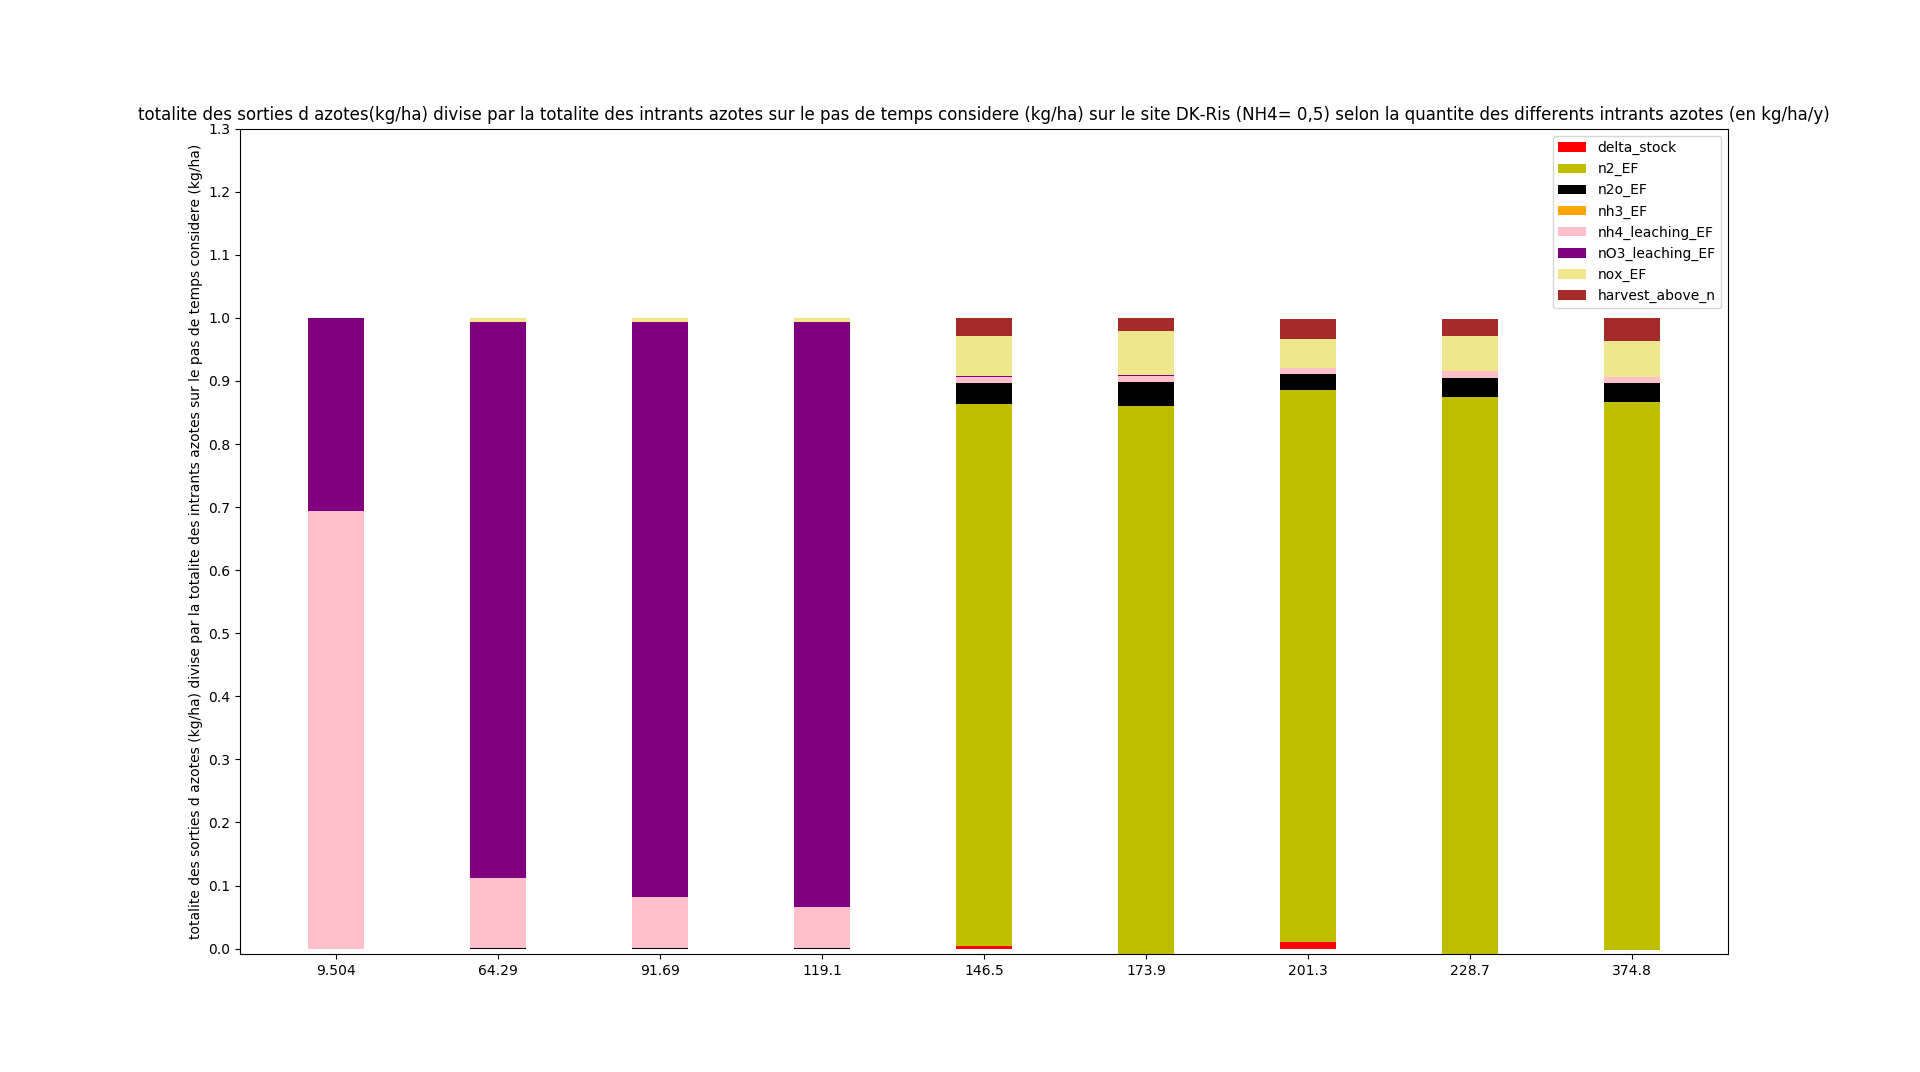
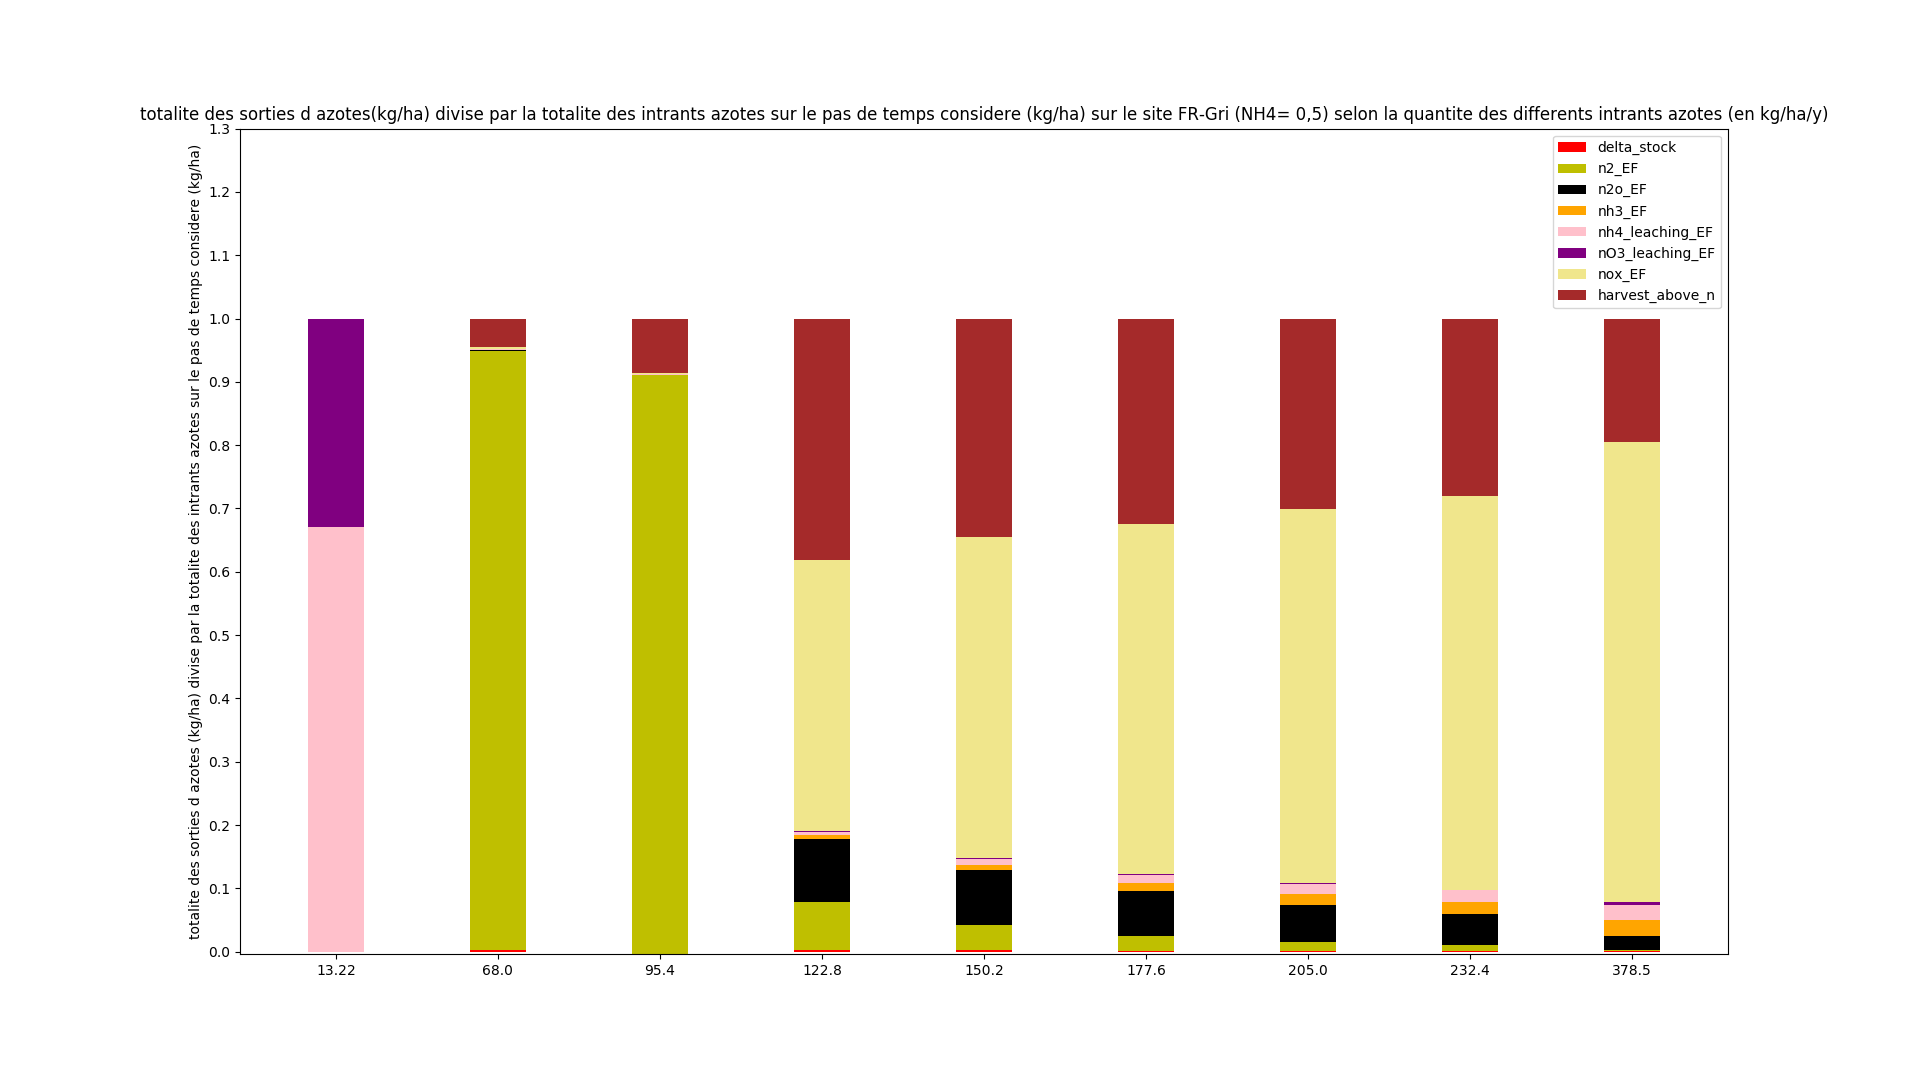
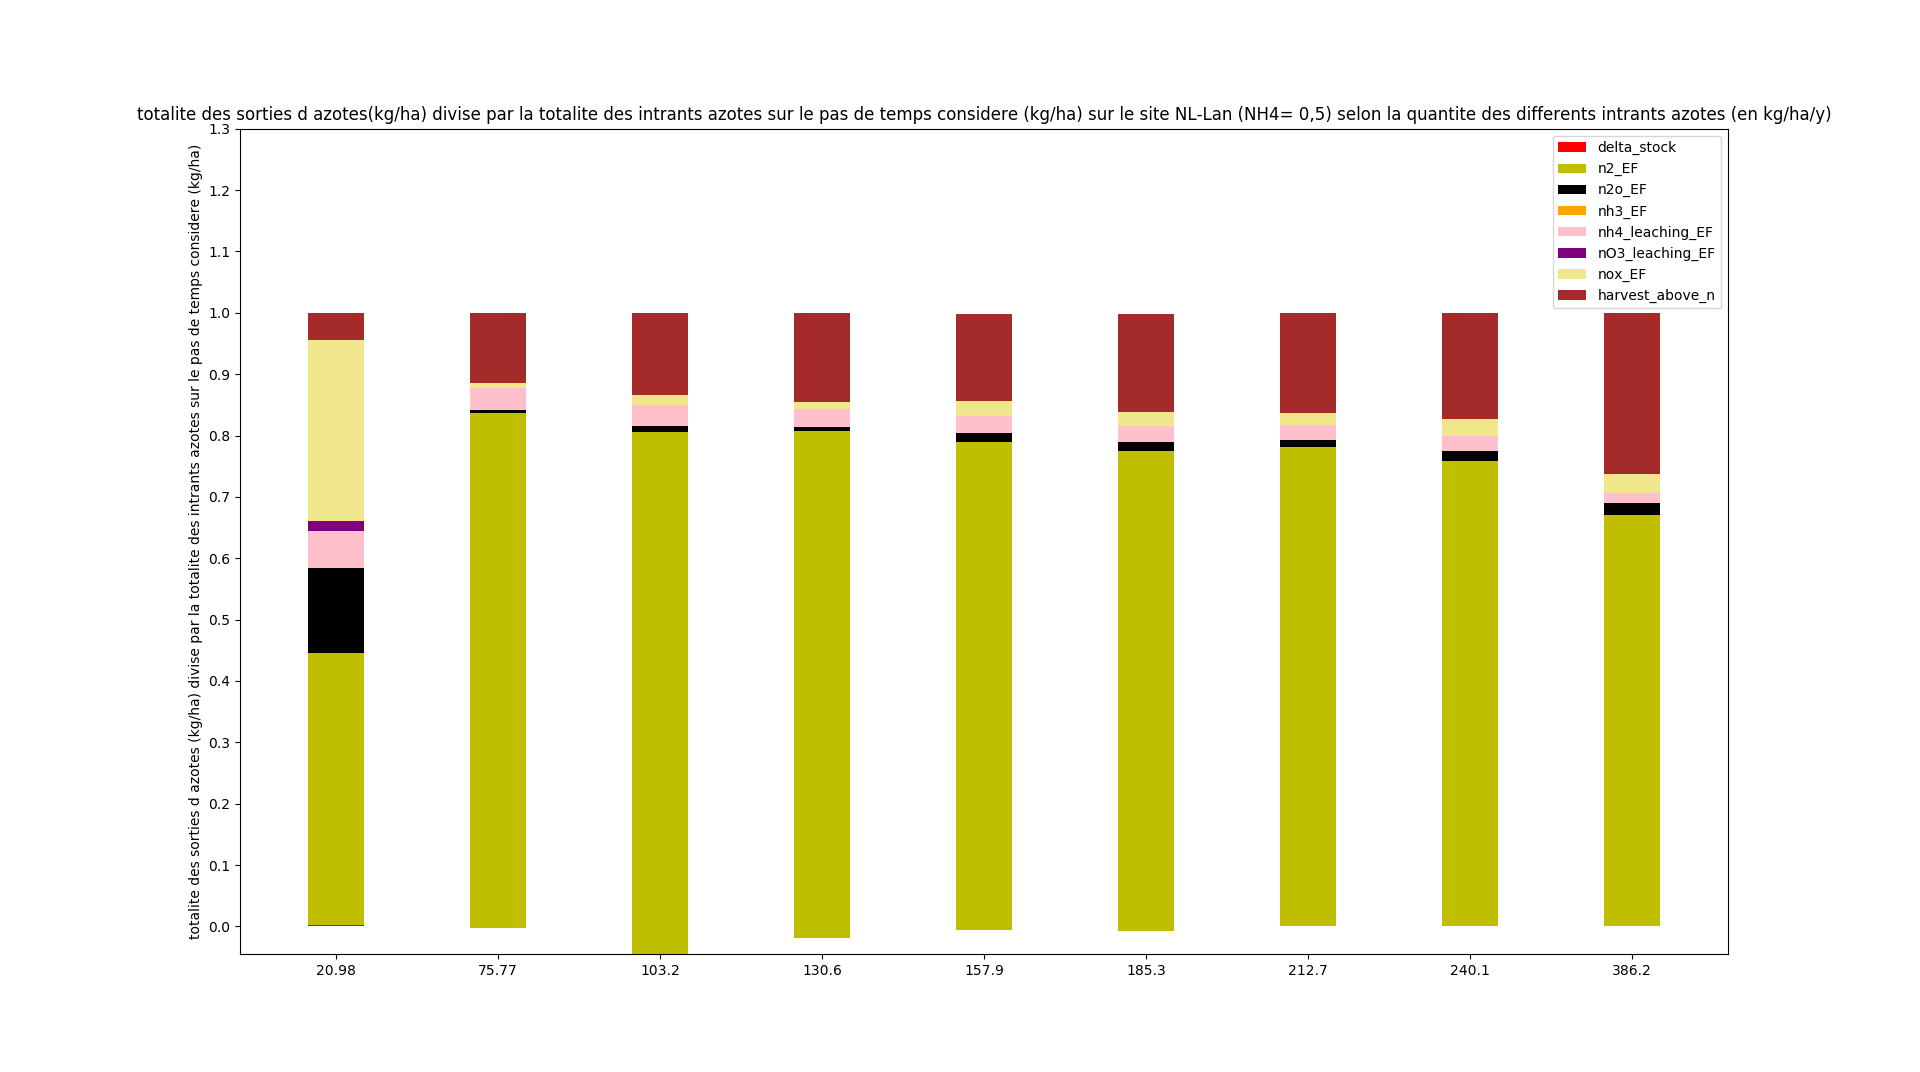
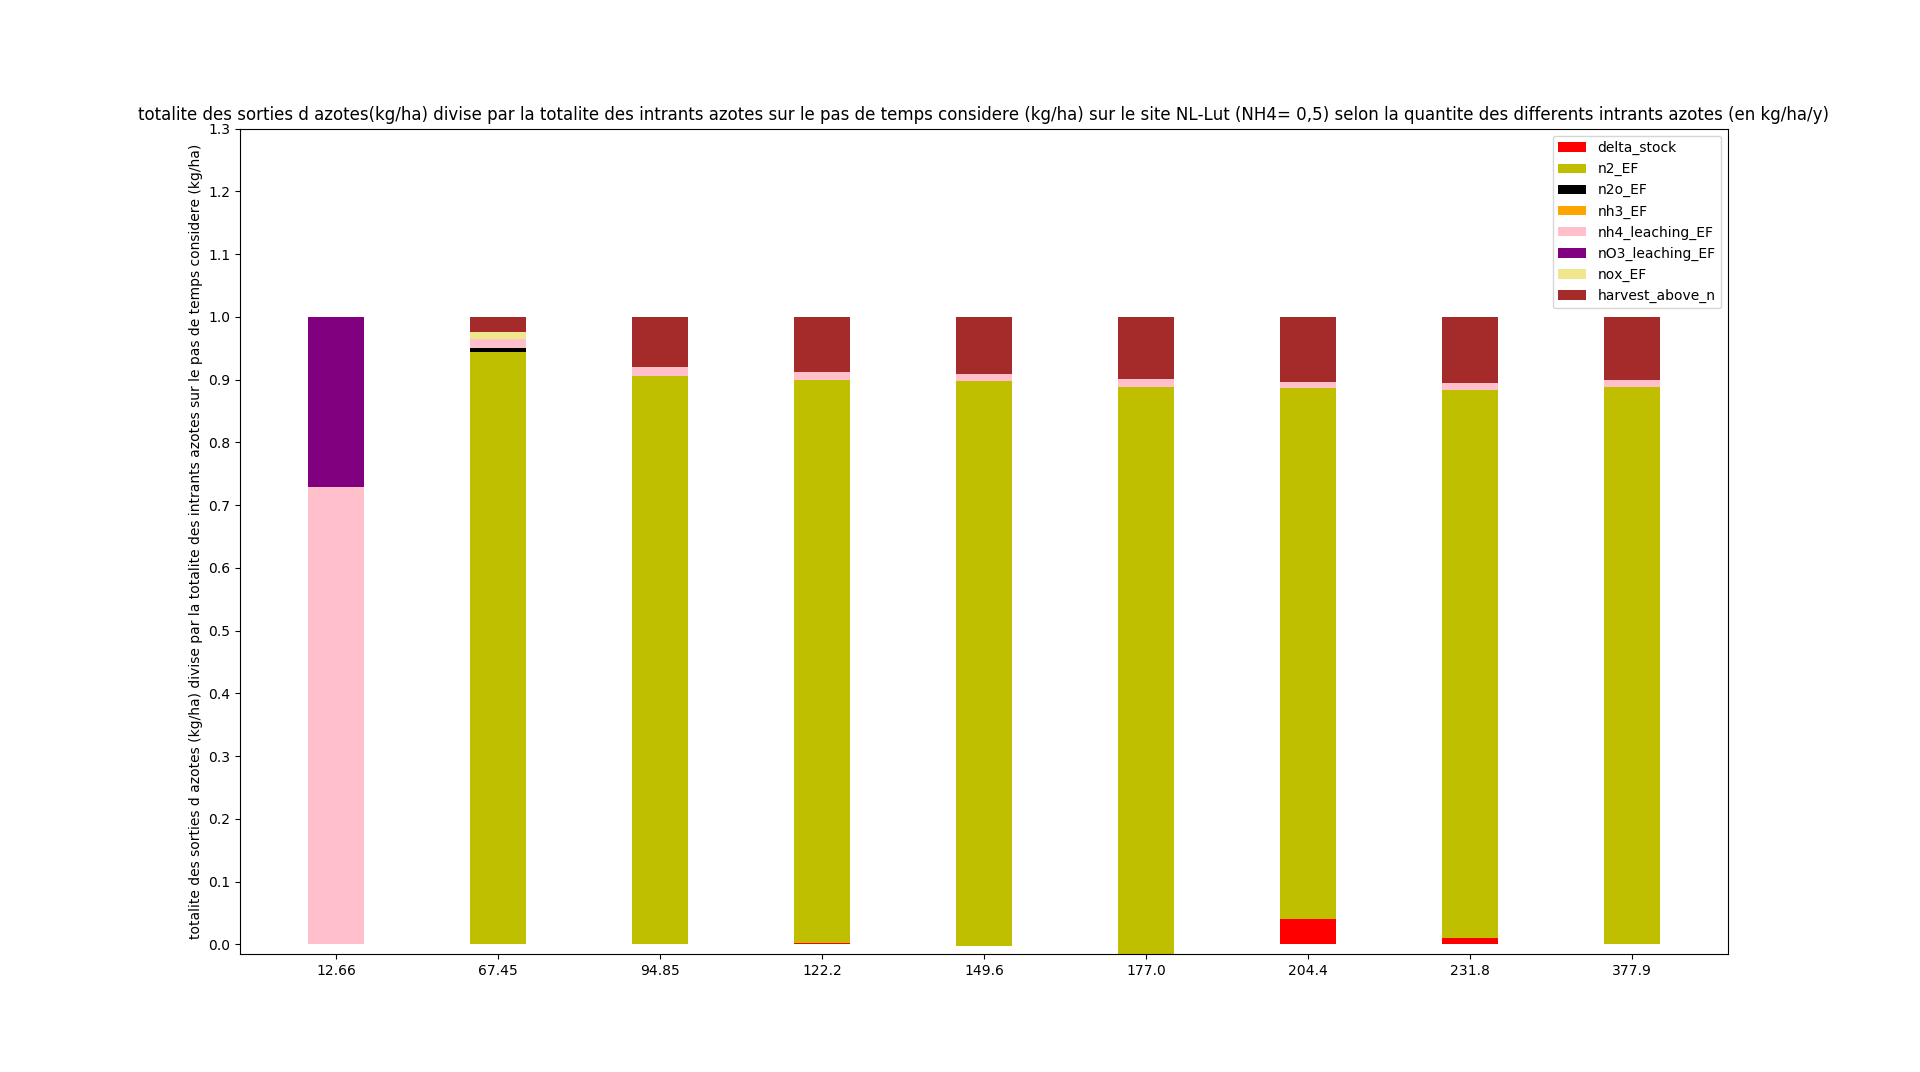
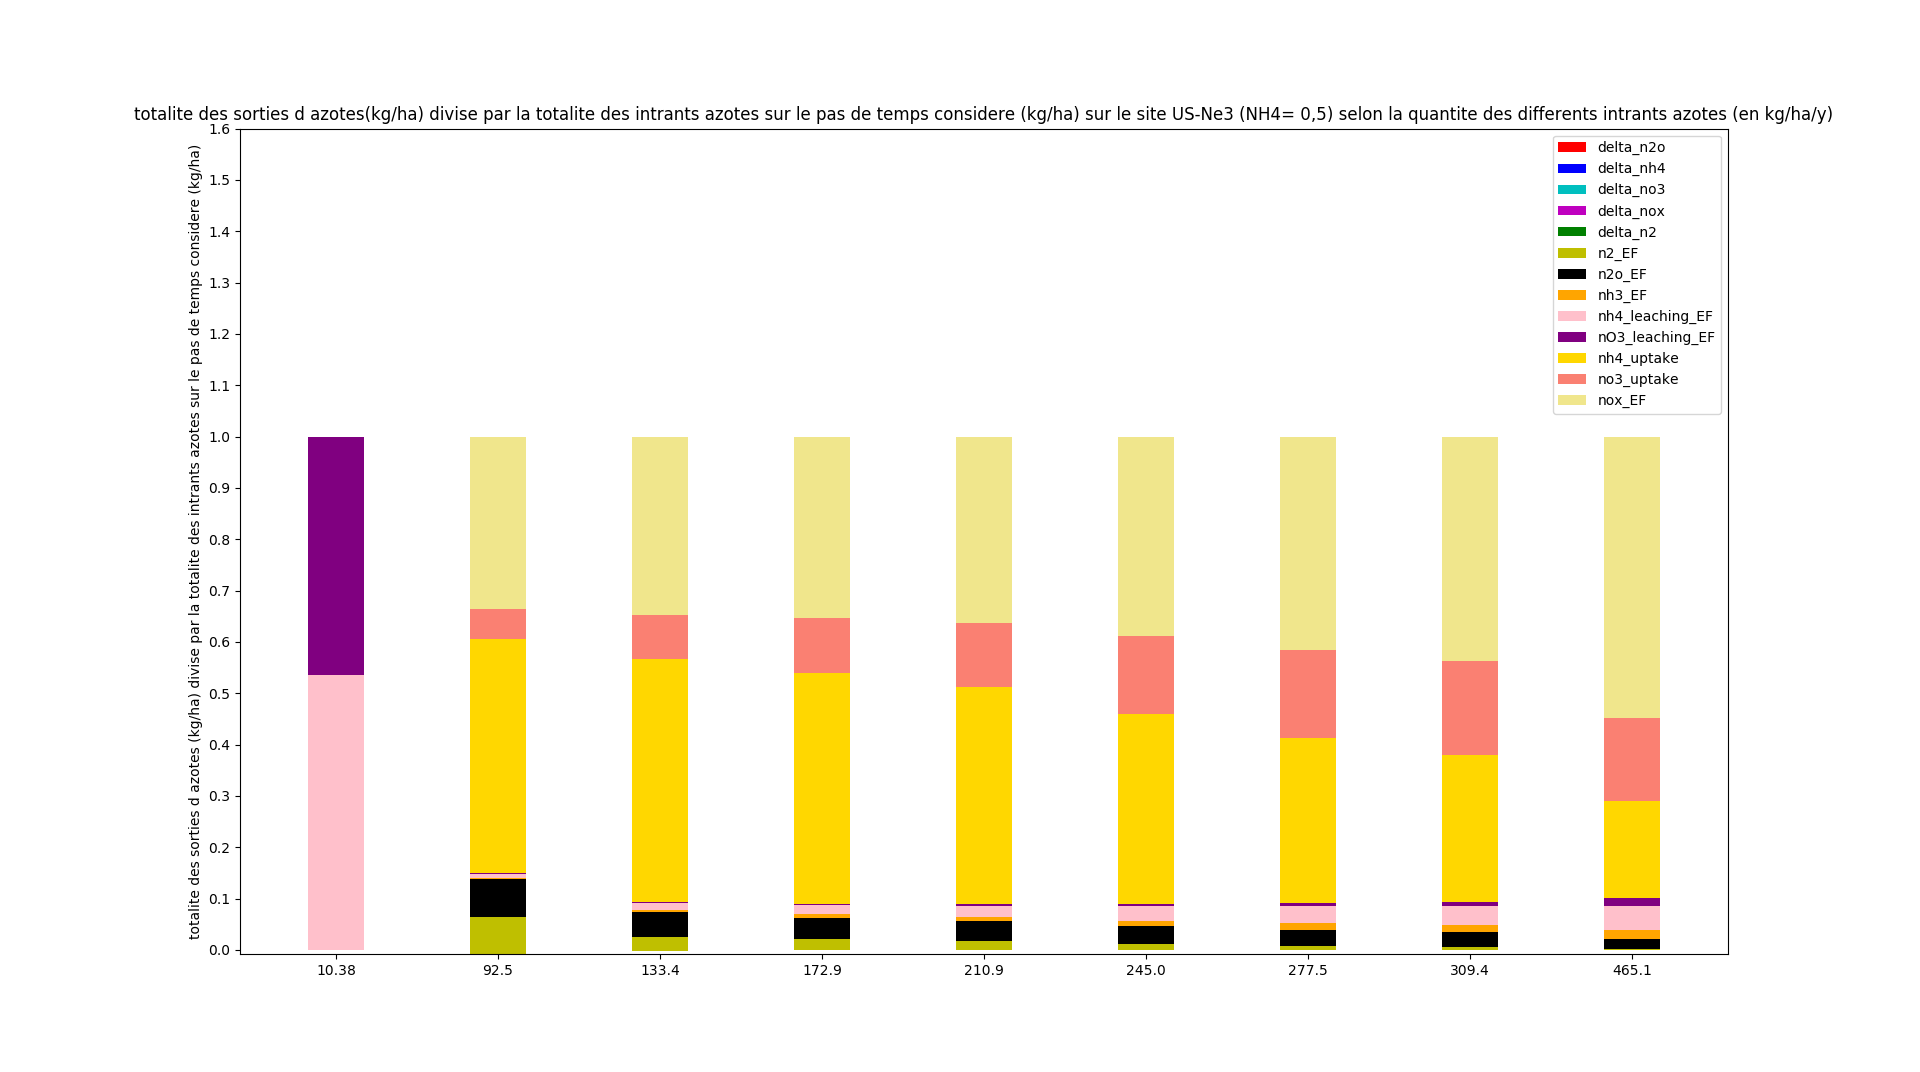
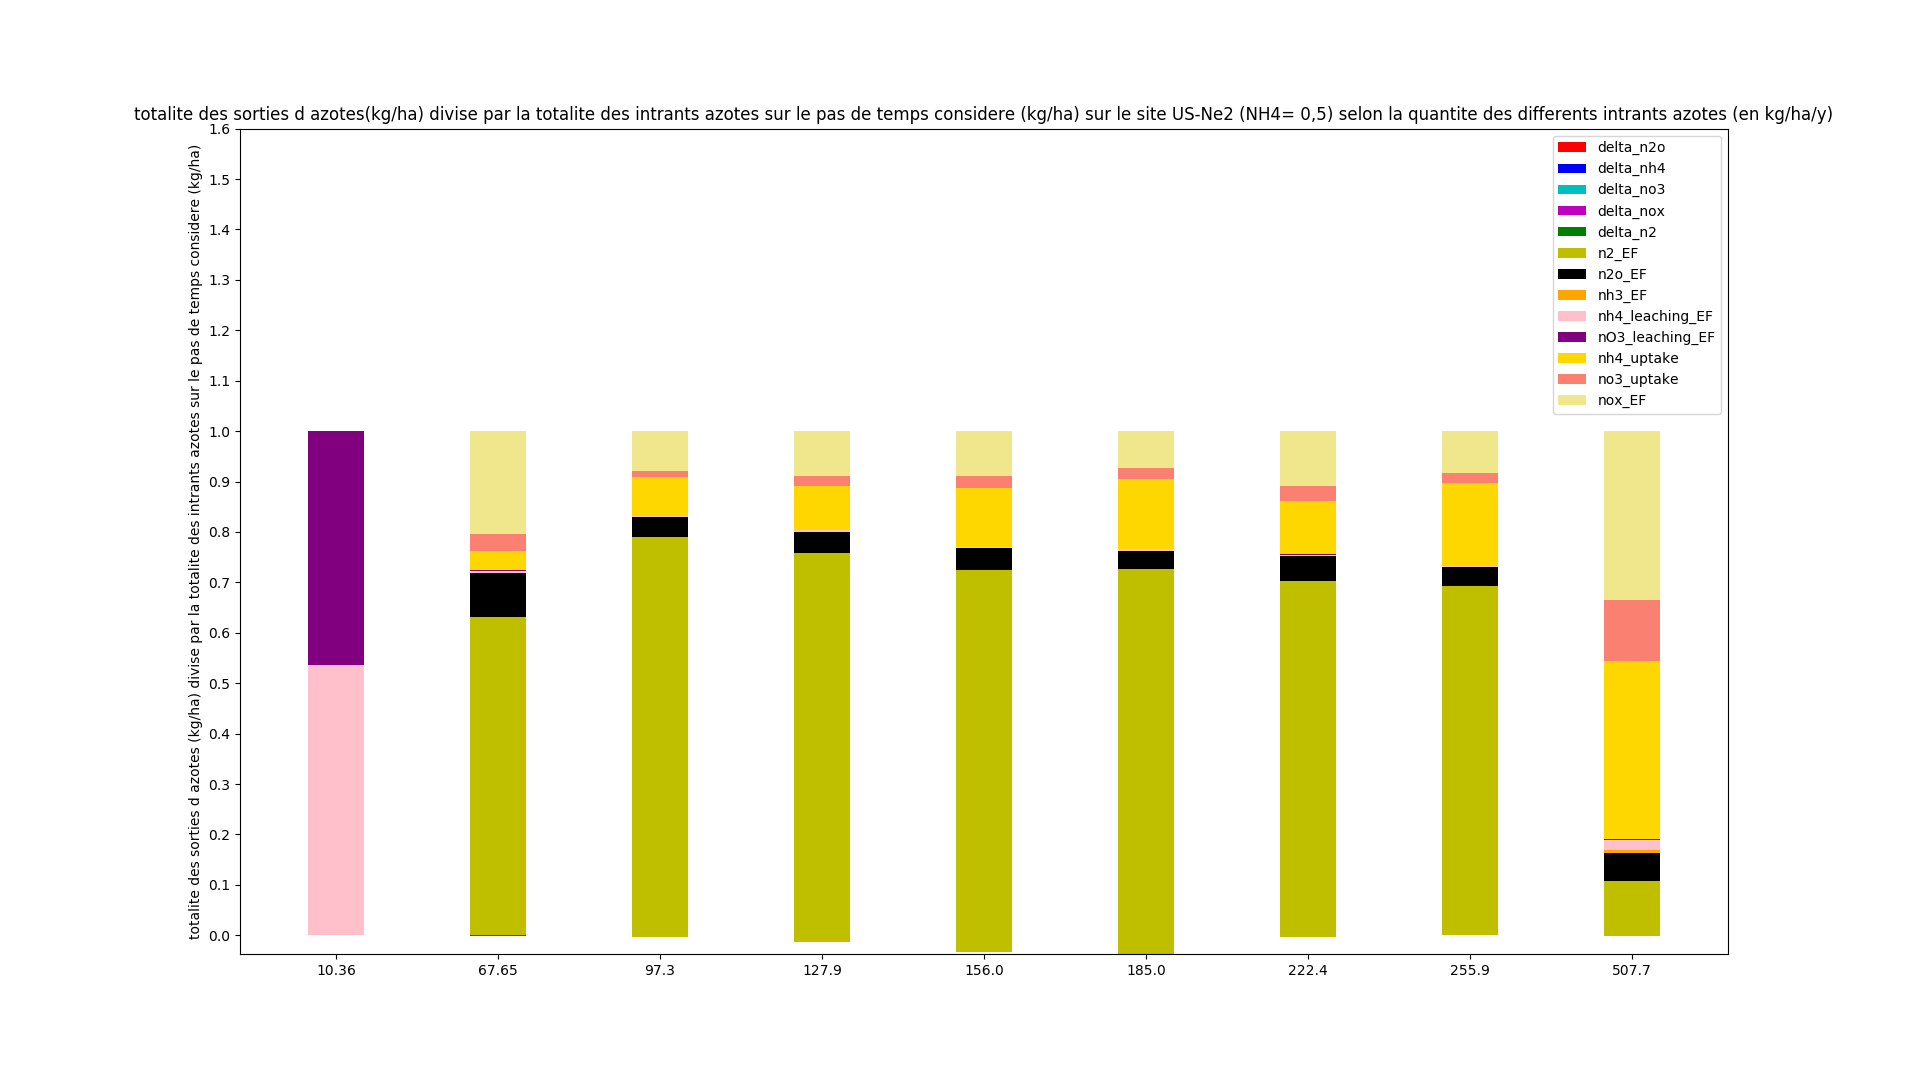
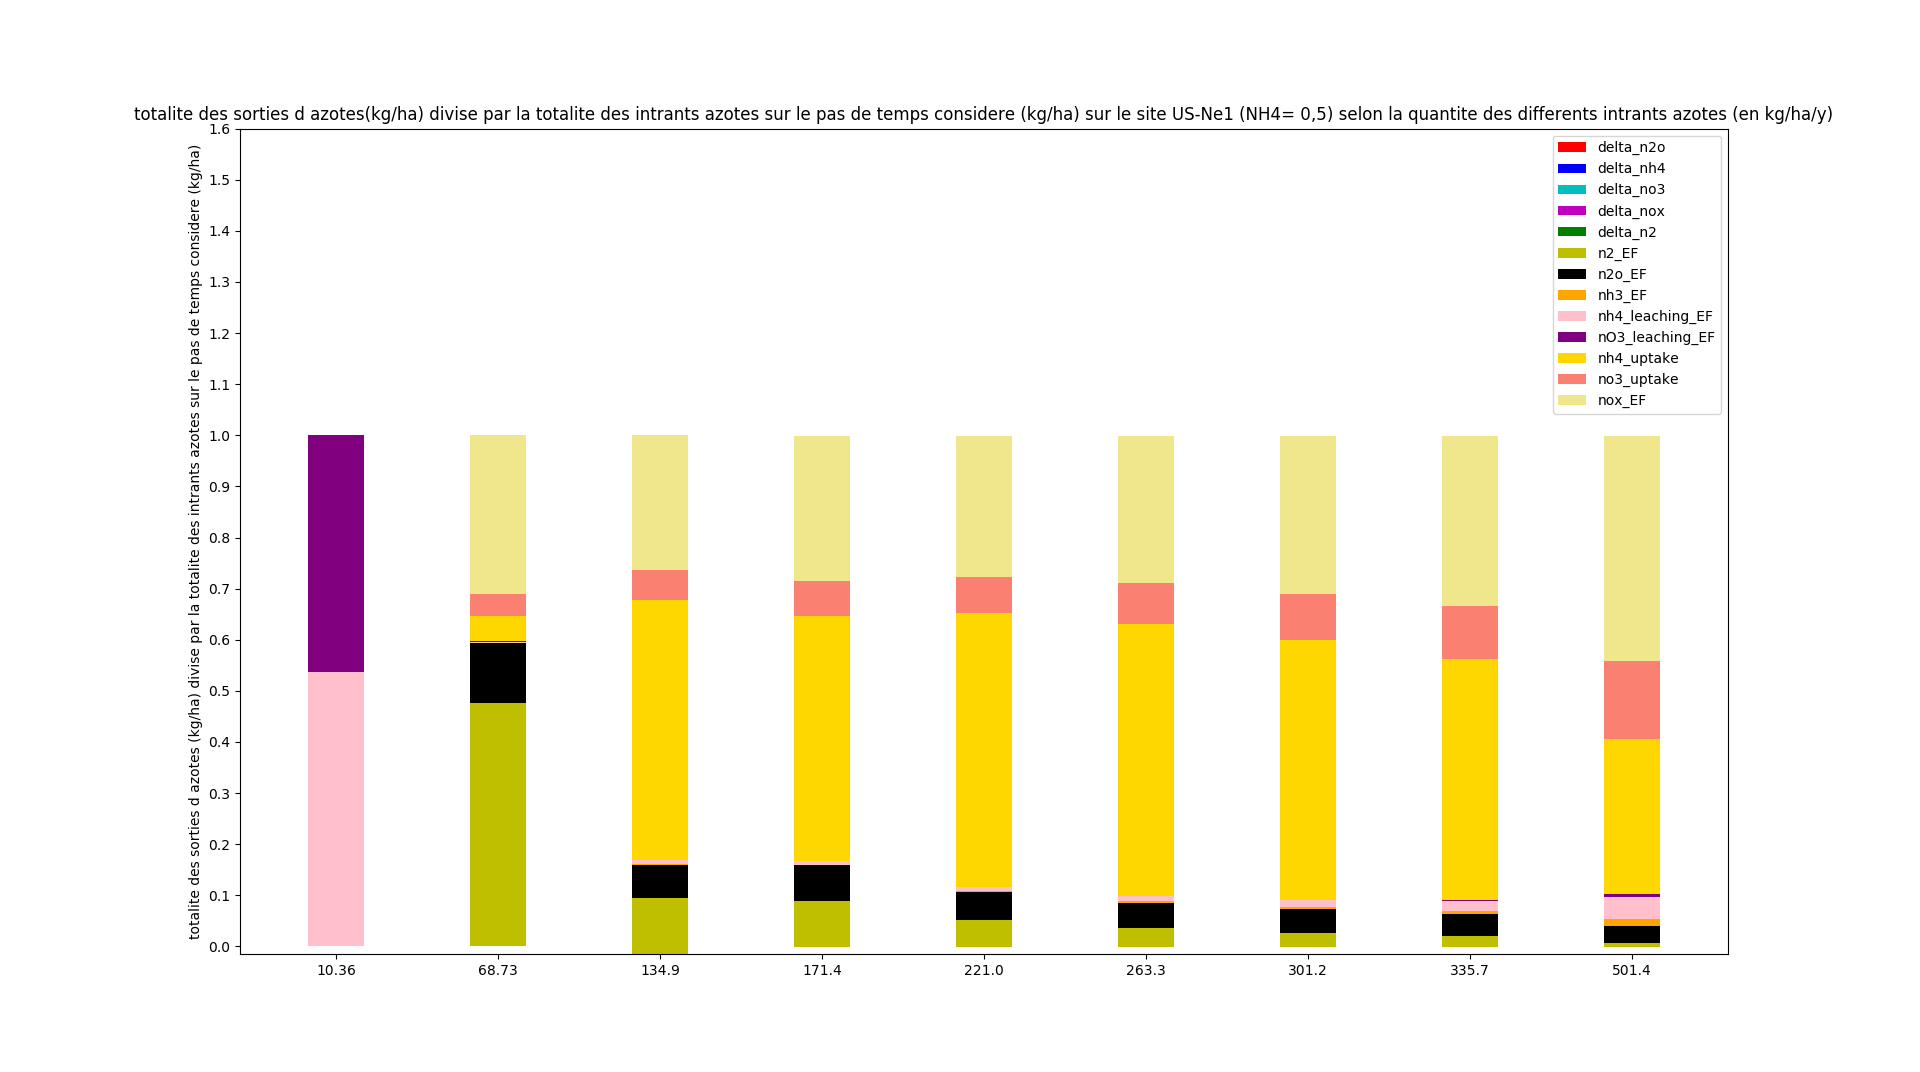
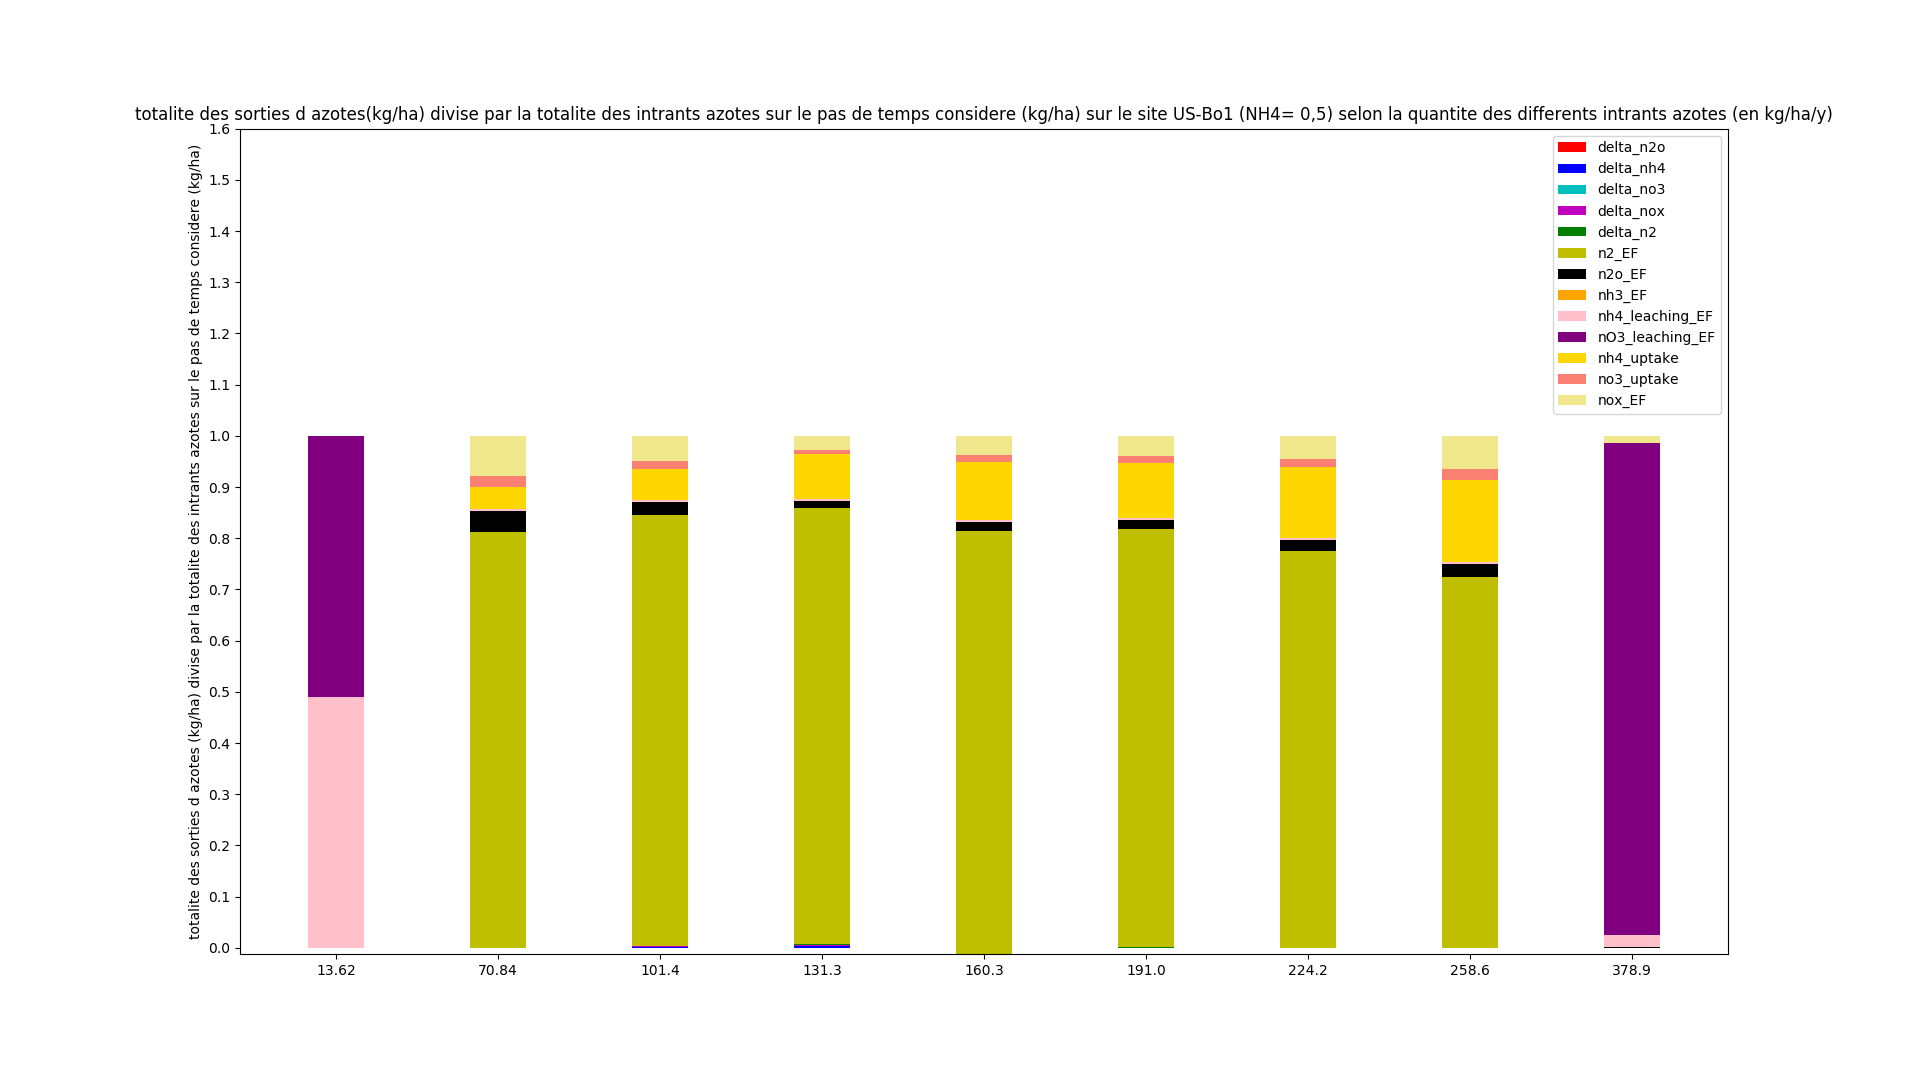
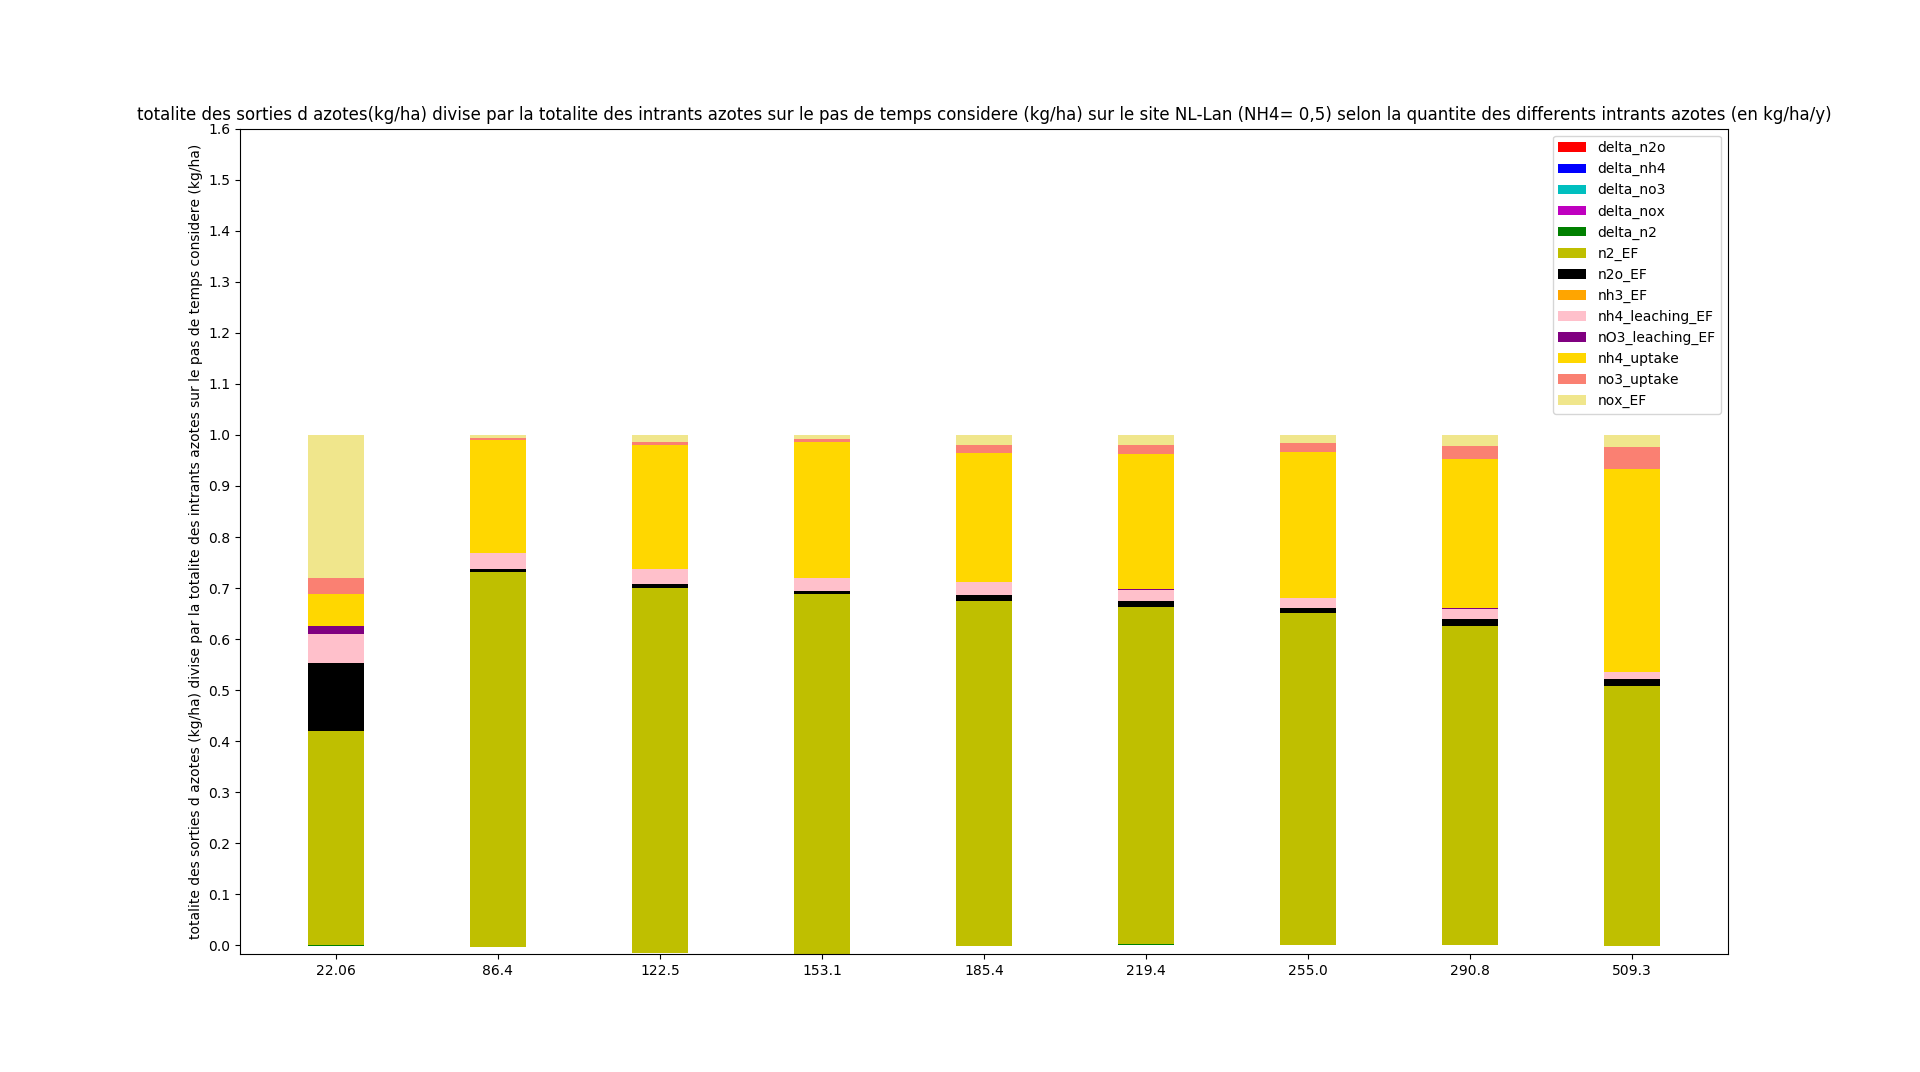
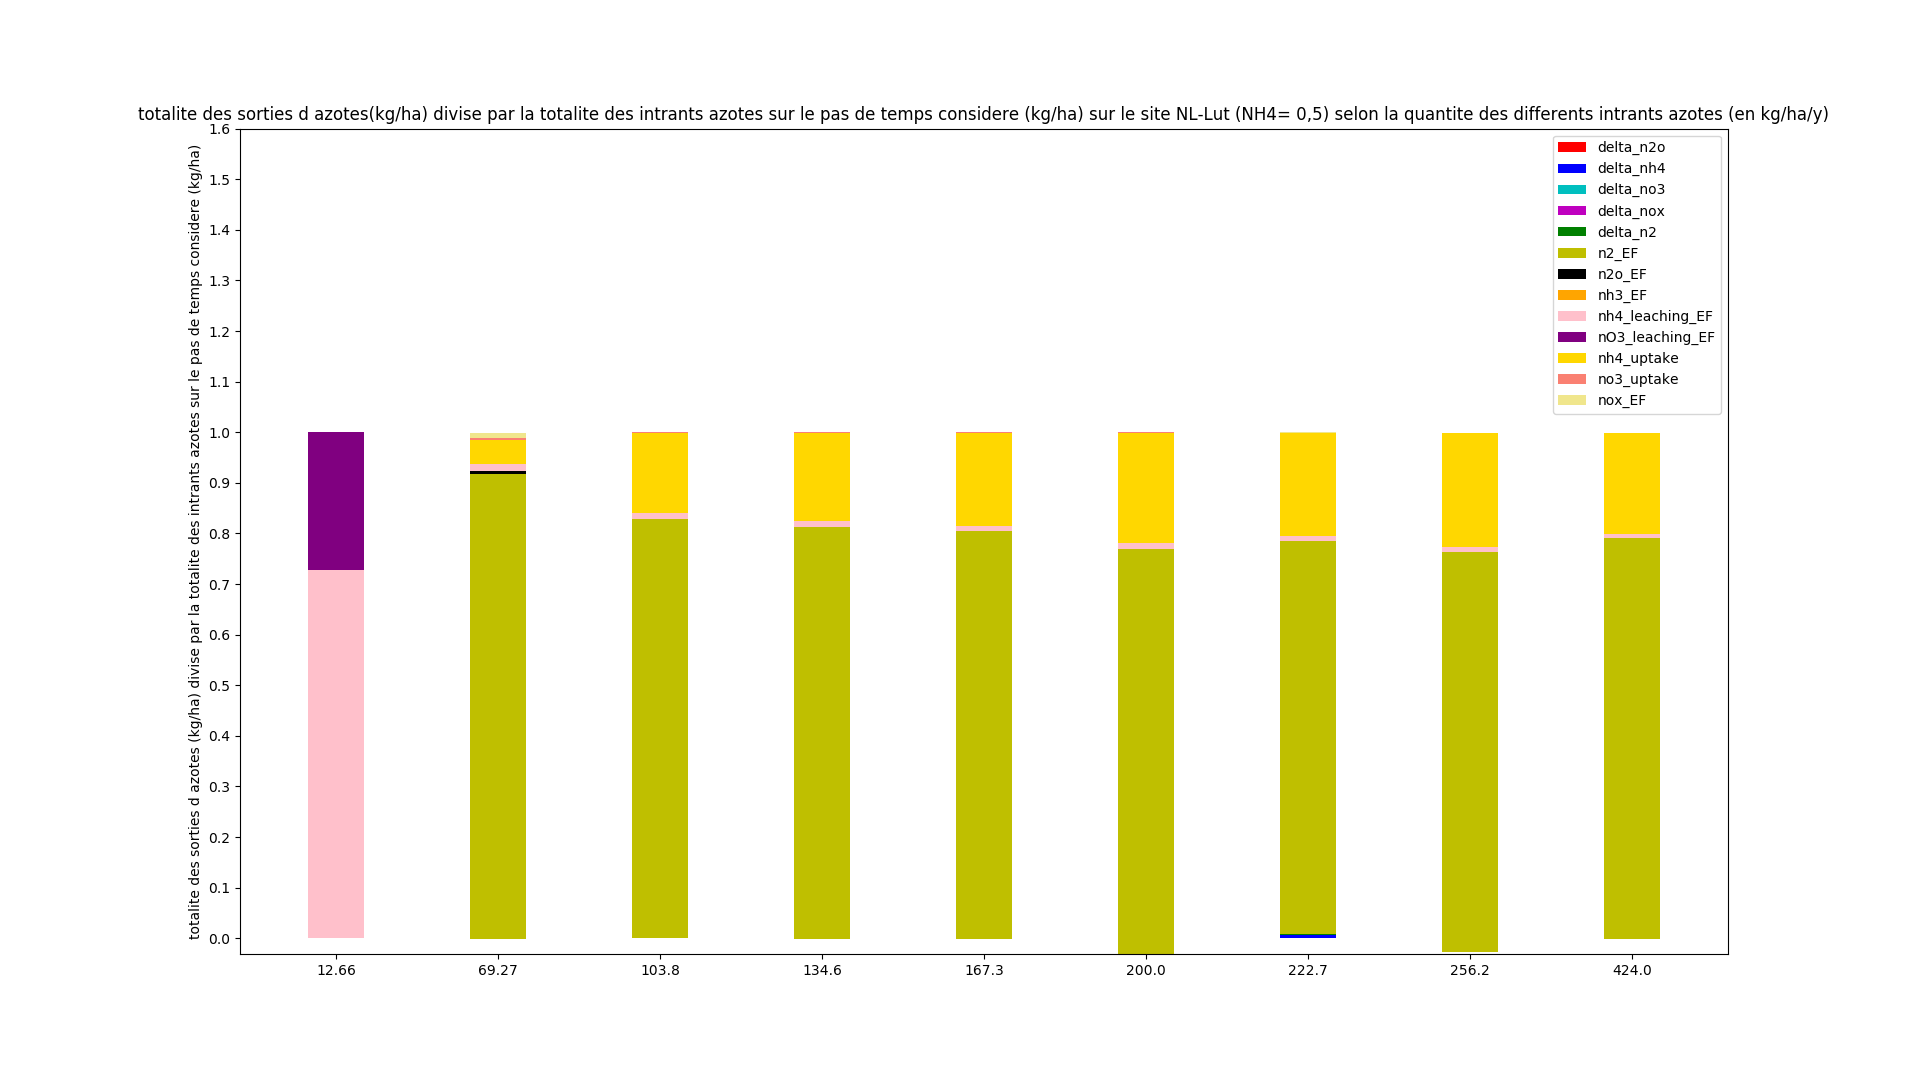
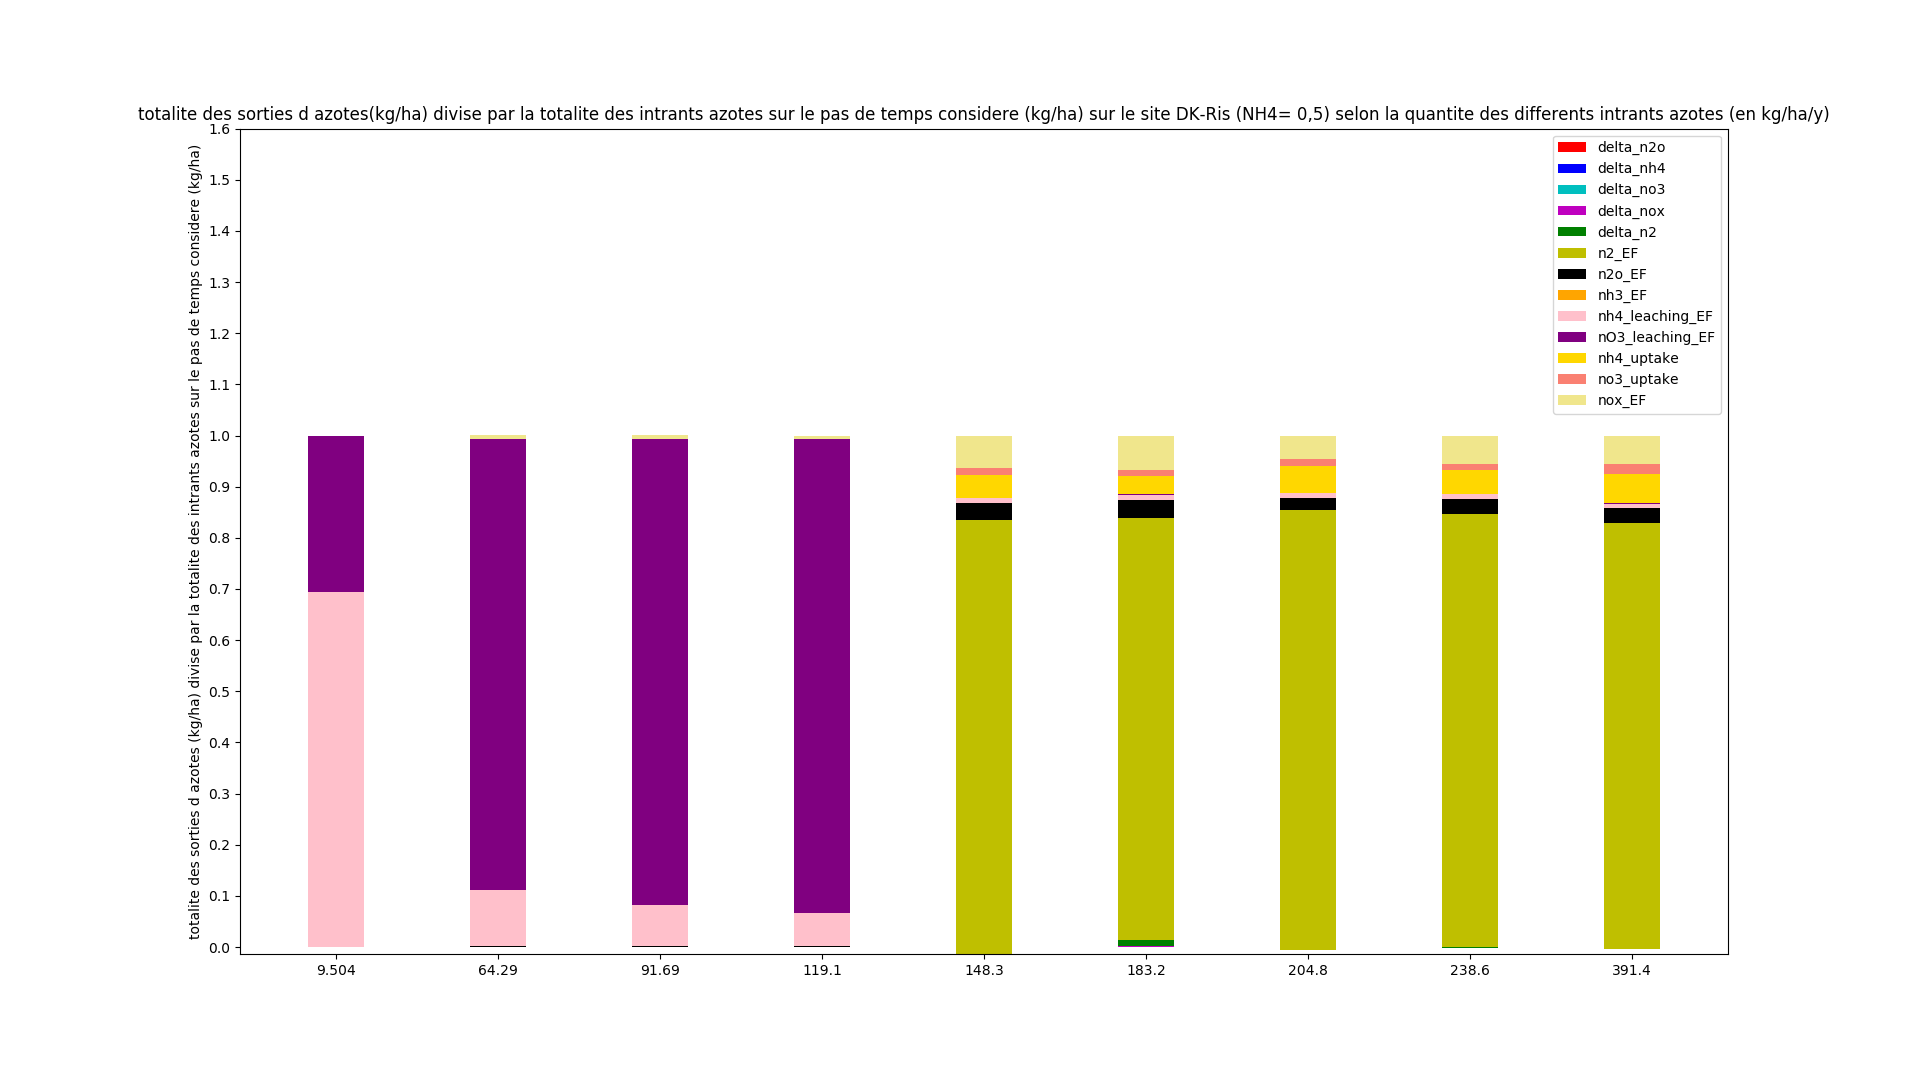
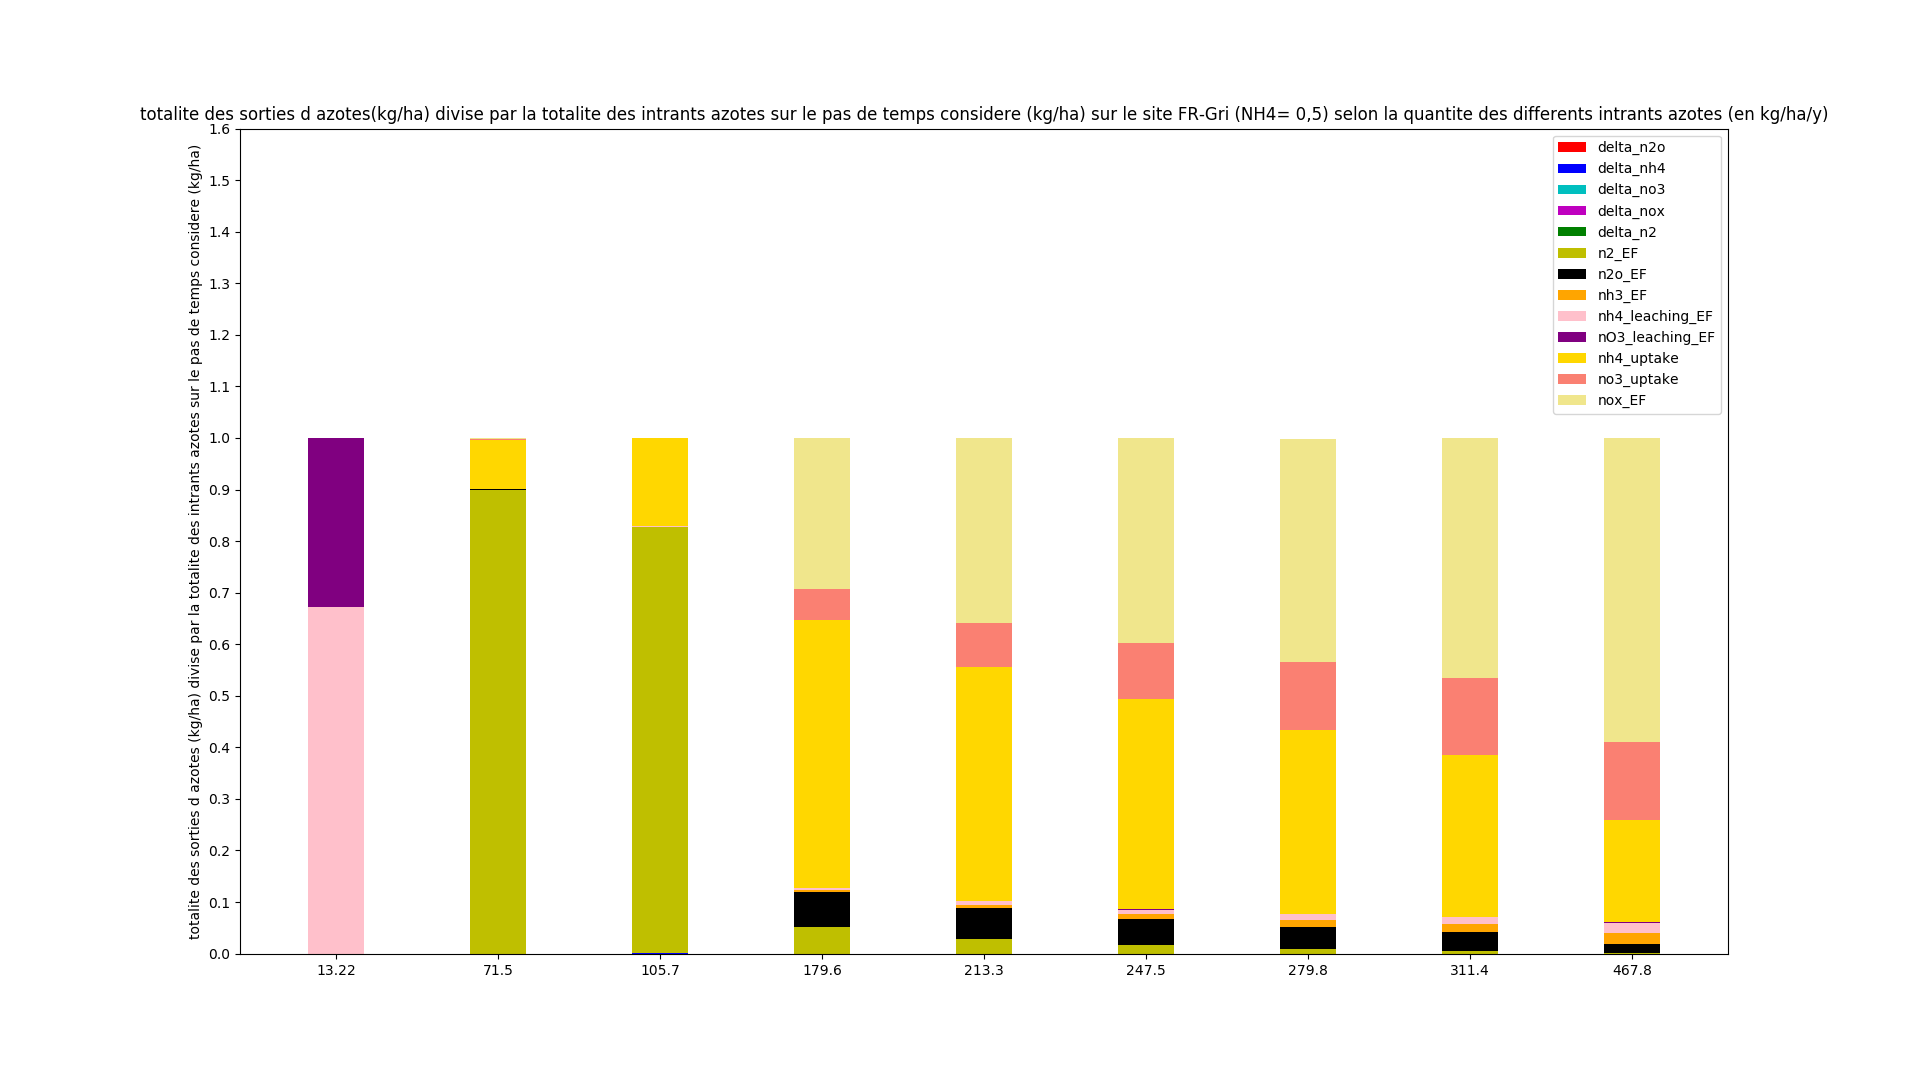
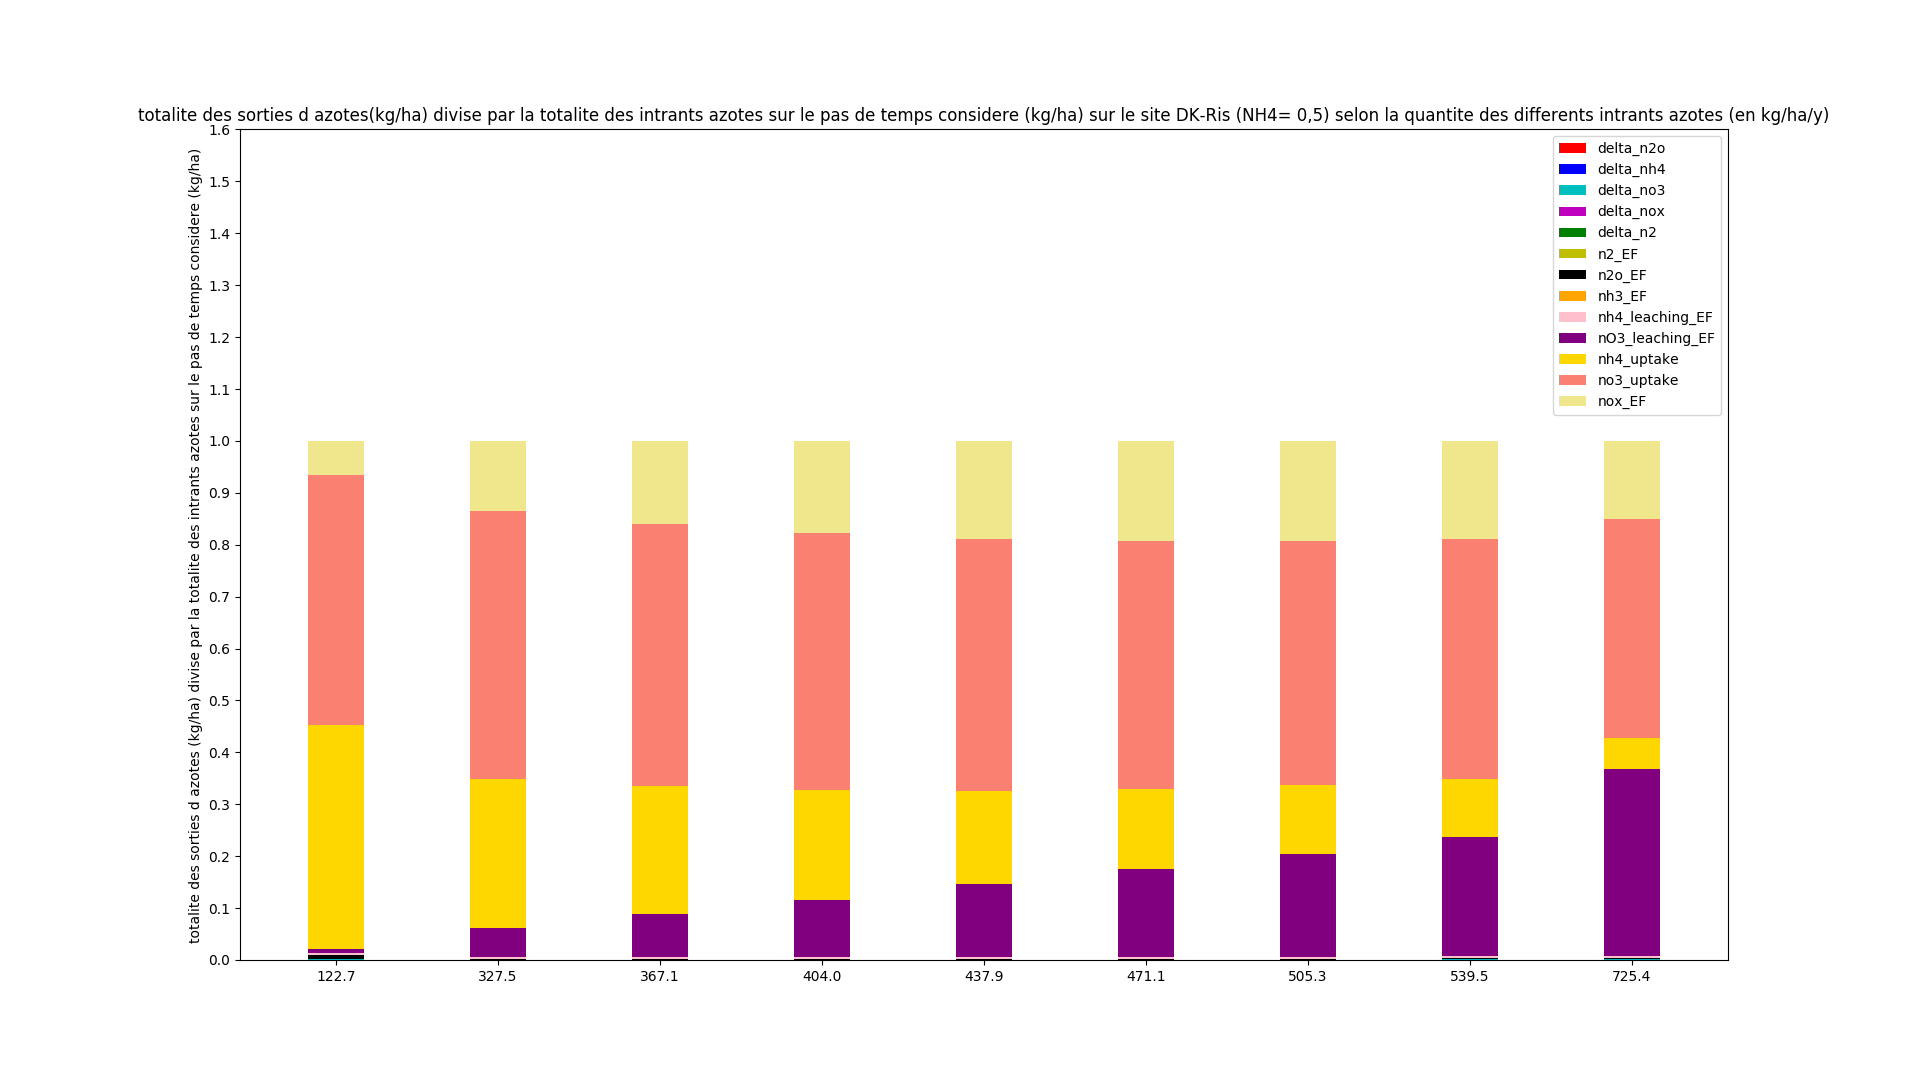
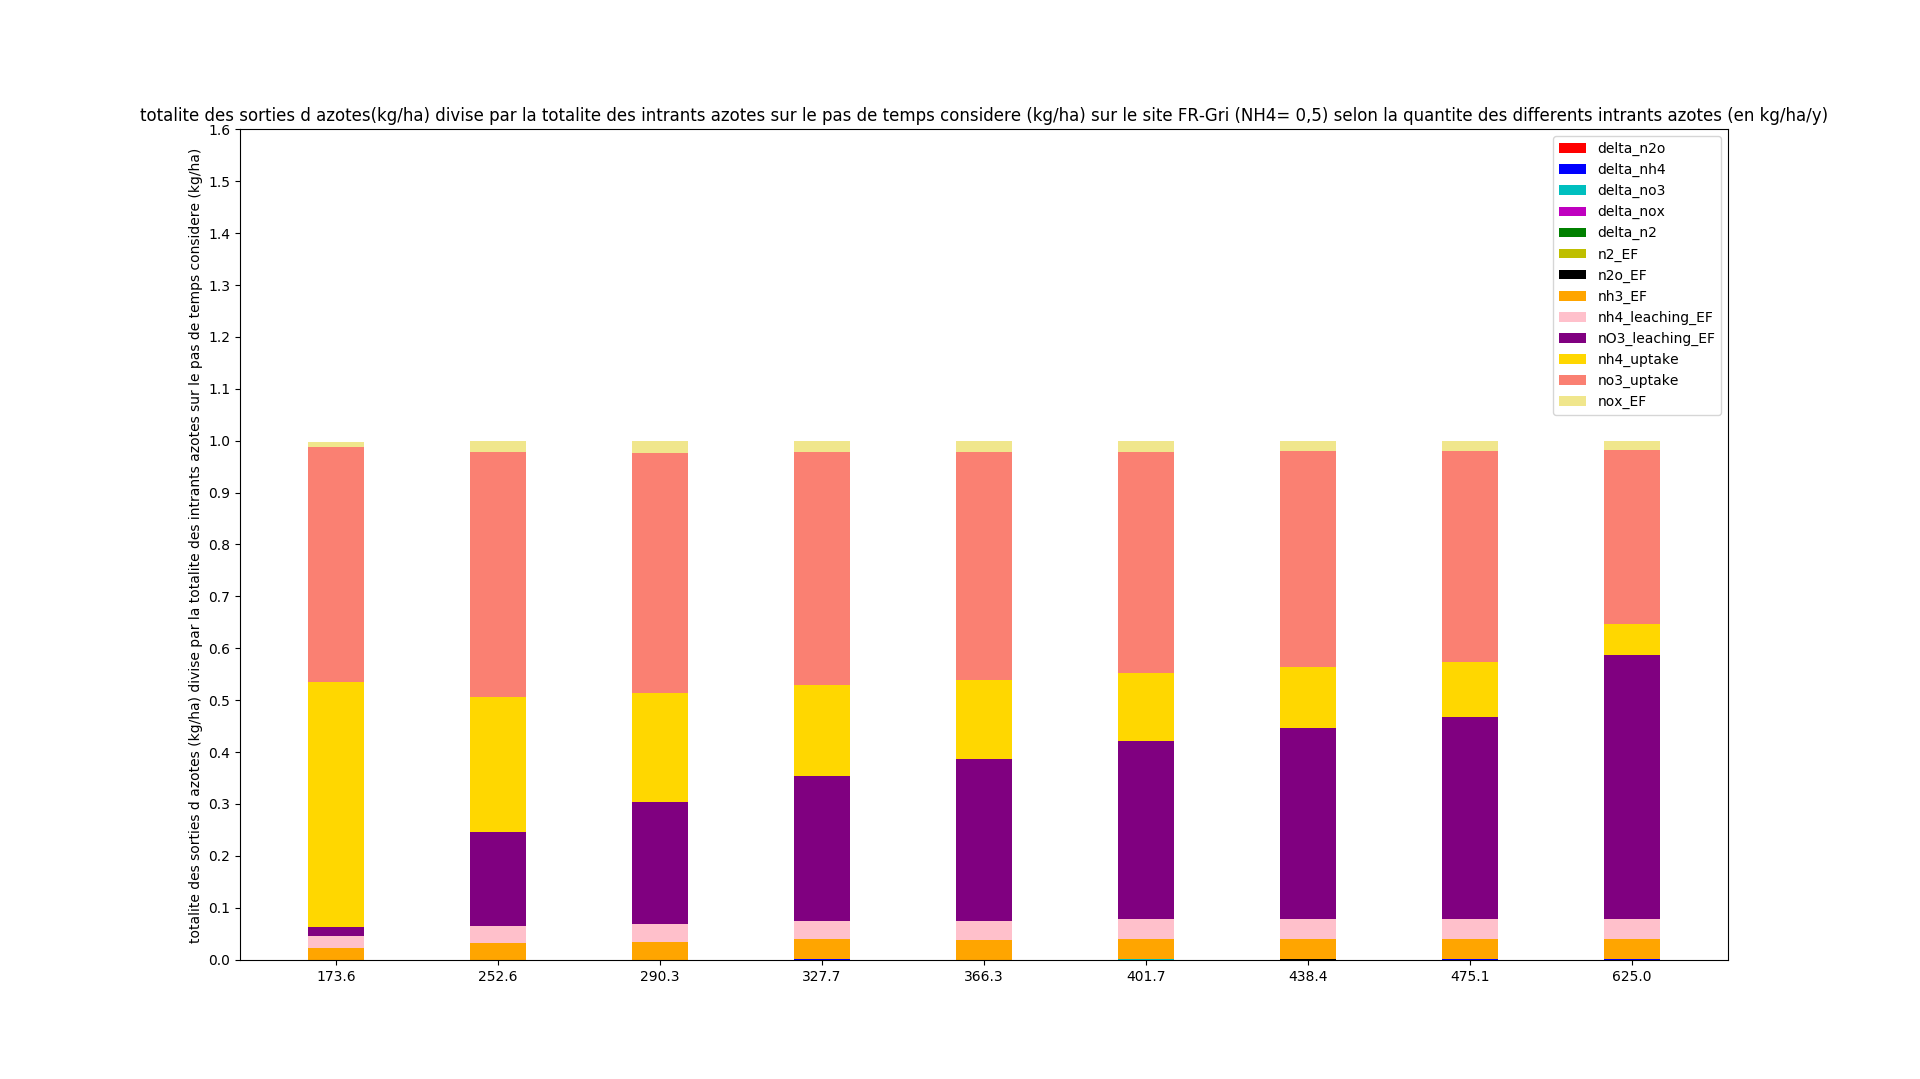
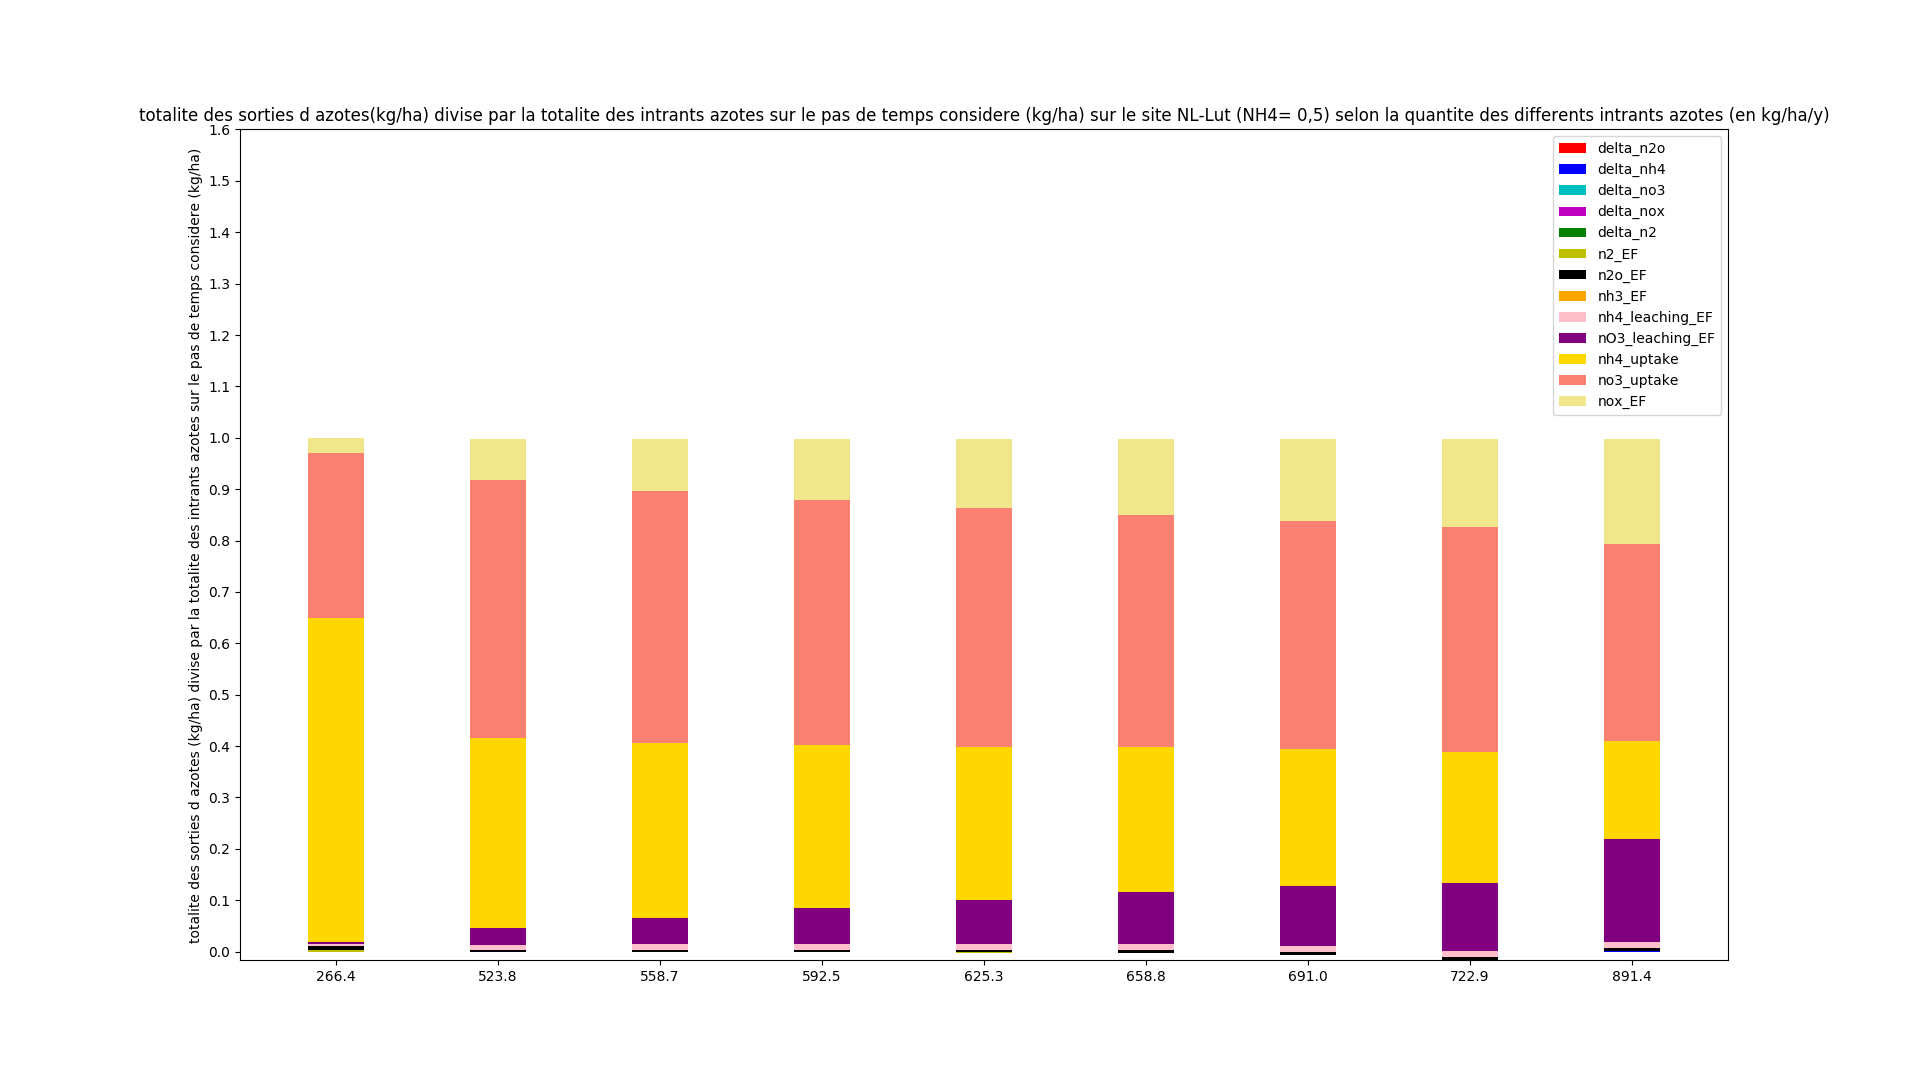
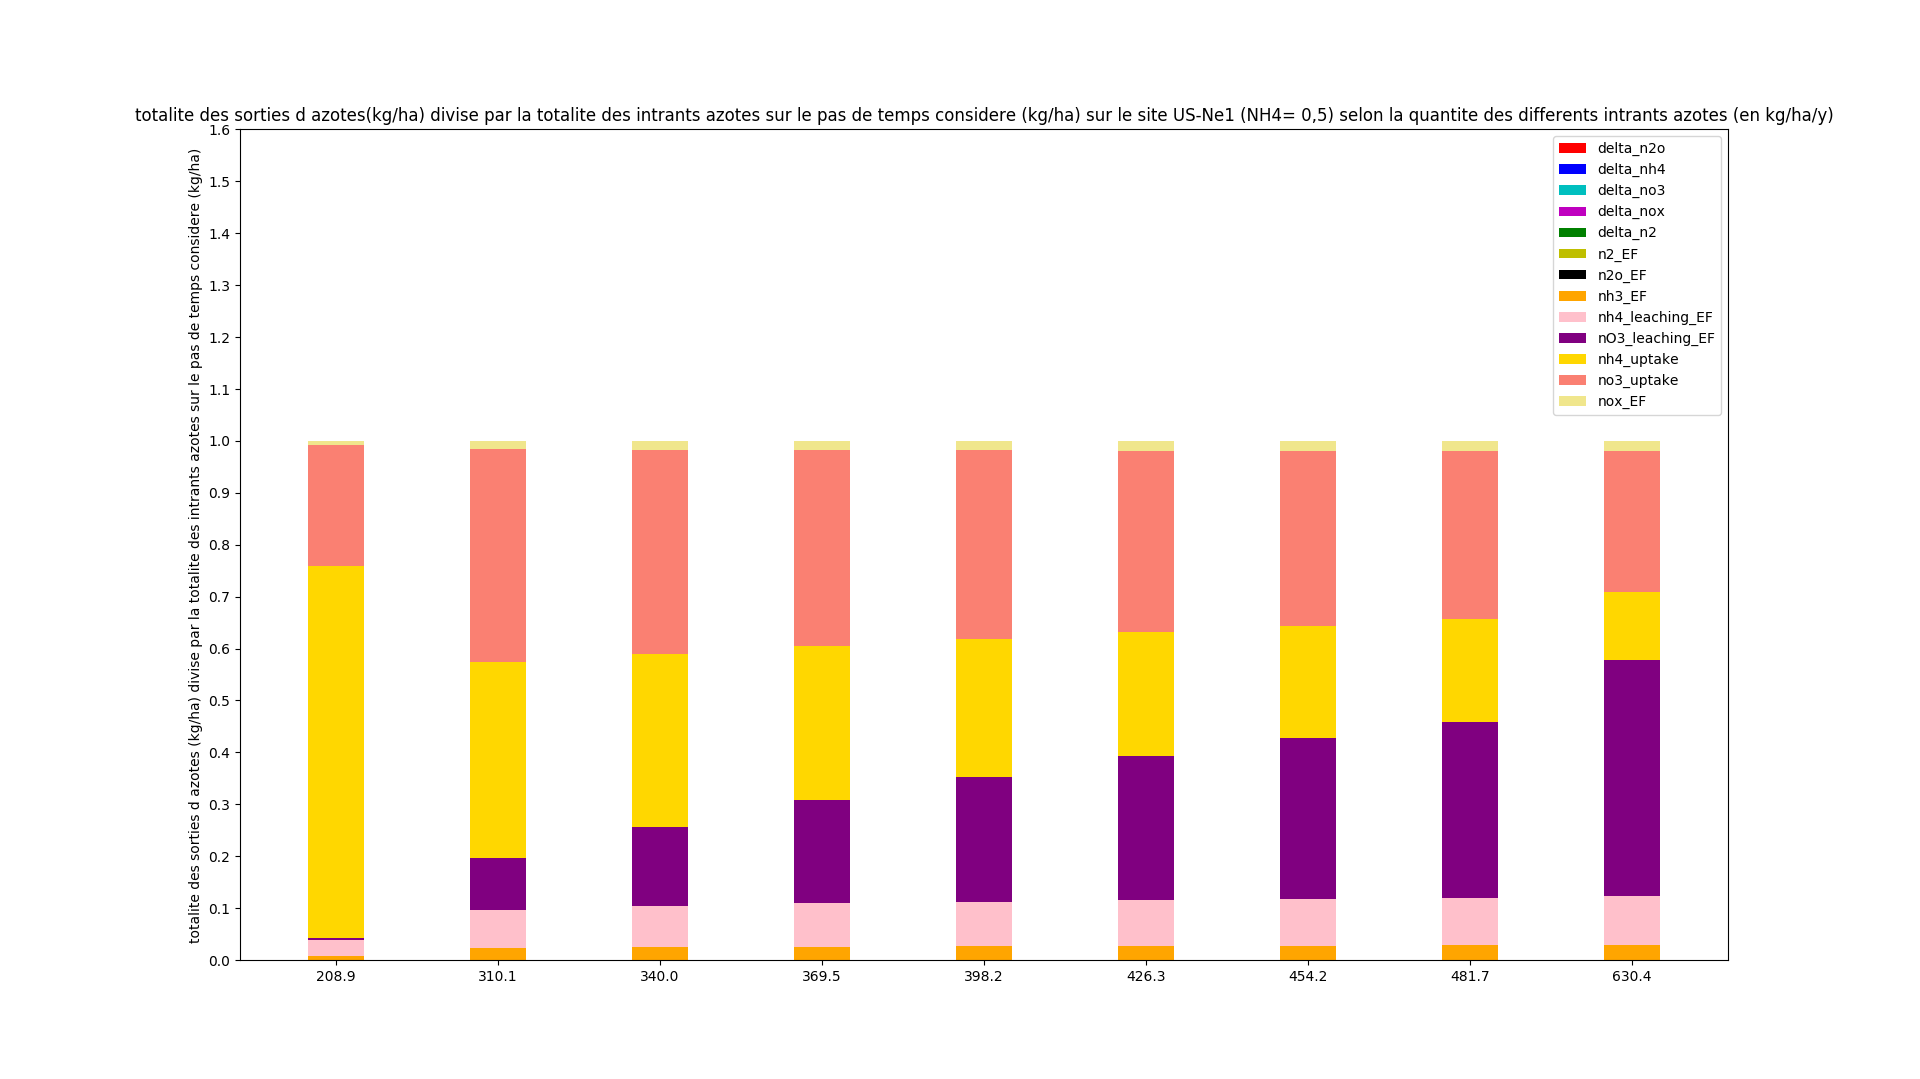
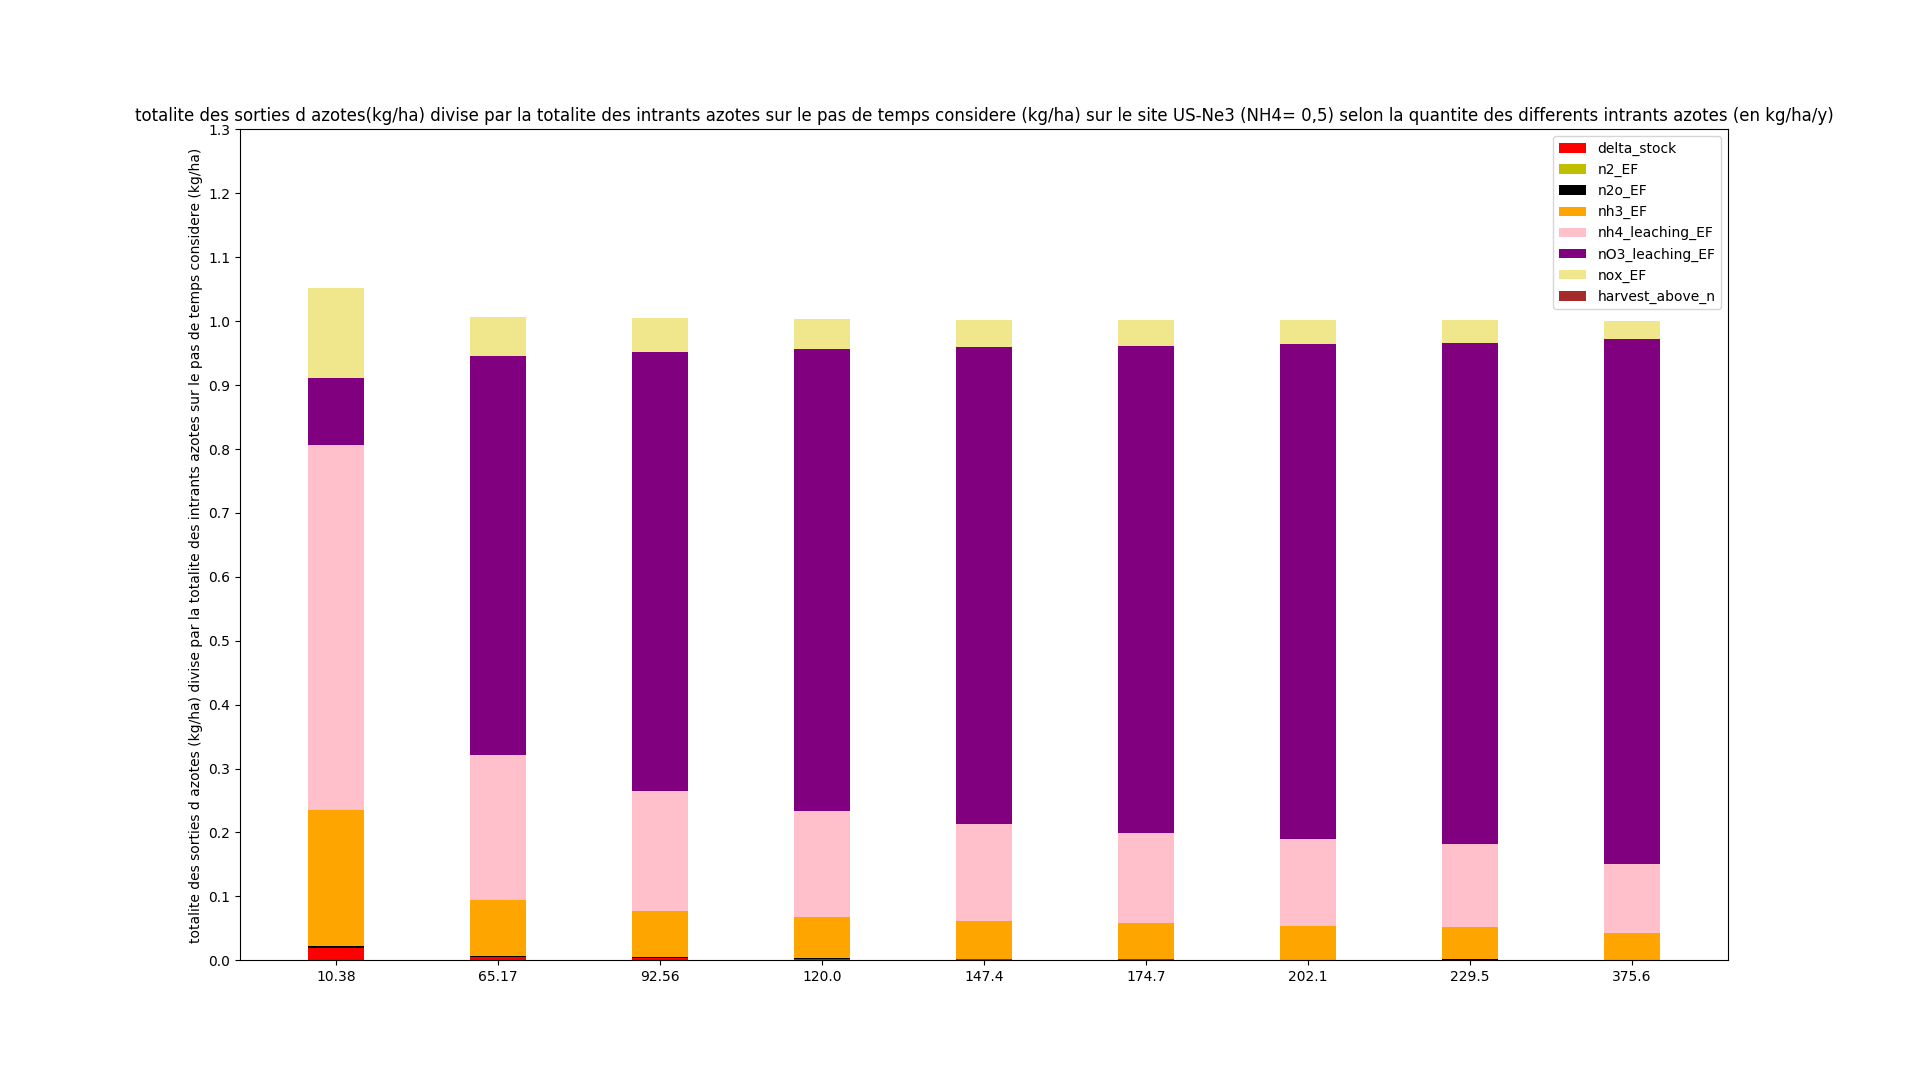
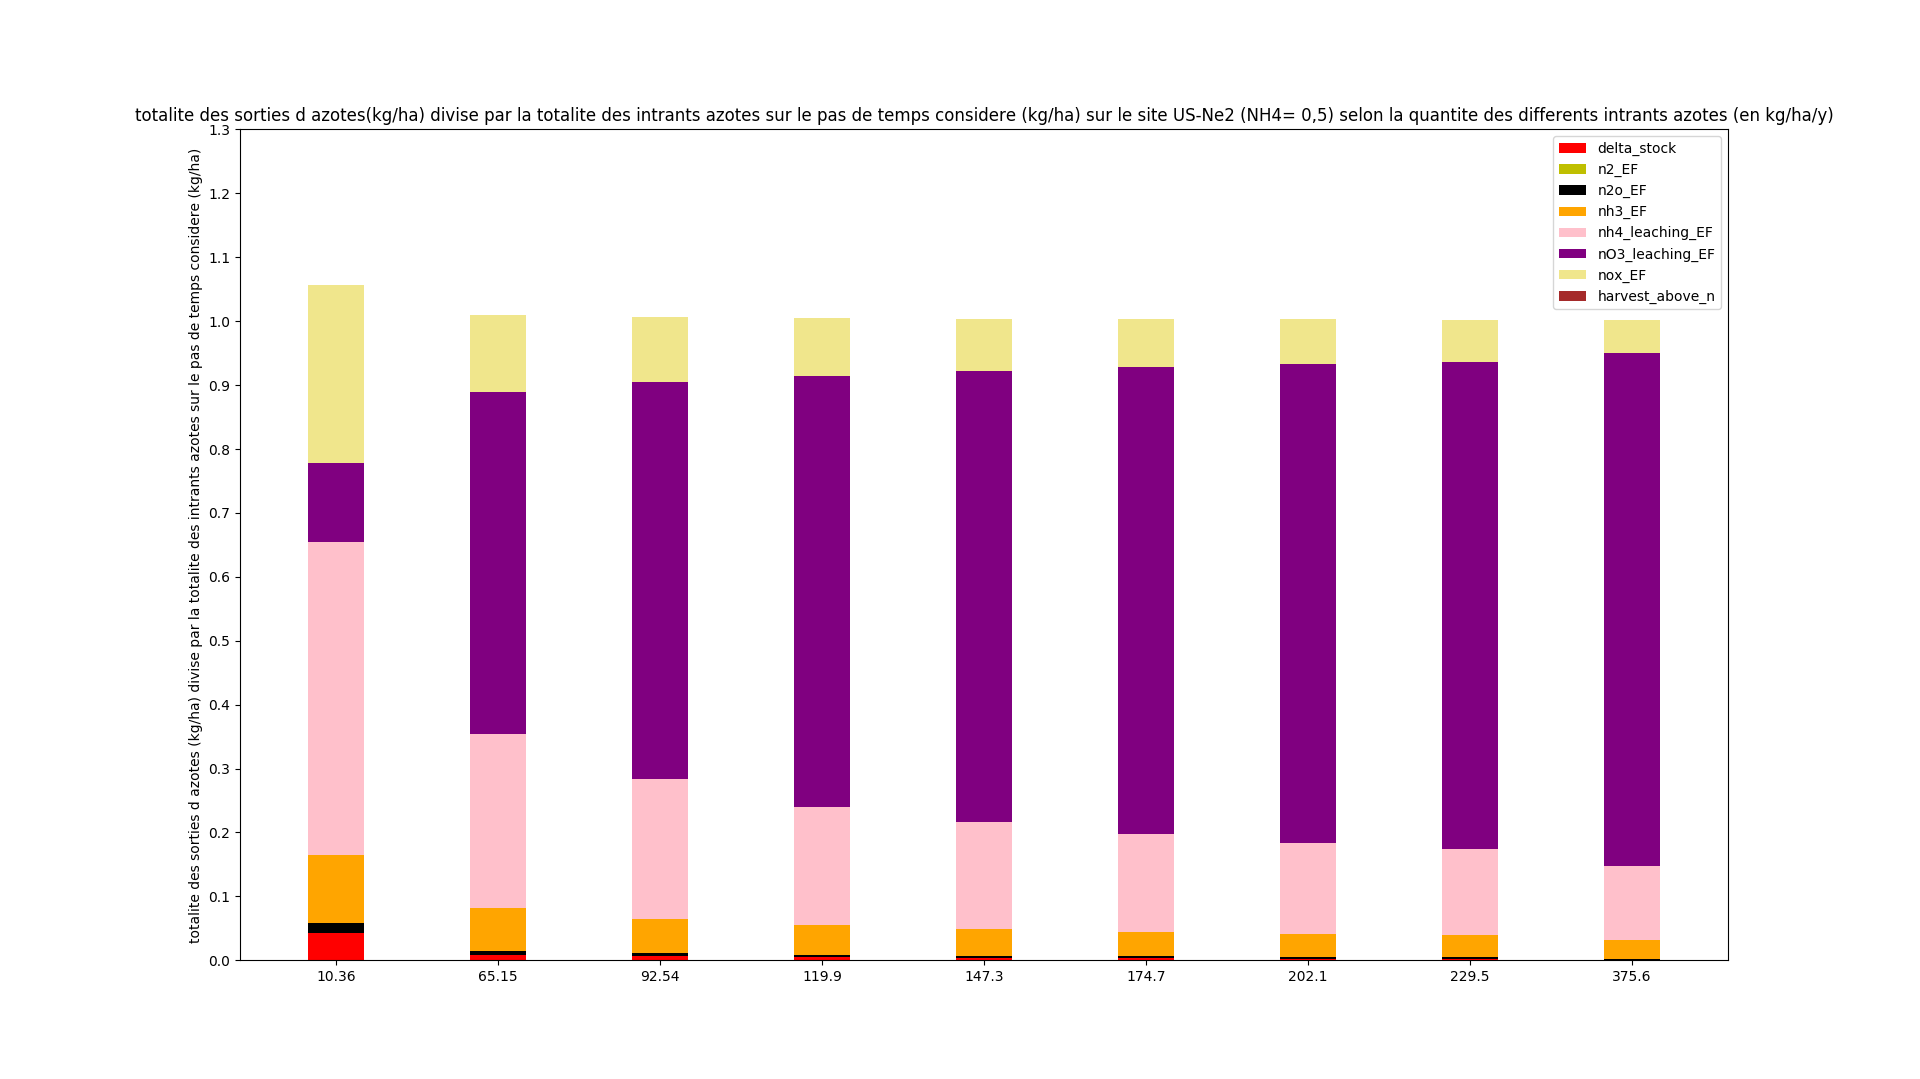
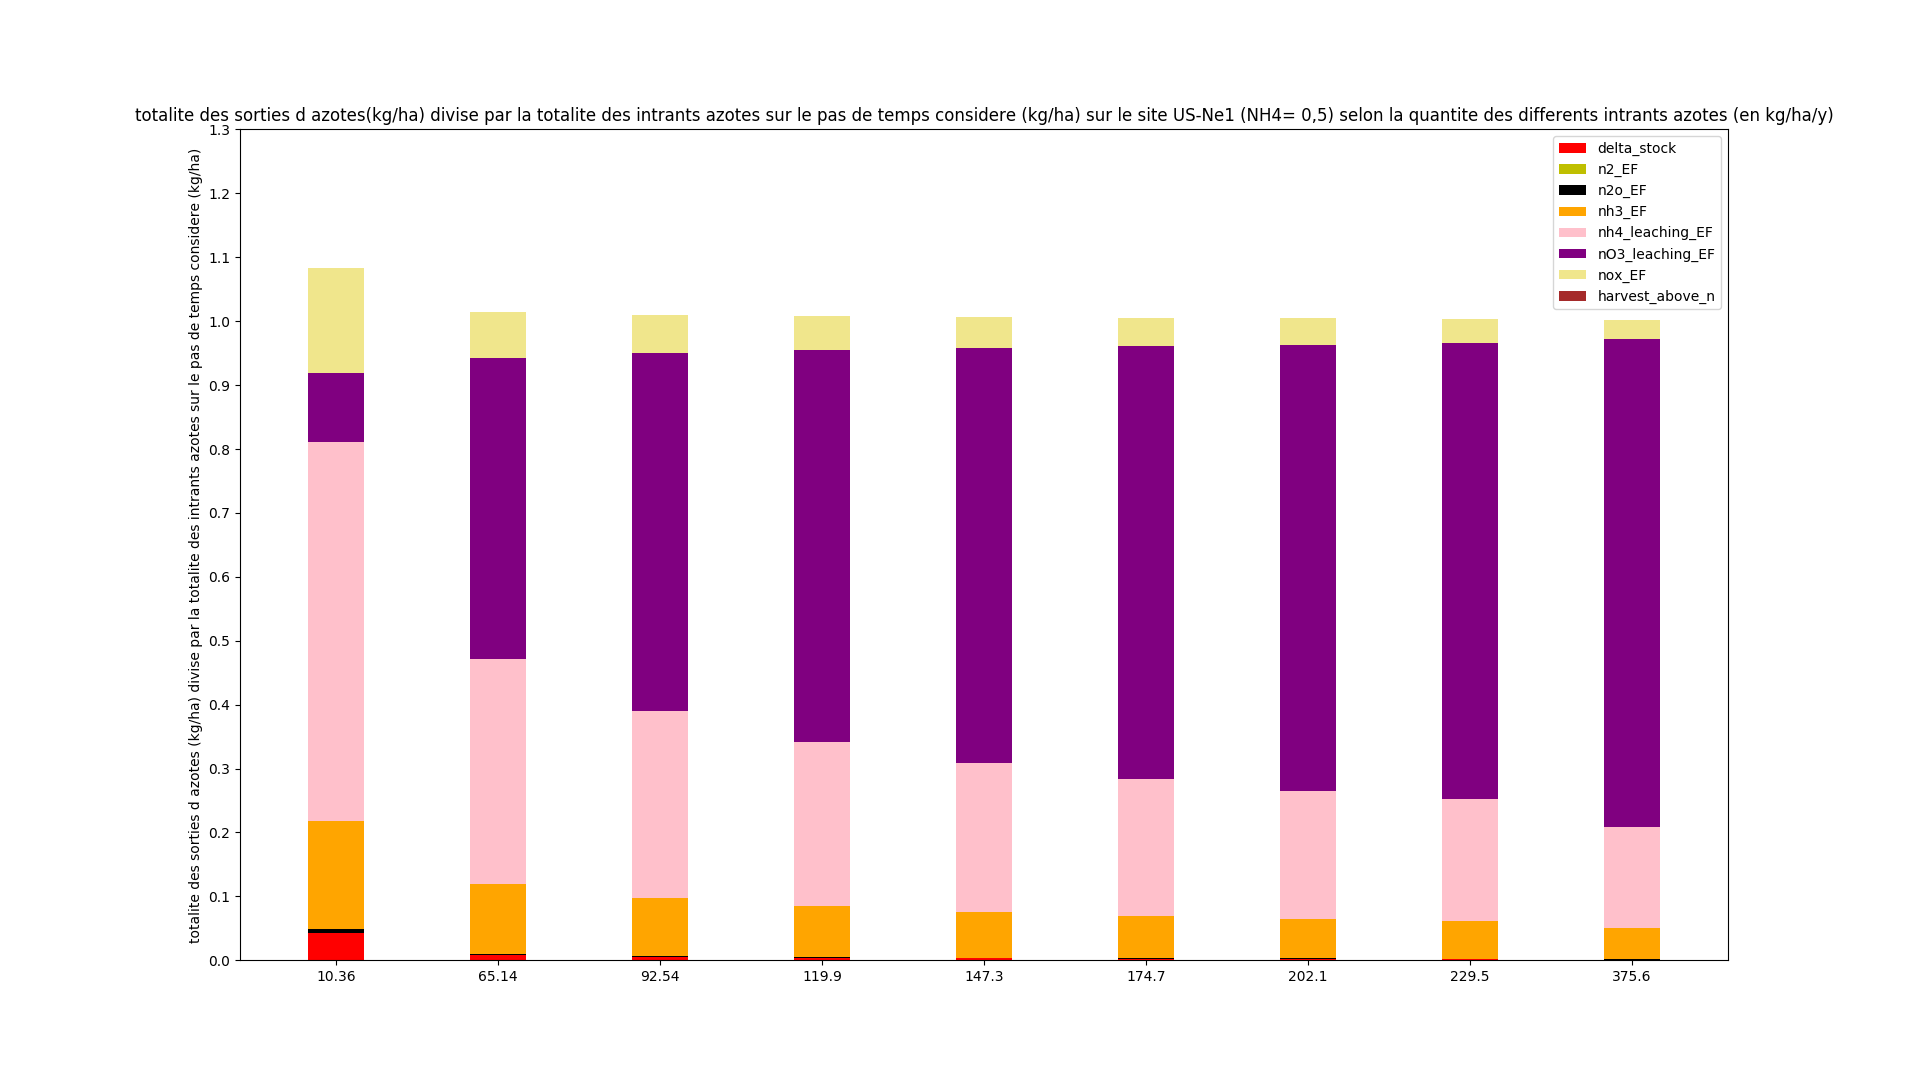
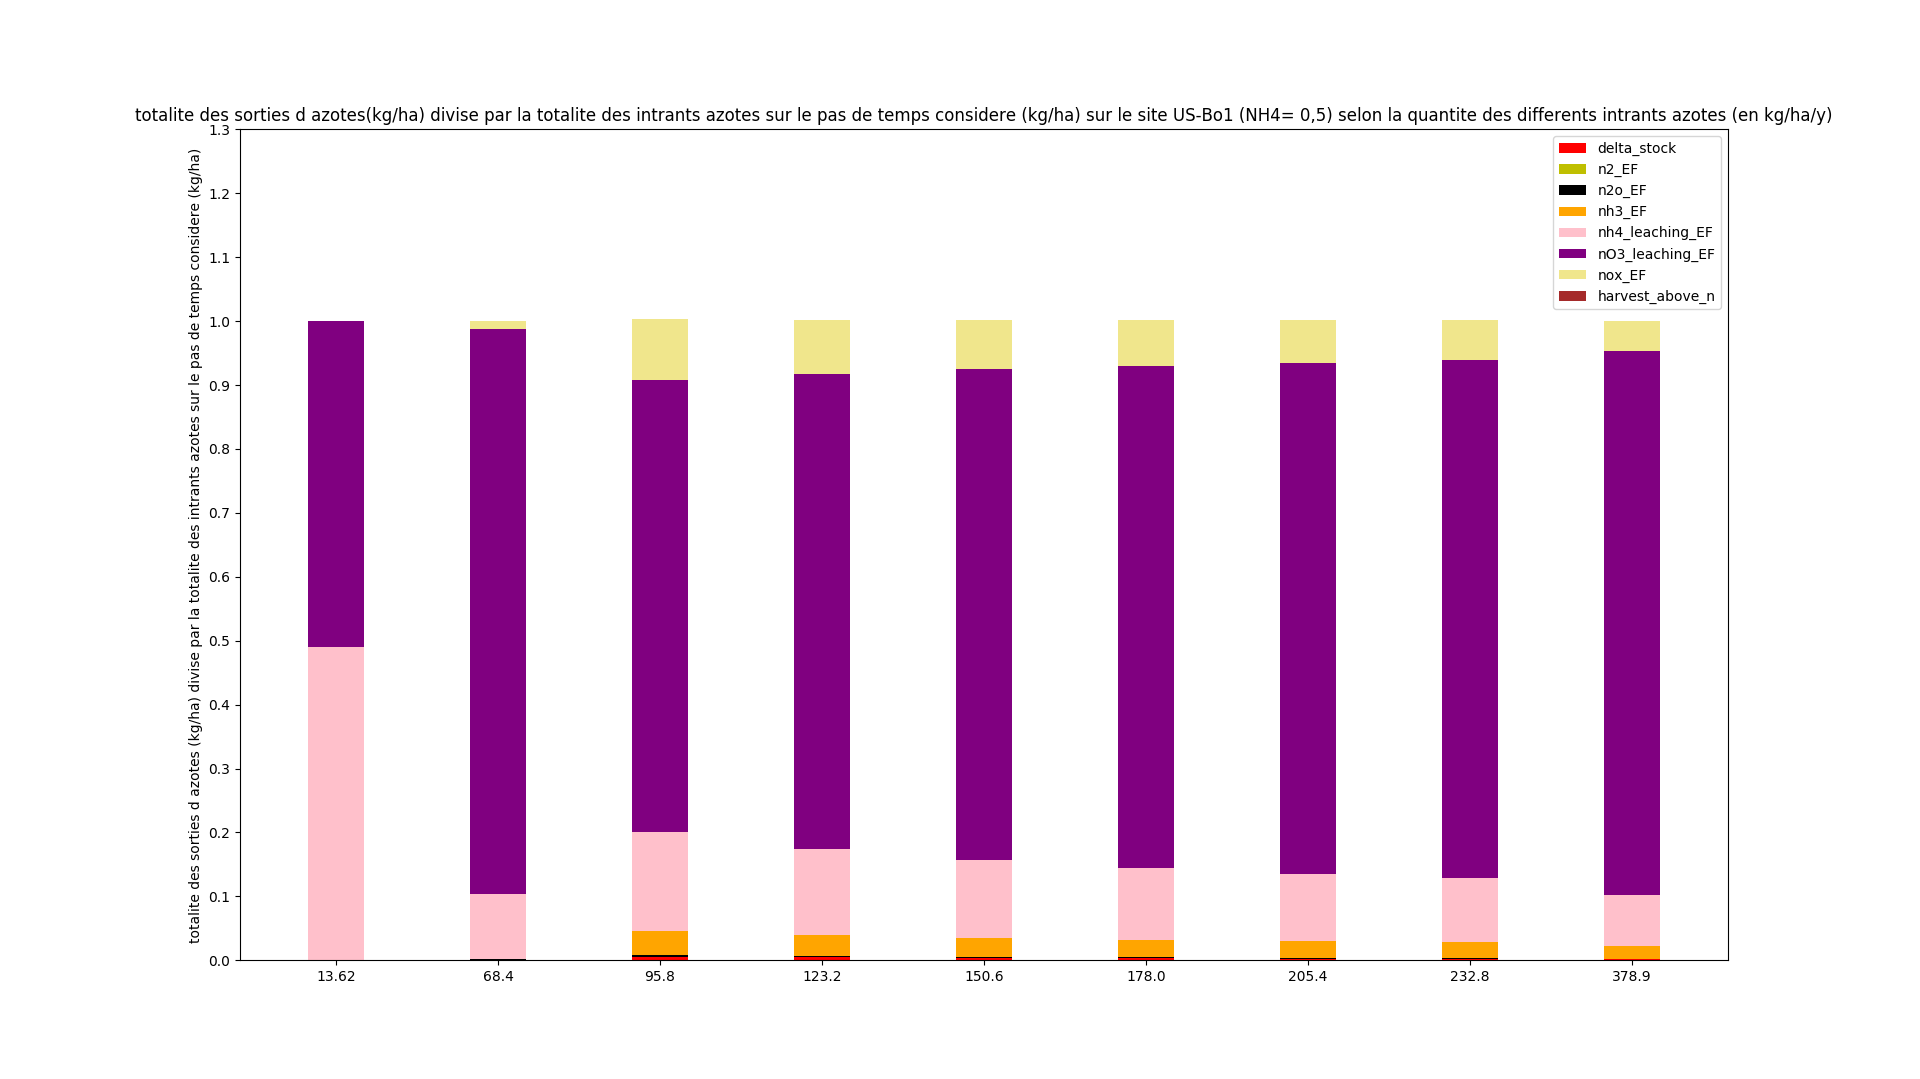
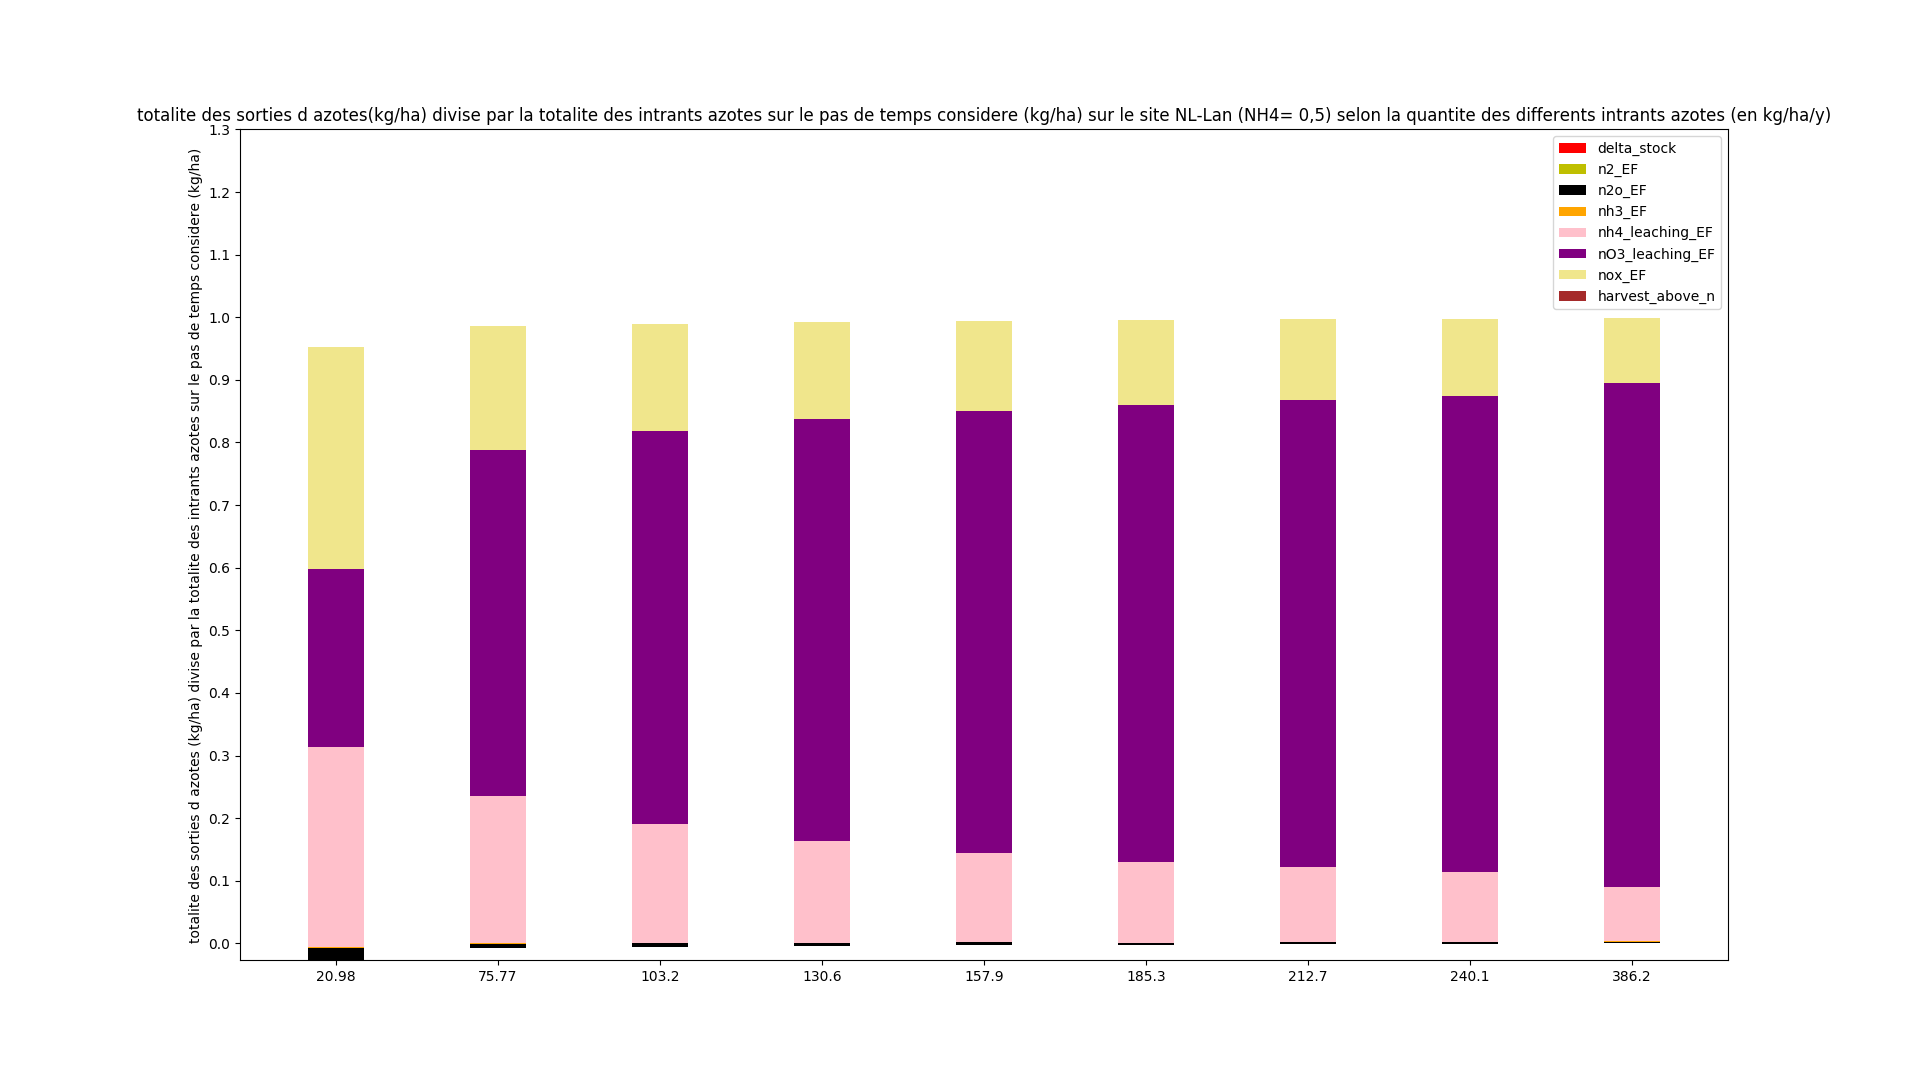
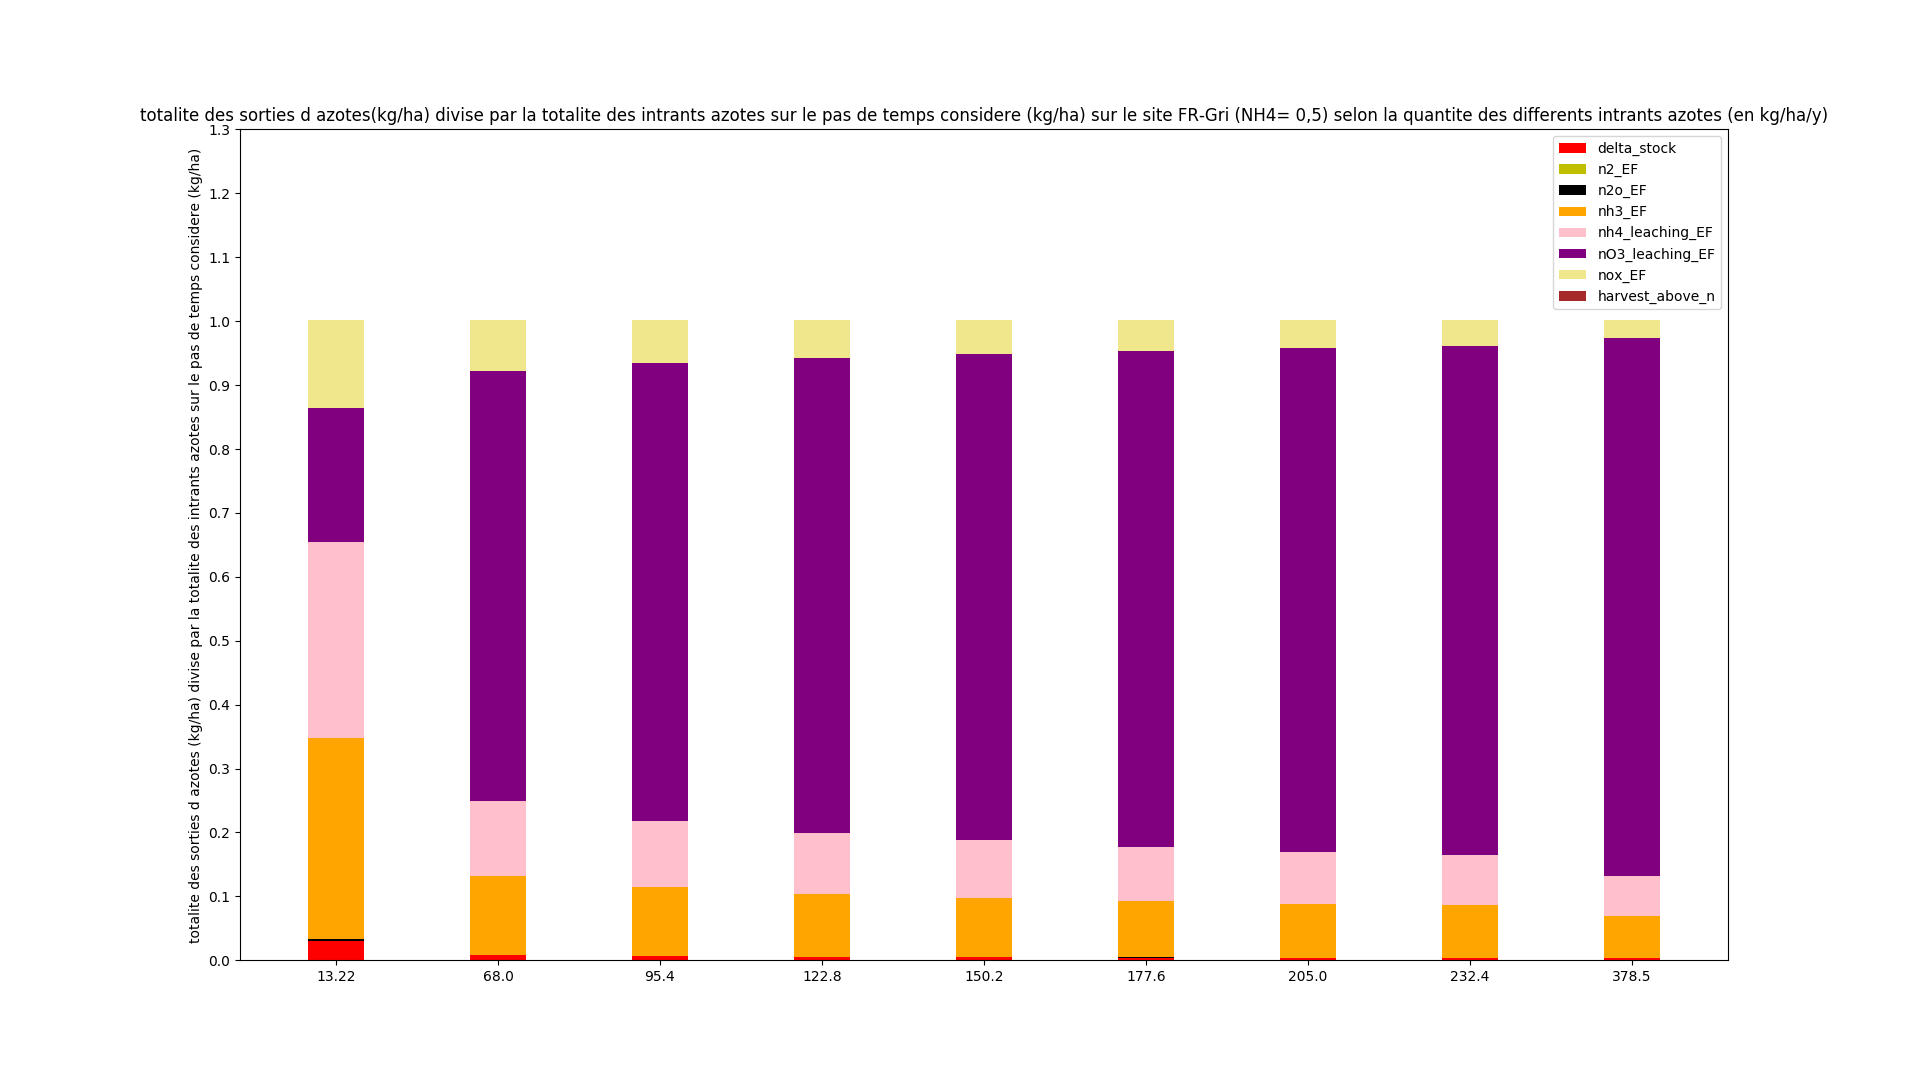
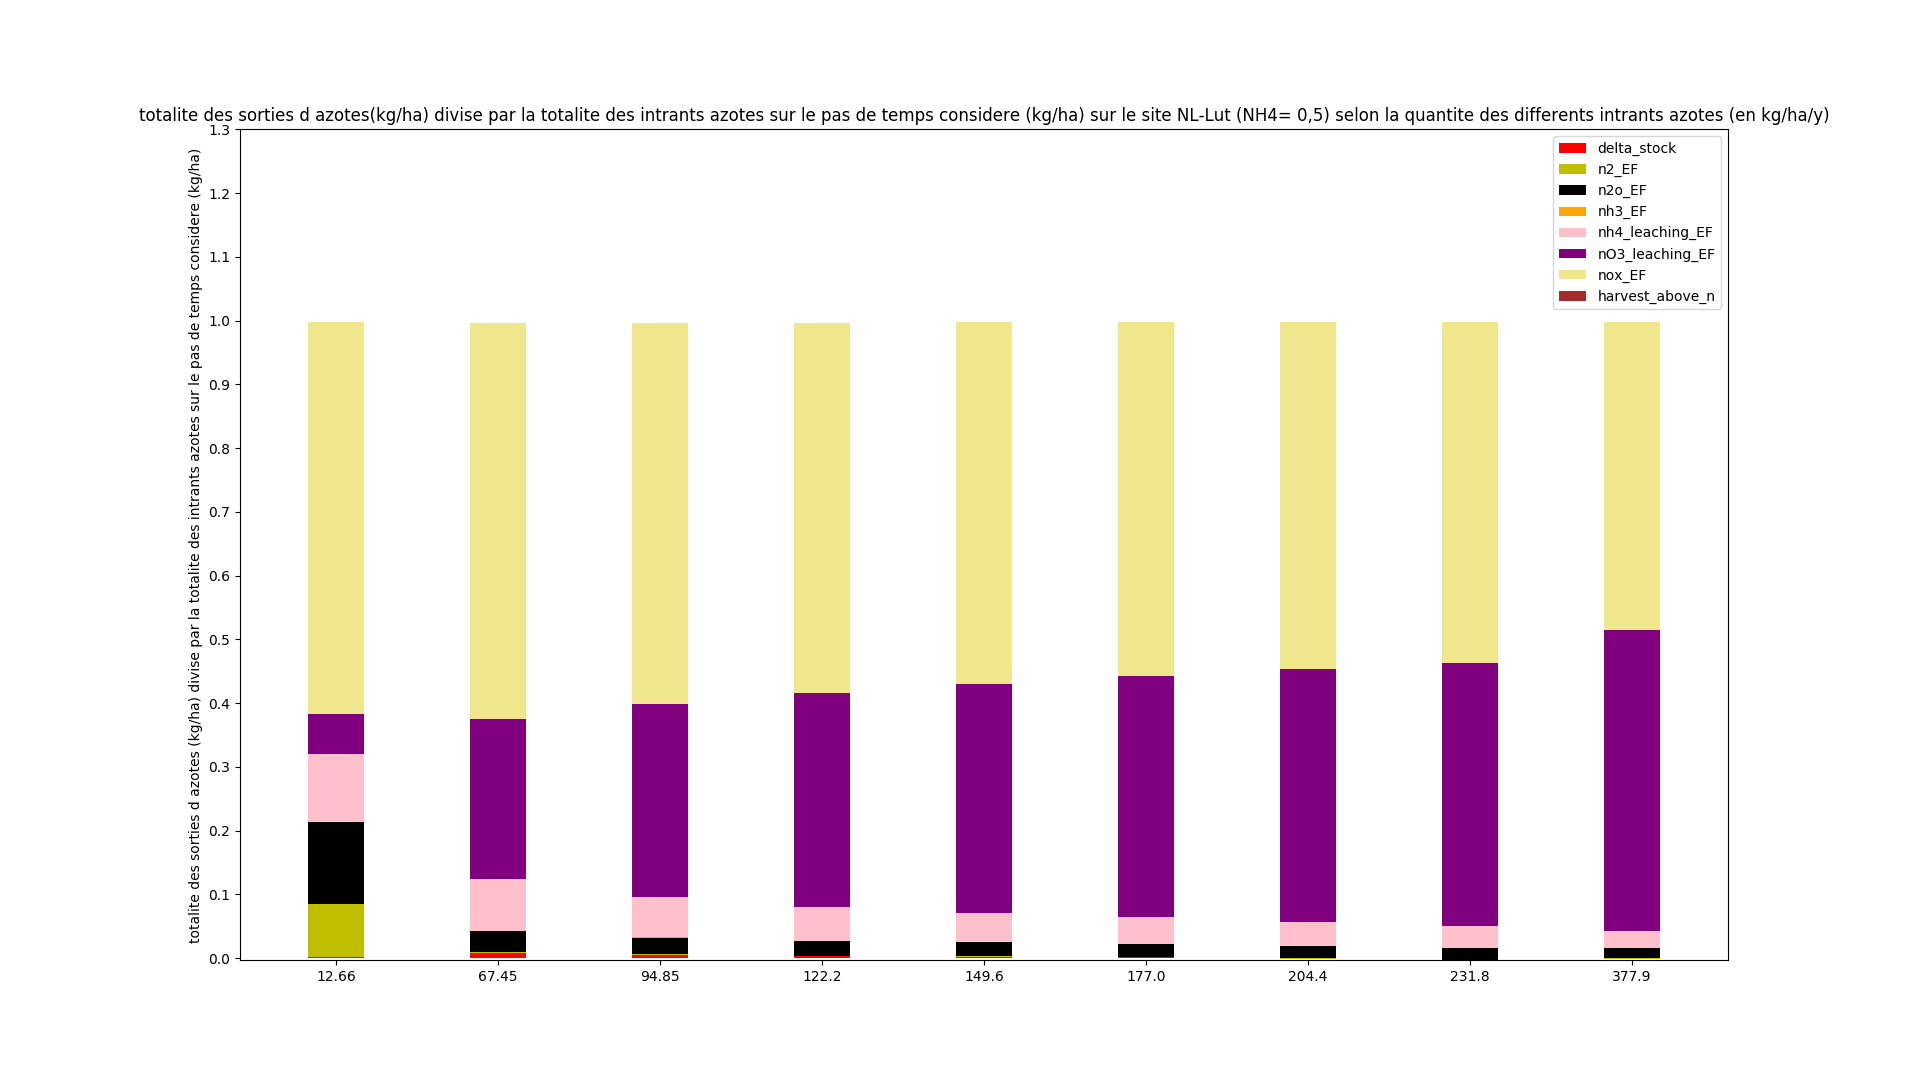
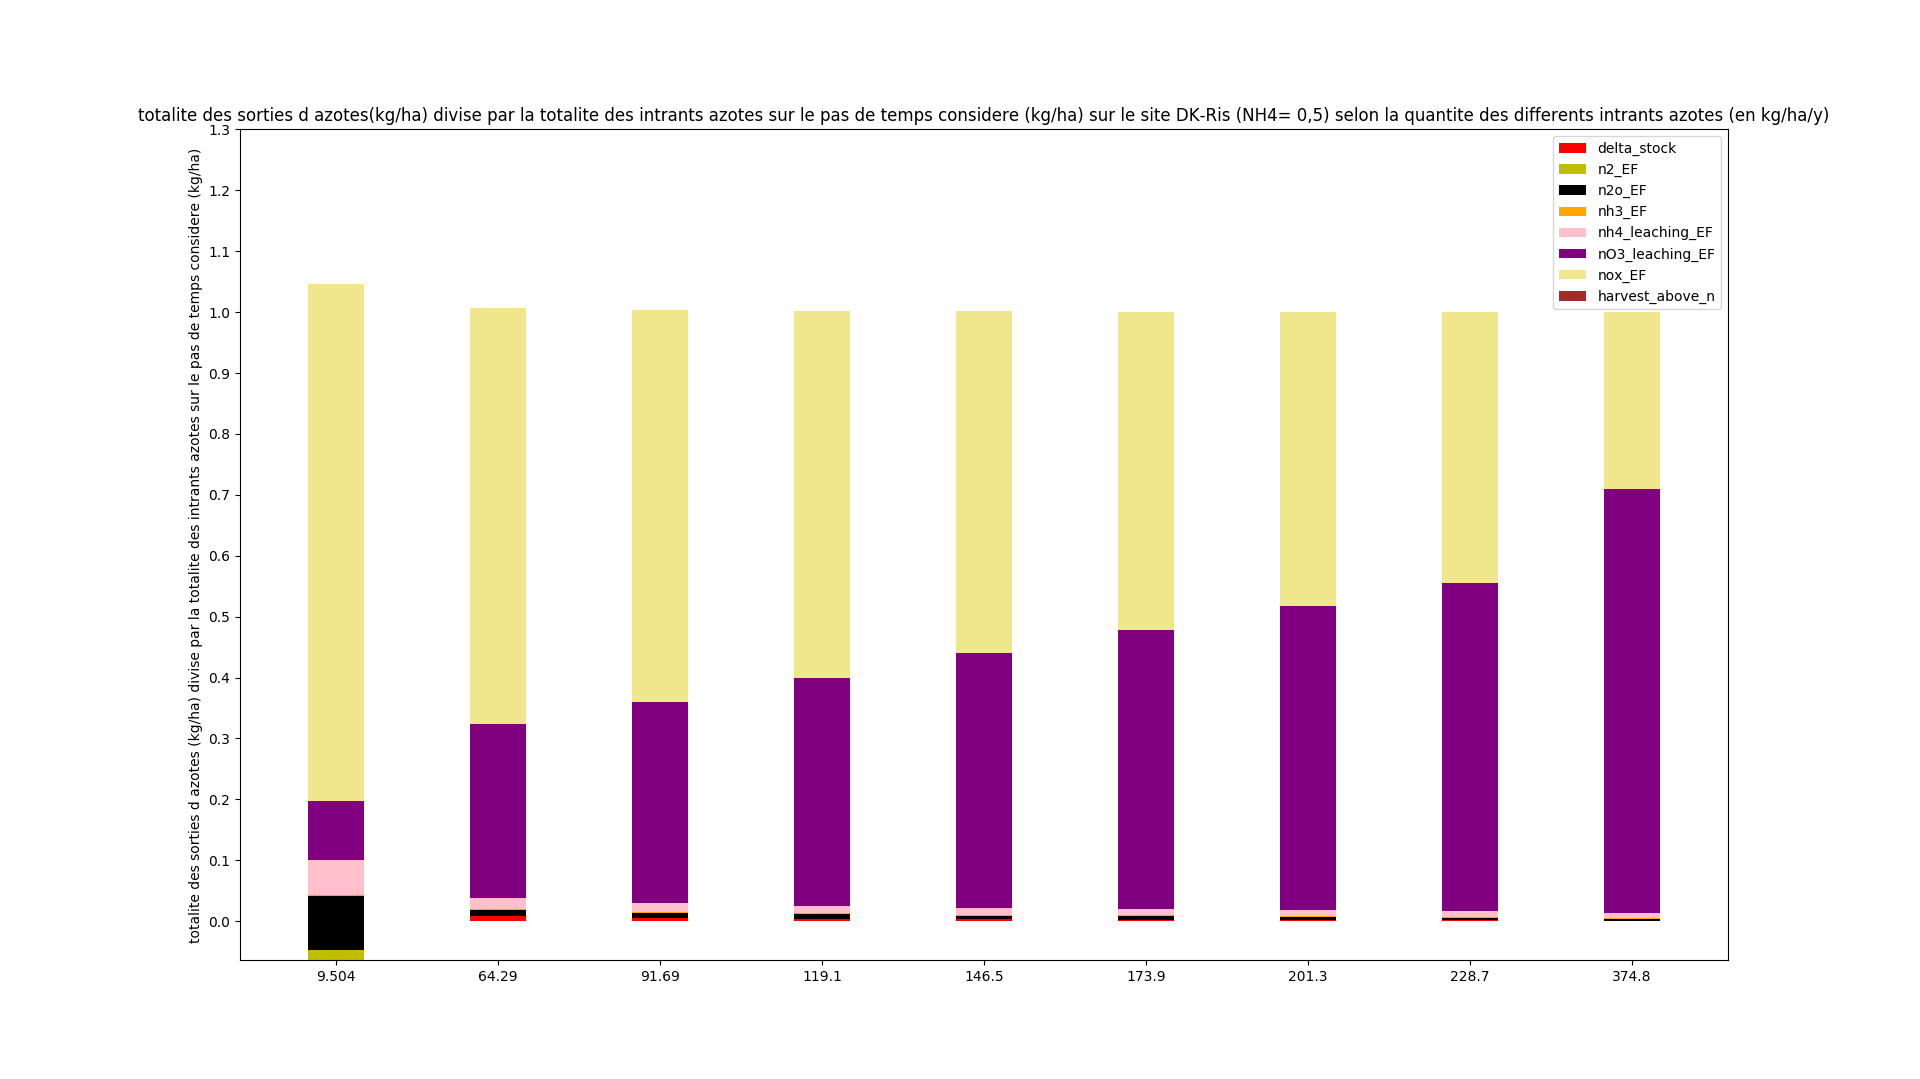
The third (C.) consisted to normalized the fluxes by all nitrogen inputs.
| DK-Ris | |
|---|---|
| 0.5 | 0.8 |
 | 
|
| FR-Gri | |
|---|---|
| 0.5 | 0.8 |
 | 
|
| NL-Lan | |
|---|---|
| 0.5 | 0.8 |
 | 
|
| NL-Lut | |
|---|---|
| 0.5 | 0.8 |
 | 
|
| US-Bo1 | |
|---|---|
| 0.5 | 0.8 |
 | 
|
| US-Ne1 | |
|---|---|
| 0.5 | 0.8 |
 | 
|
| US-Ne2 | |
|---|---|
| 0.5 | 0.8 |
 | 
|
| US-Ne3 | |
|---|---|
| 0.5 | 0.8 |
 | 
|
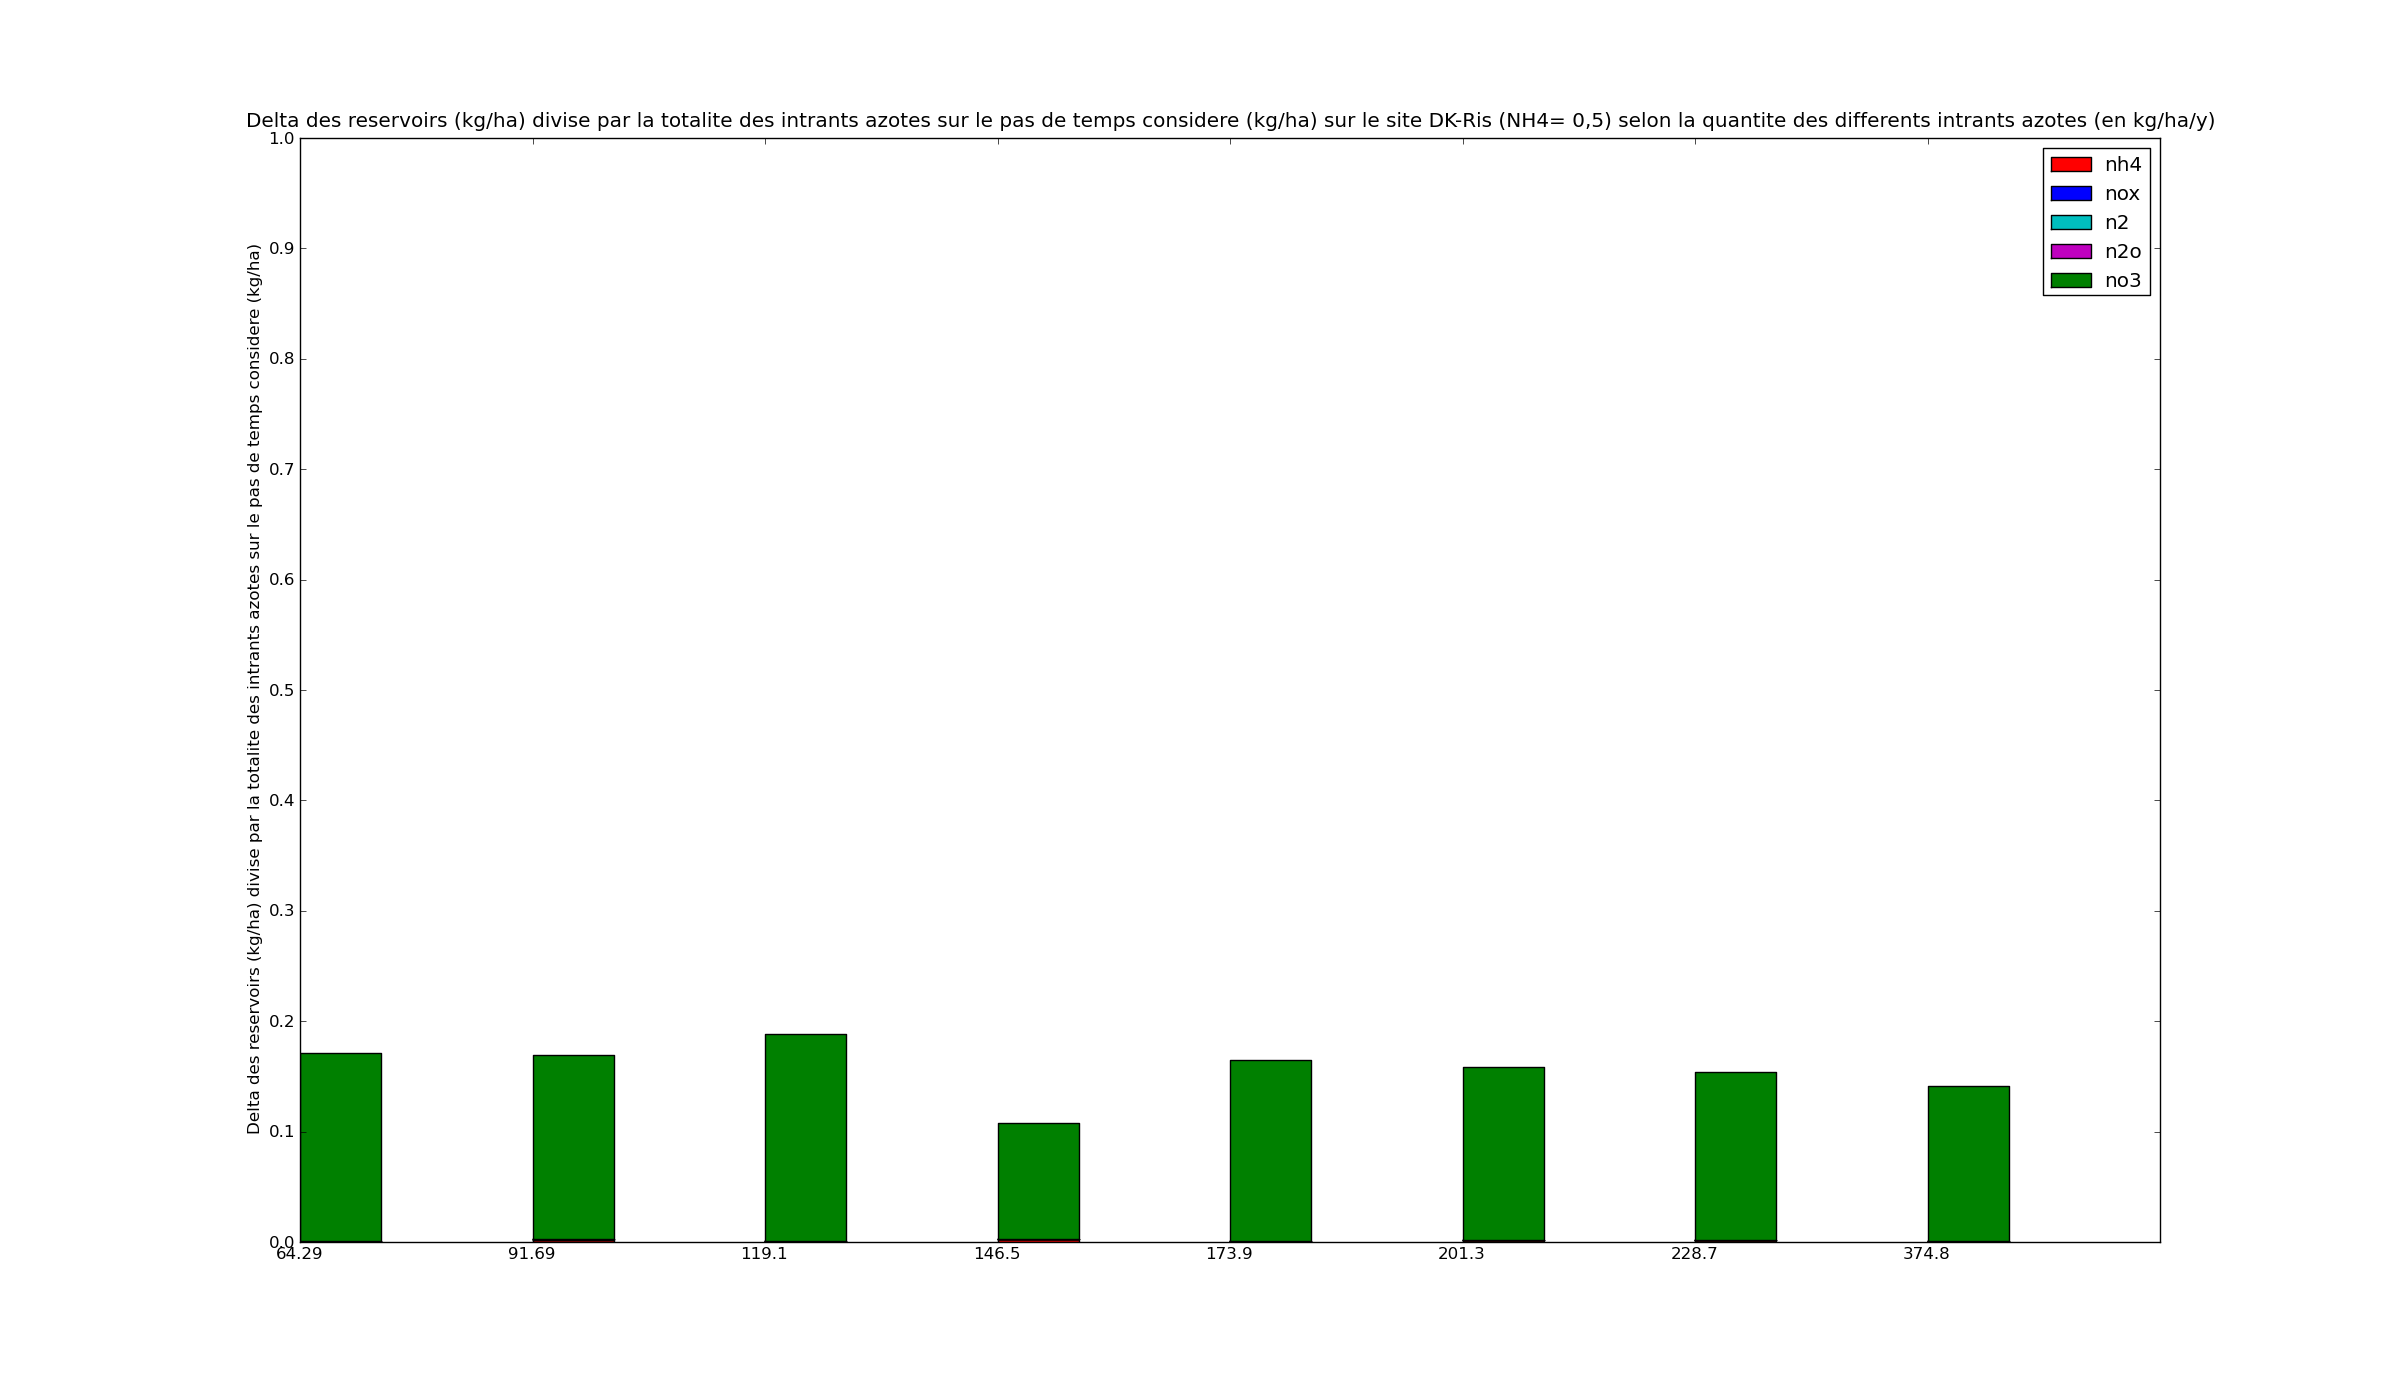
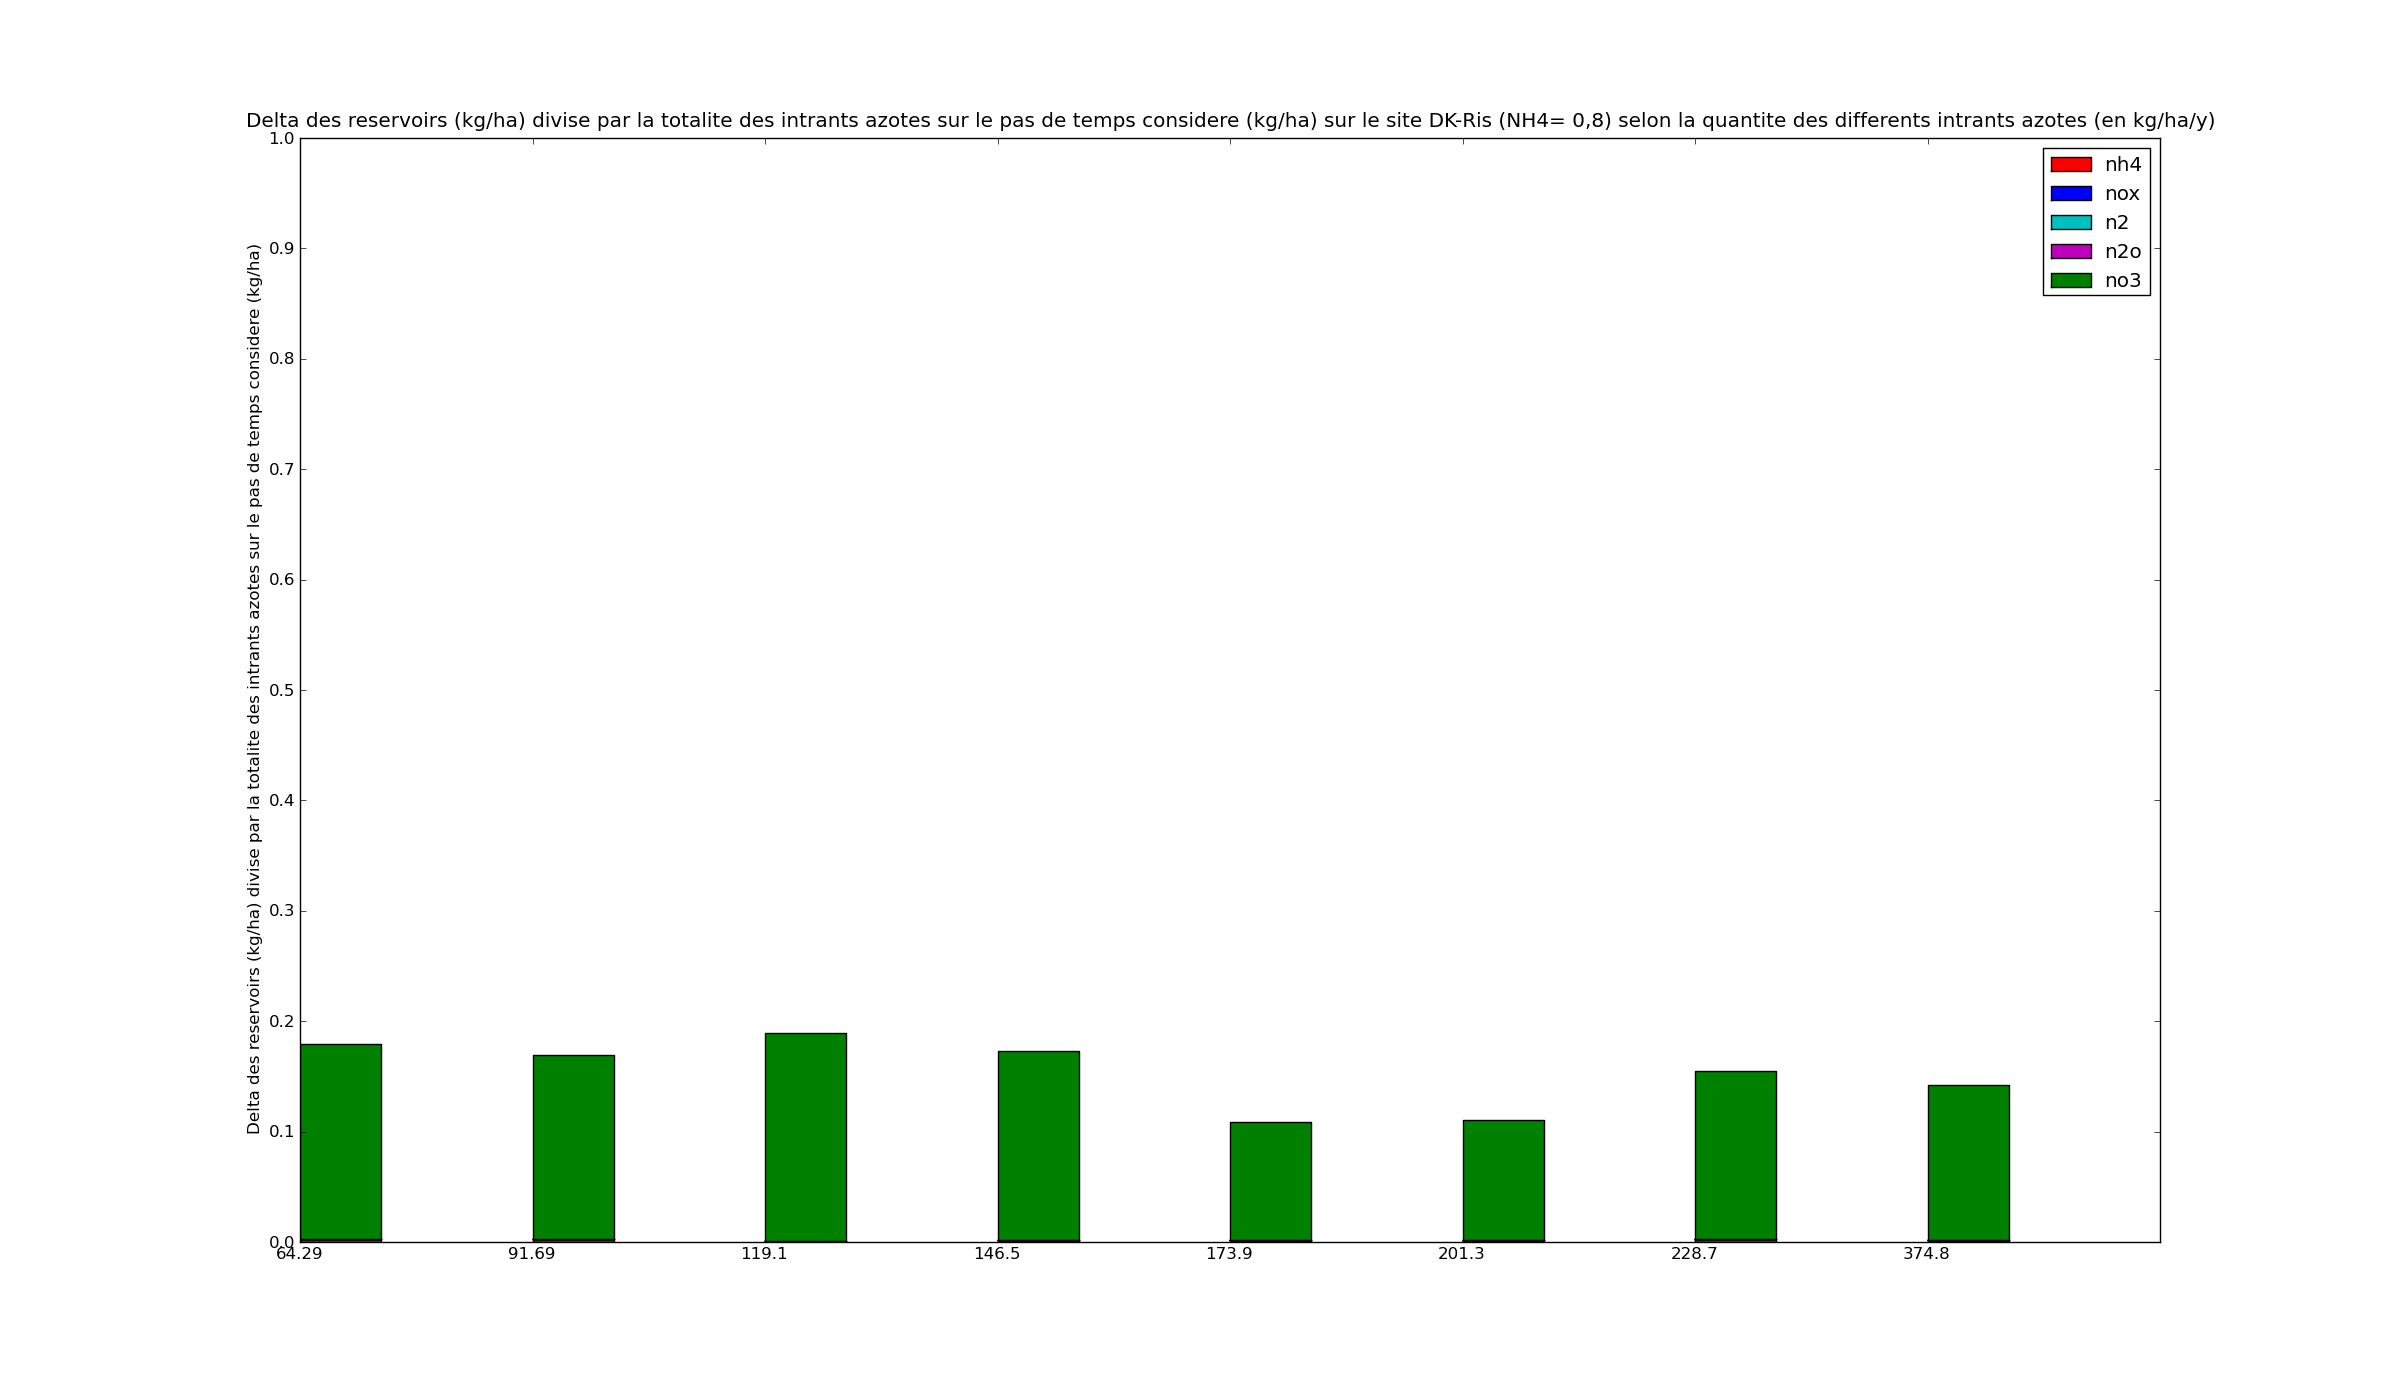
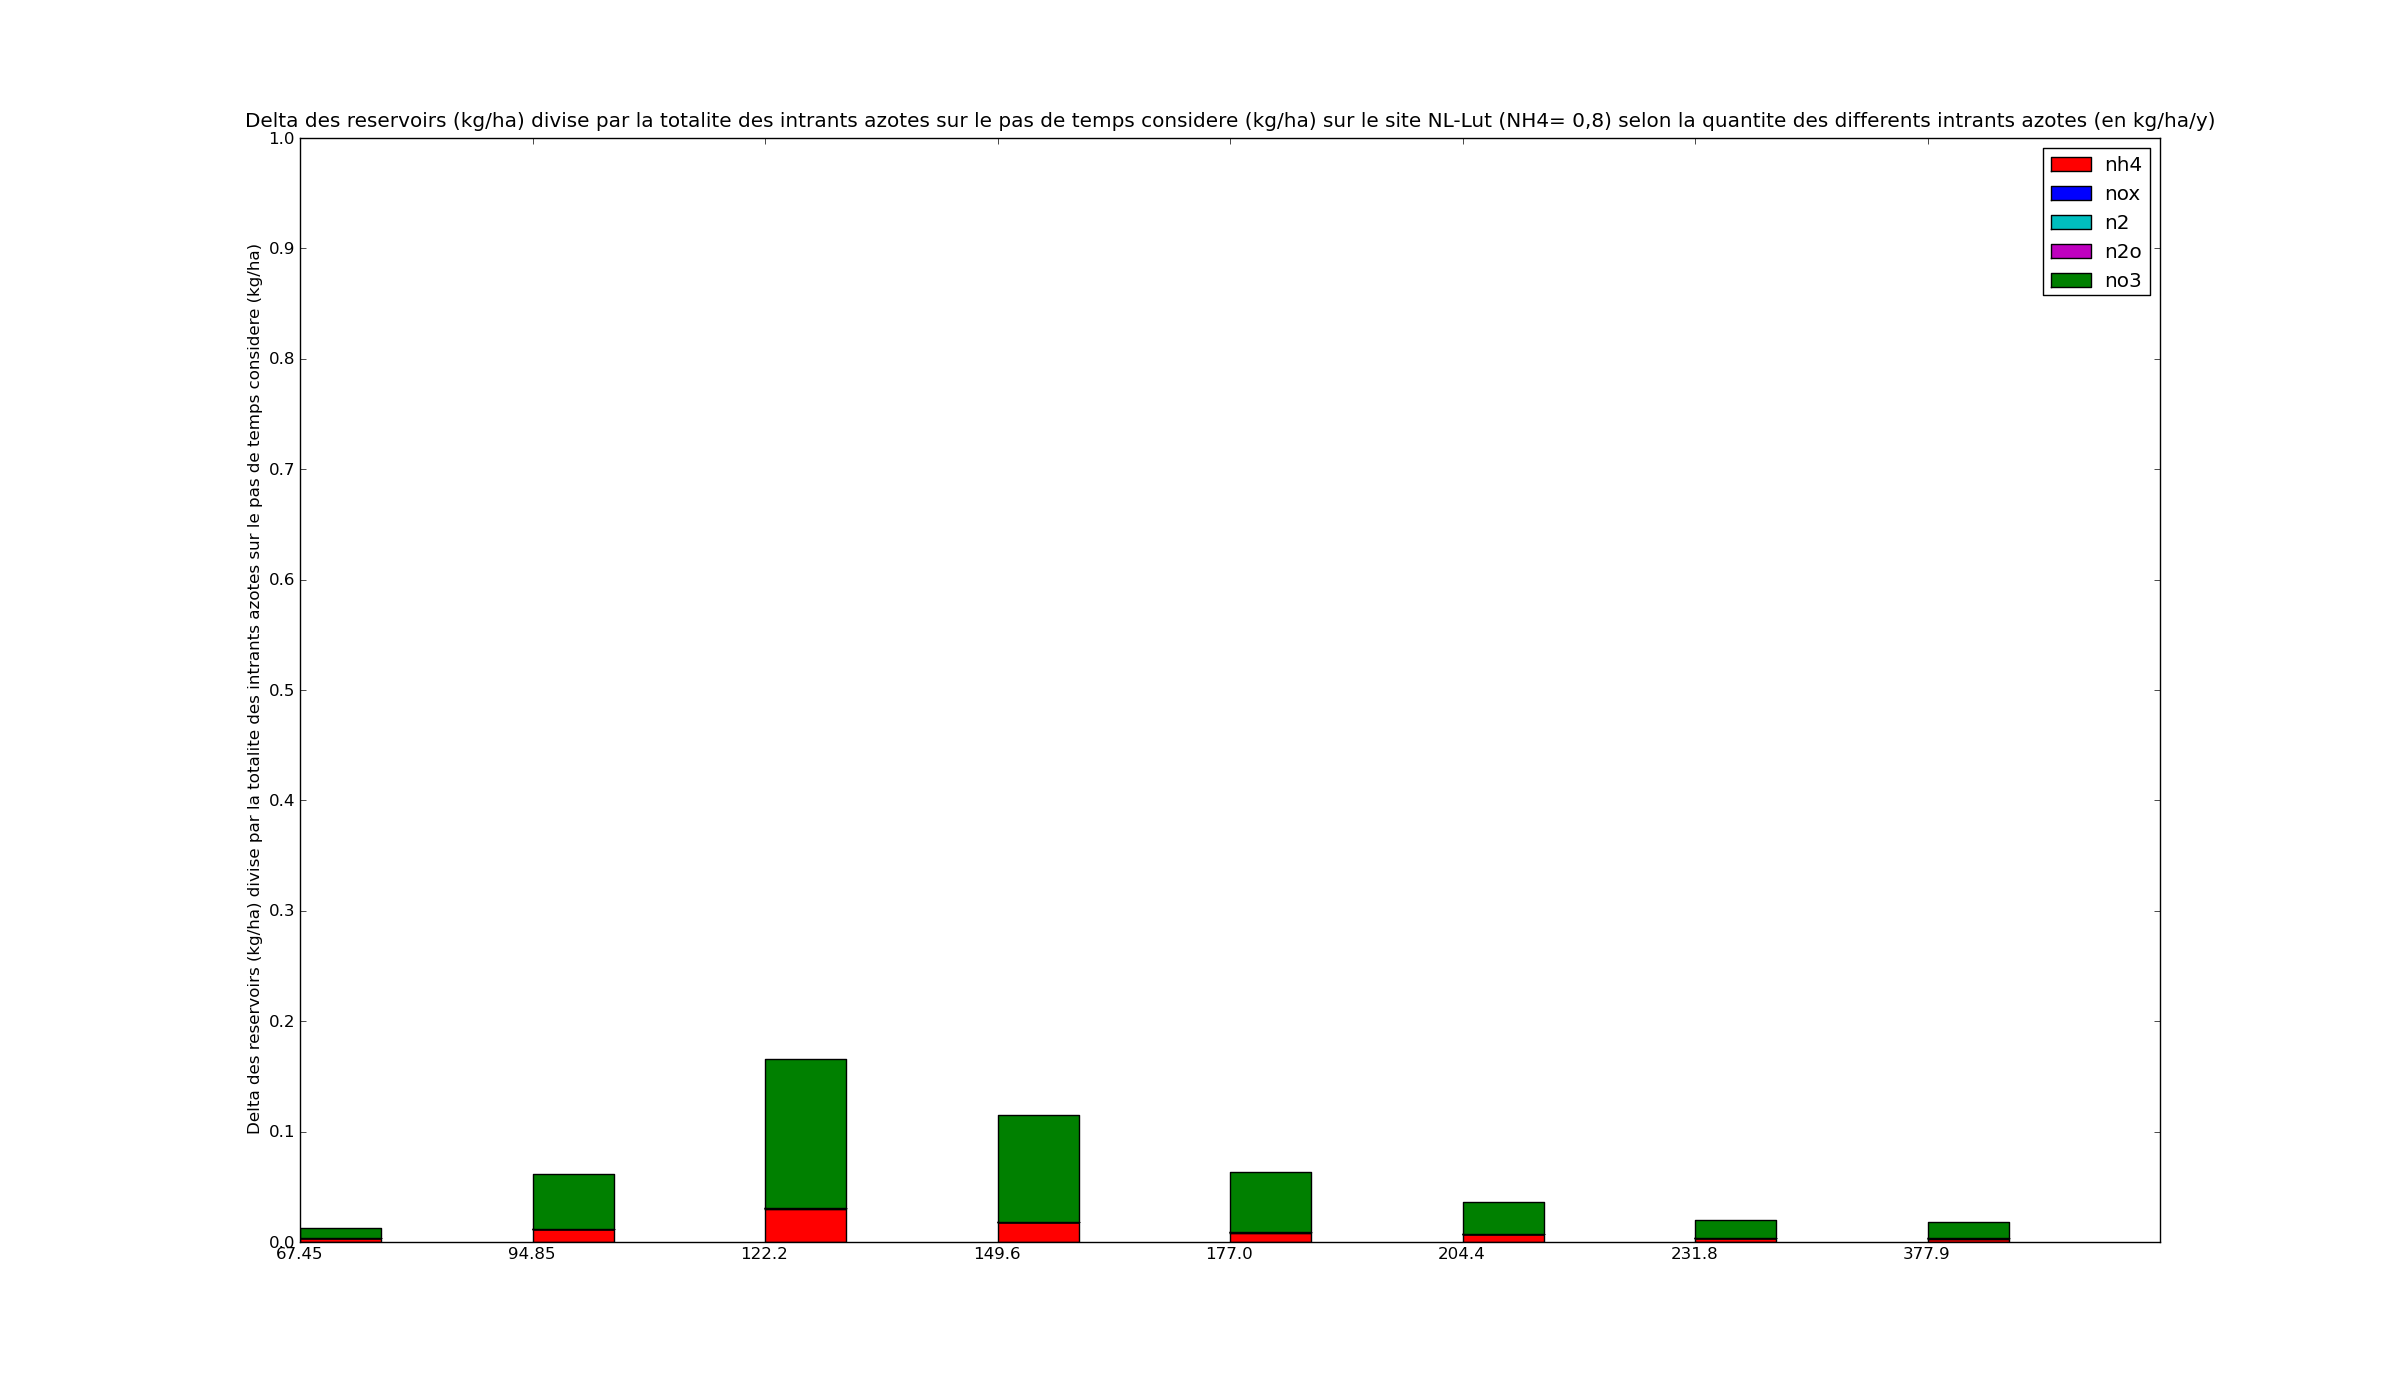
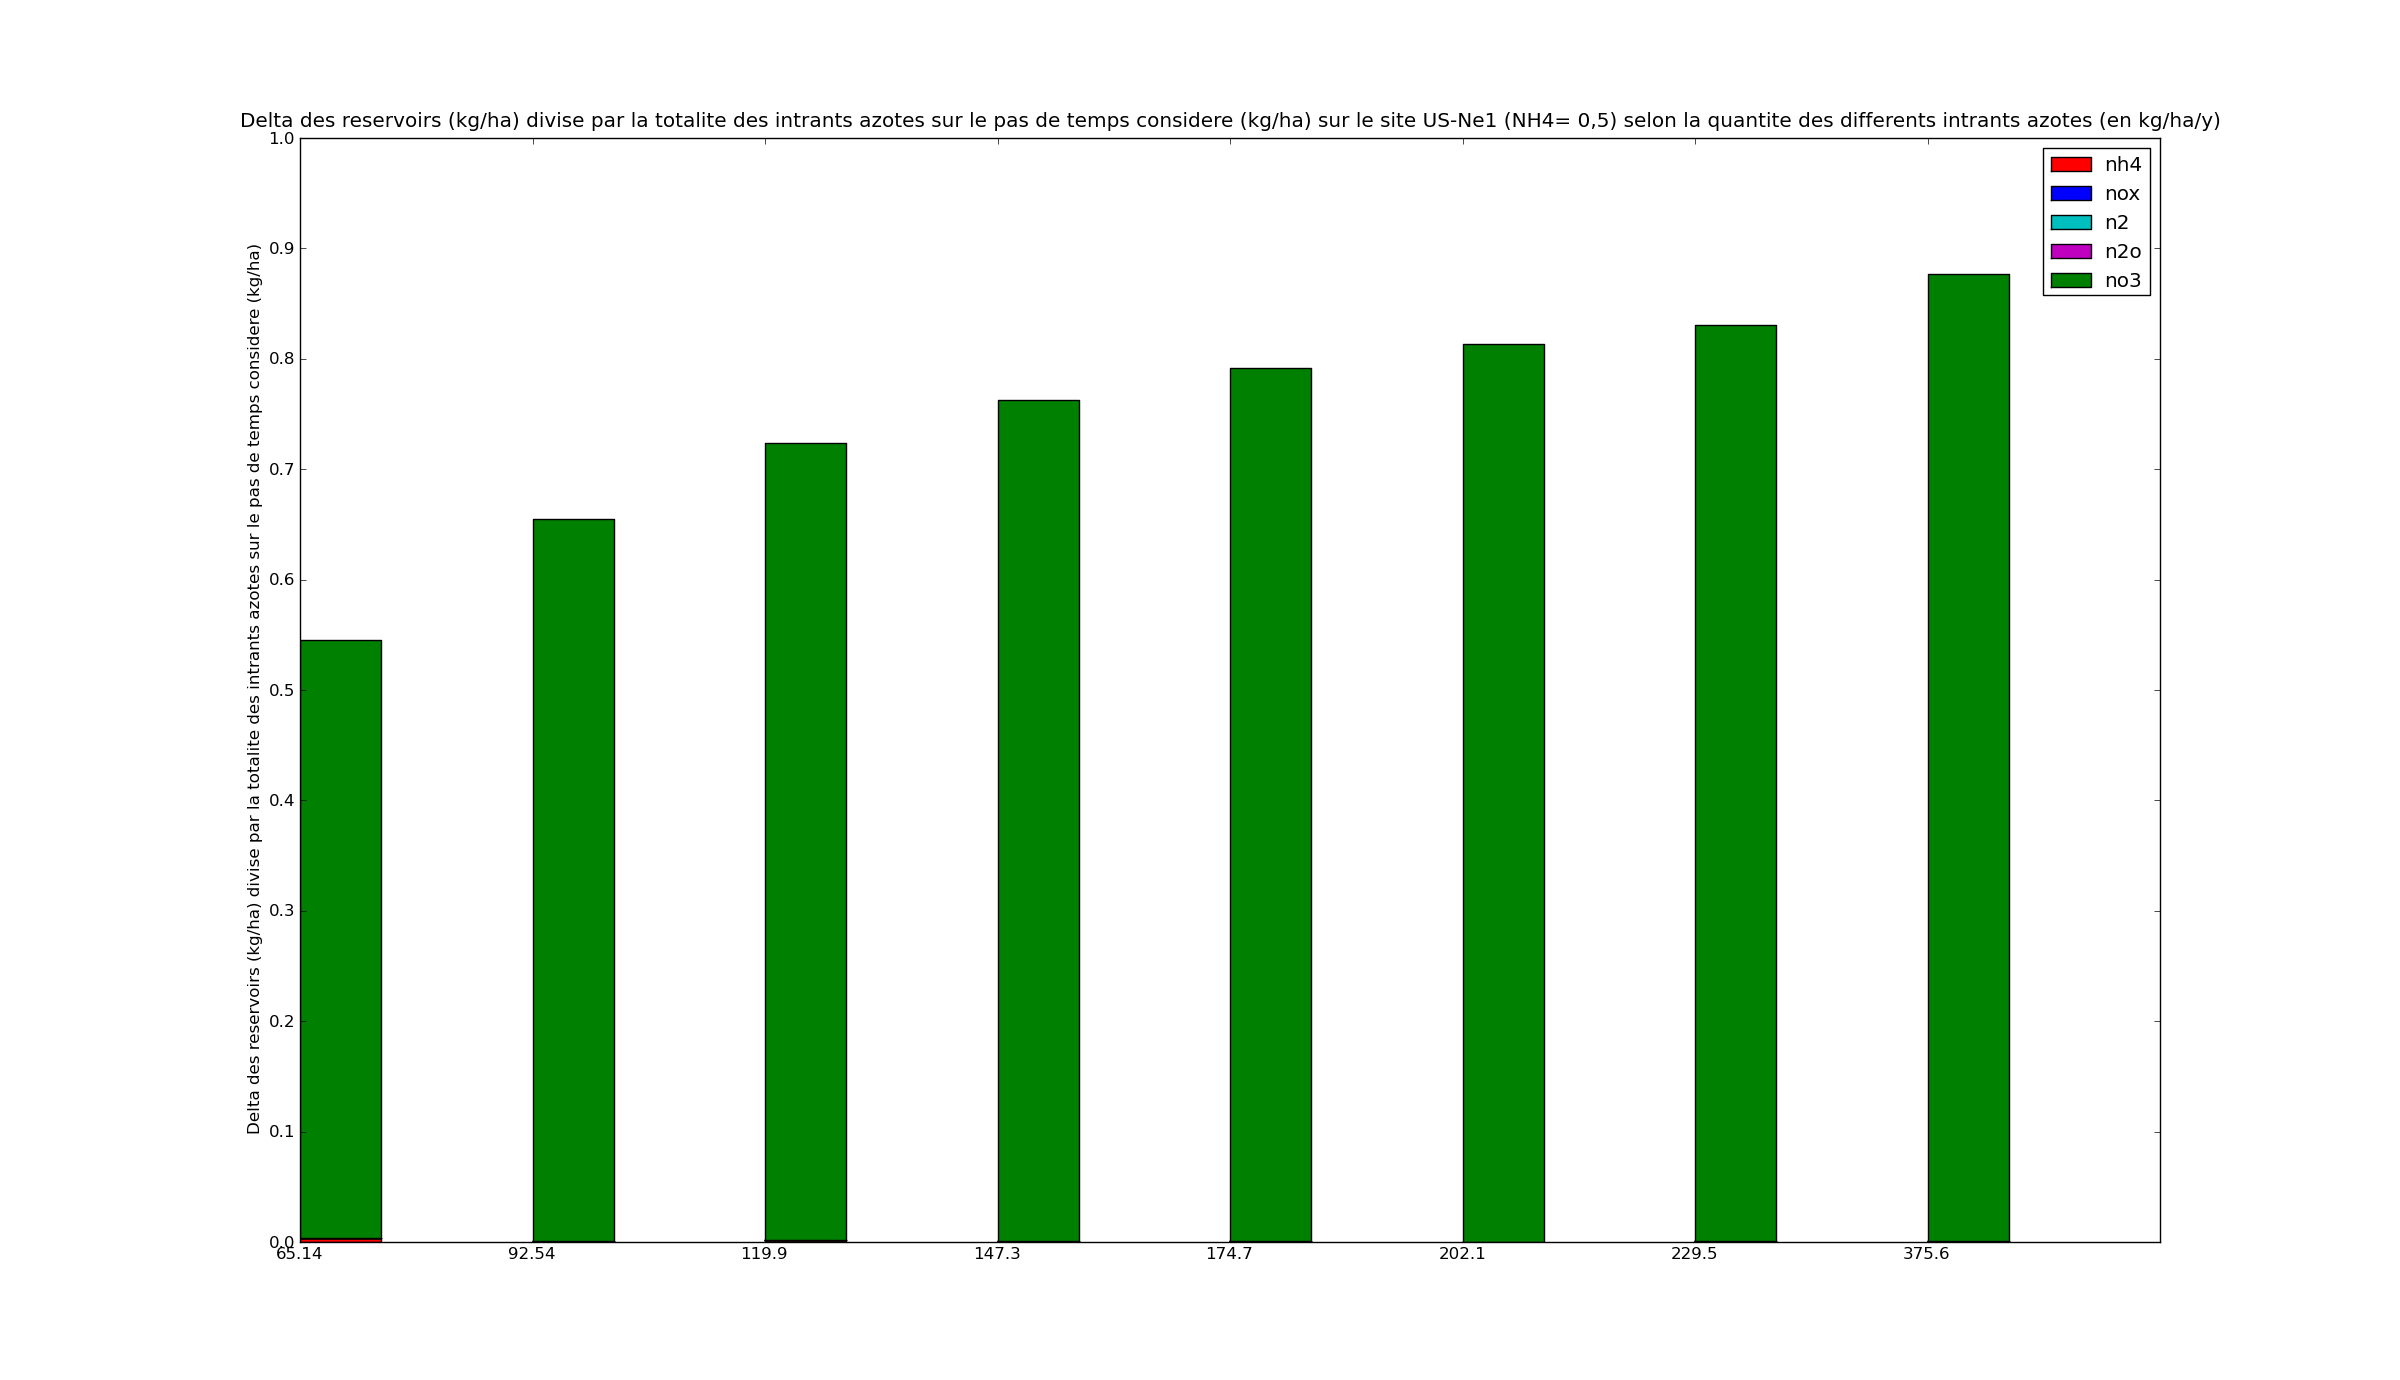
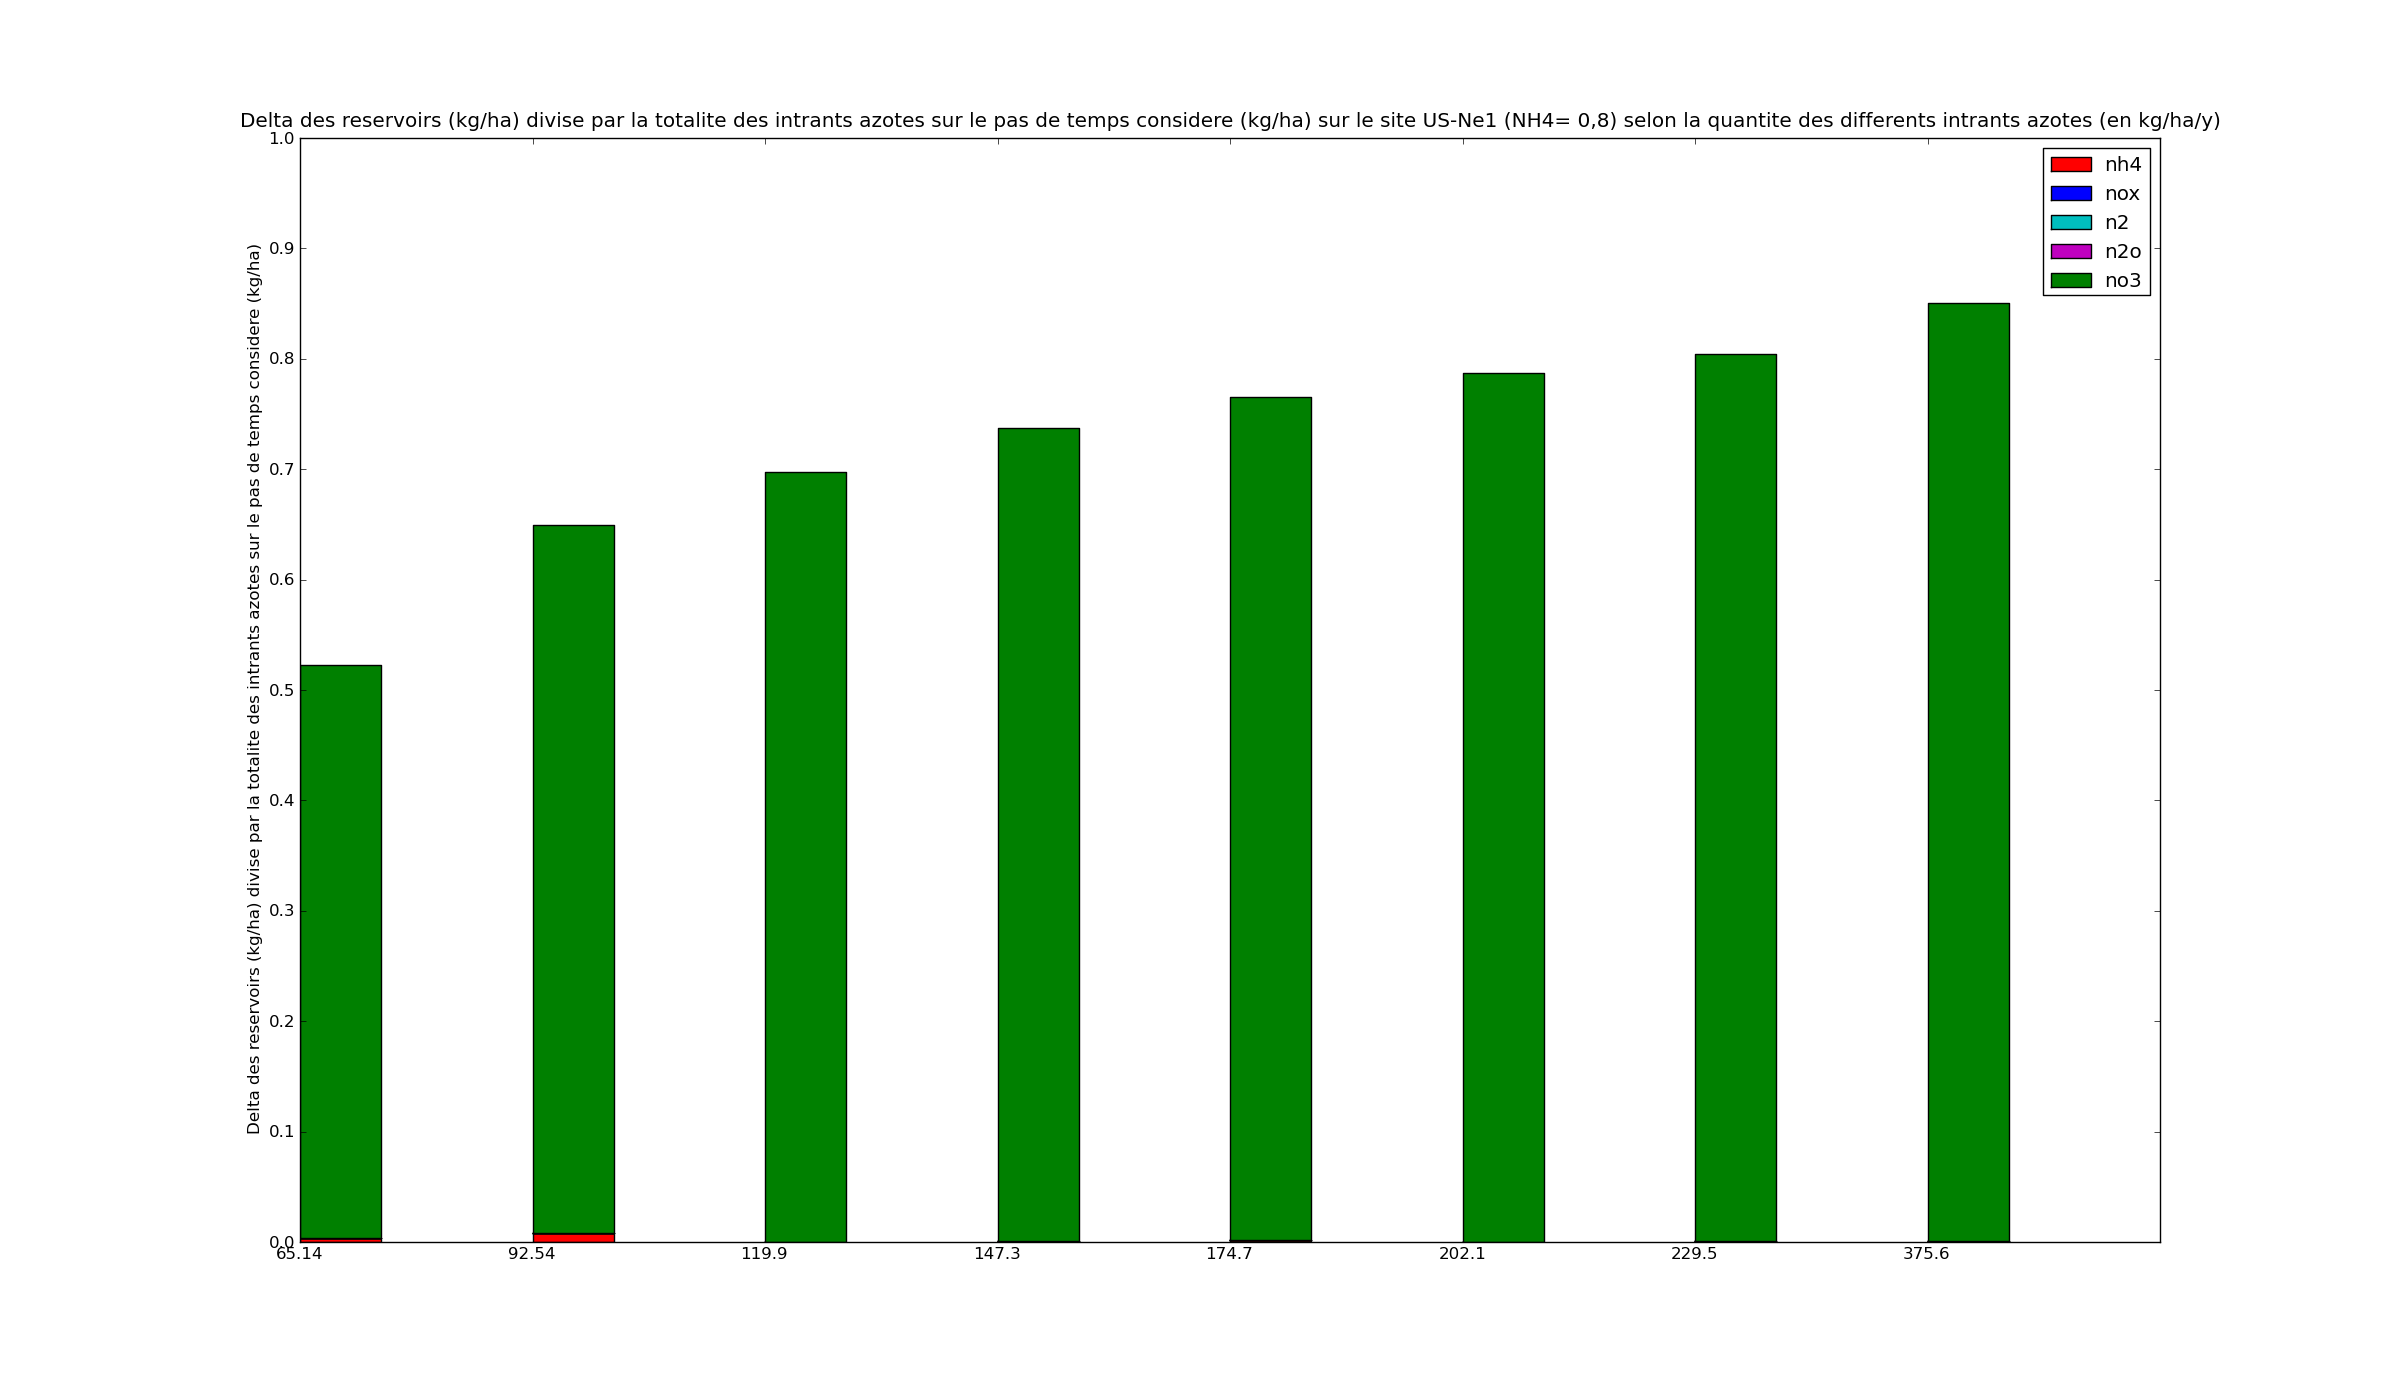
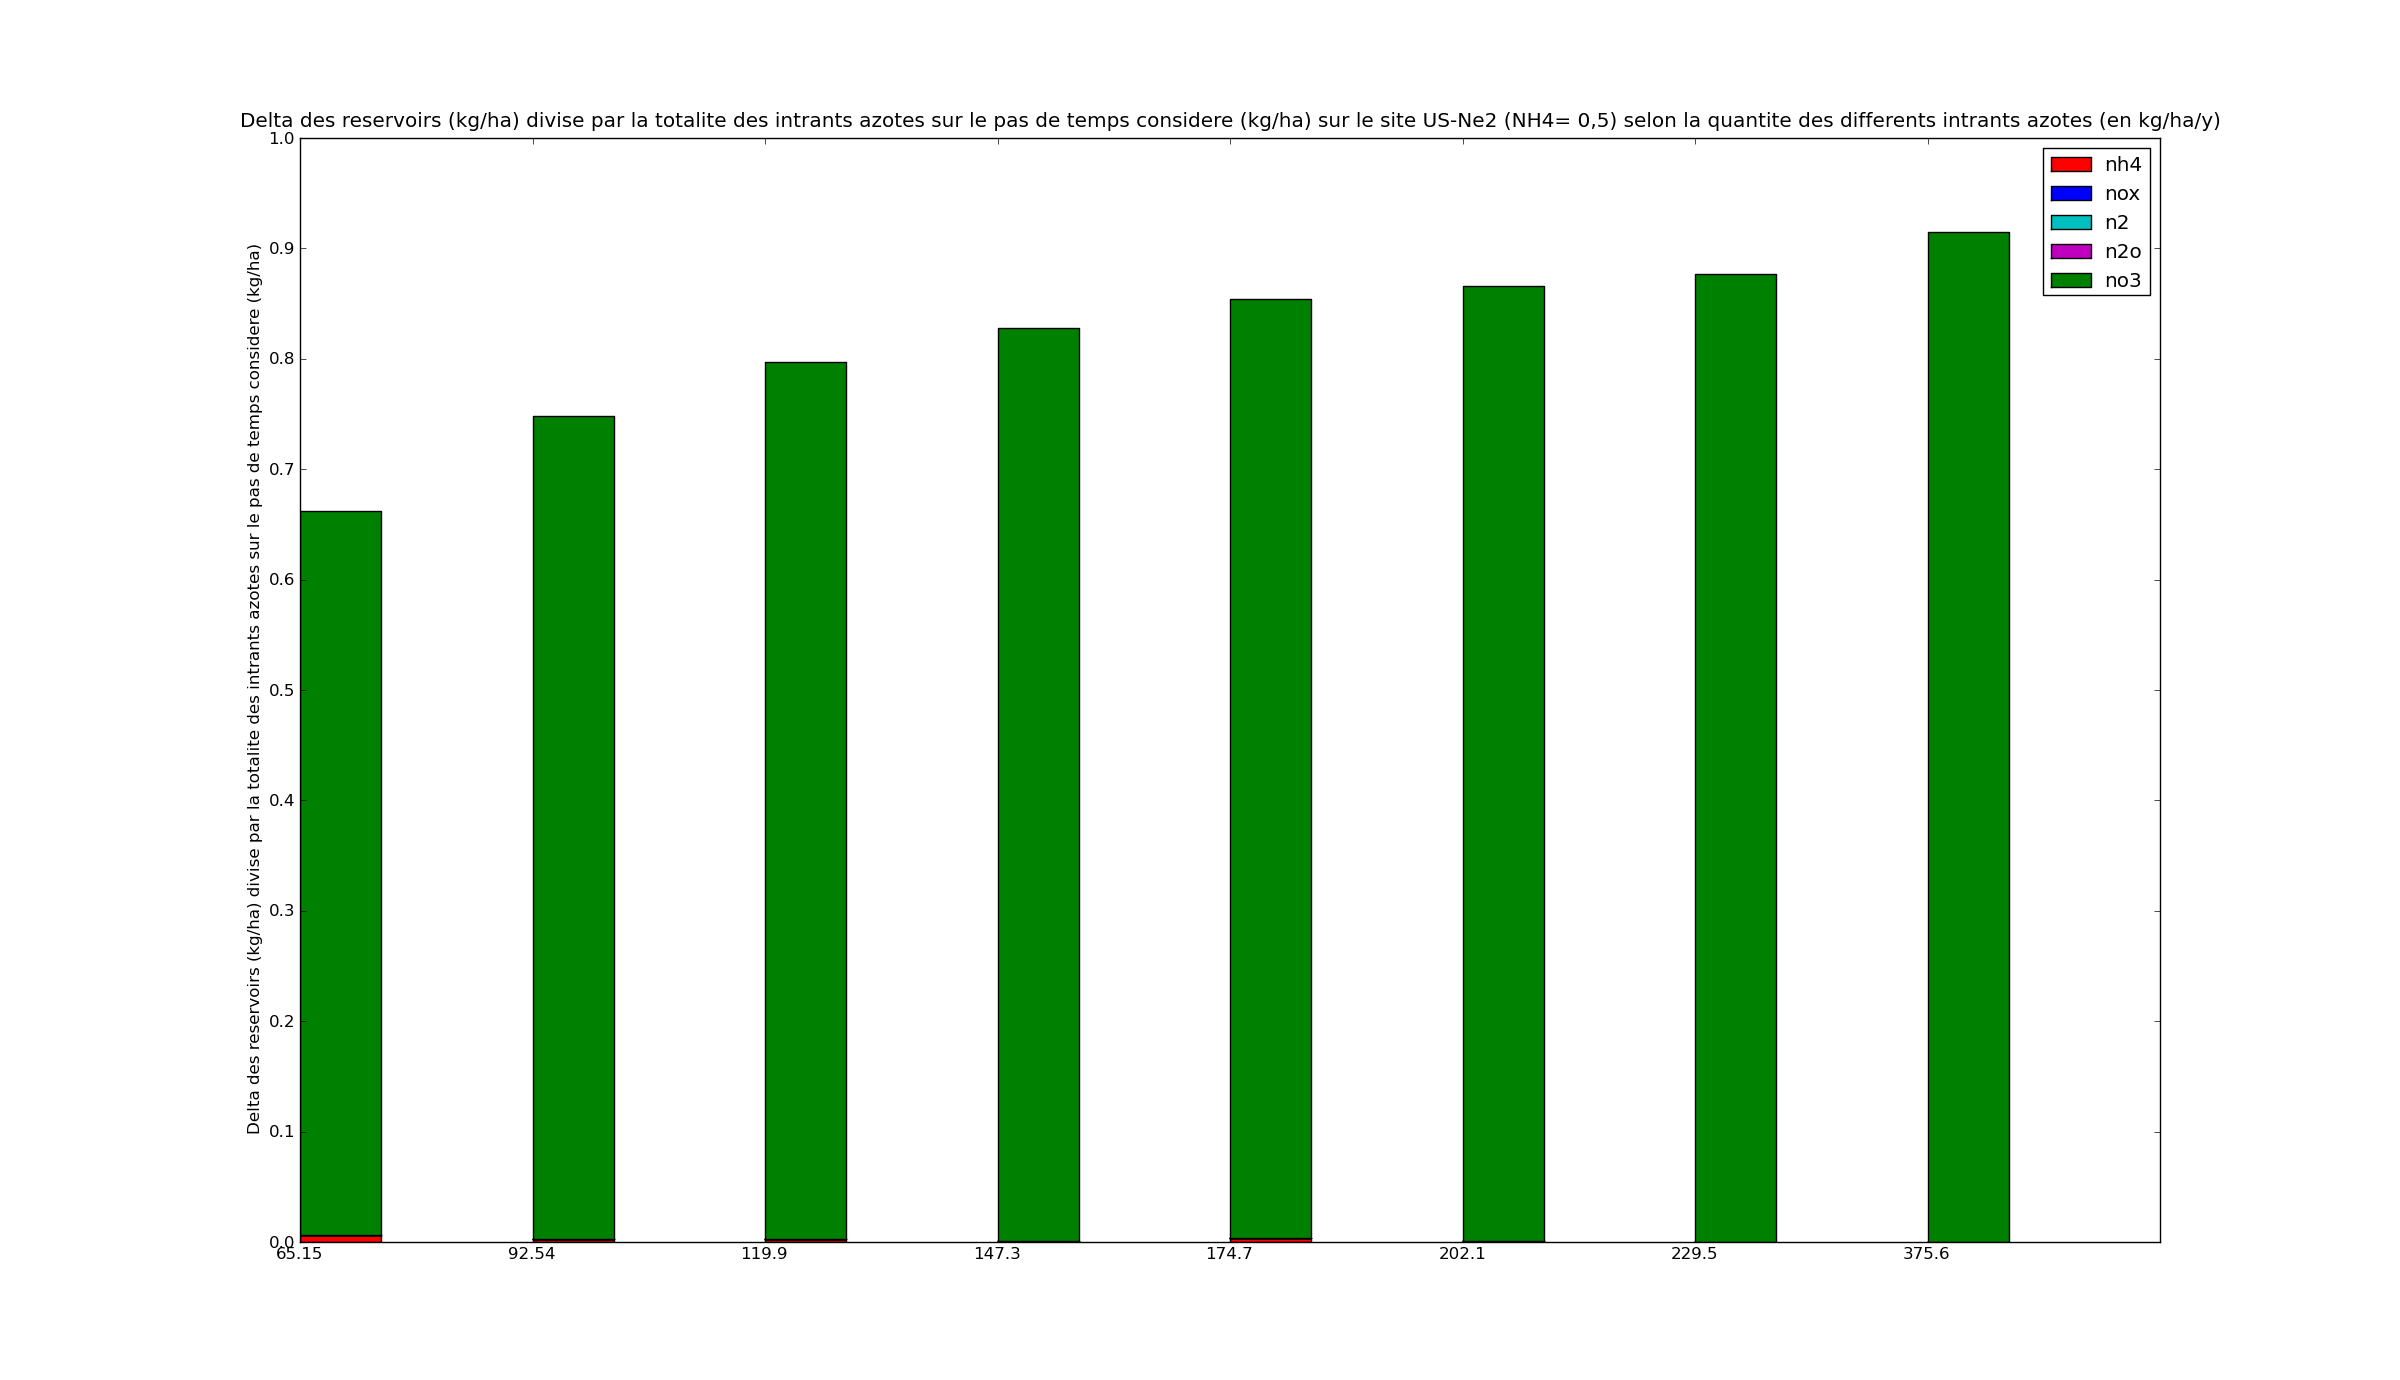
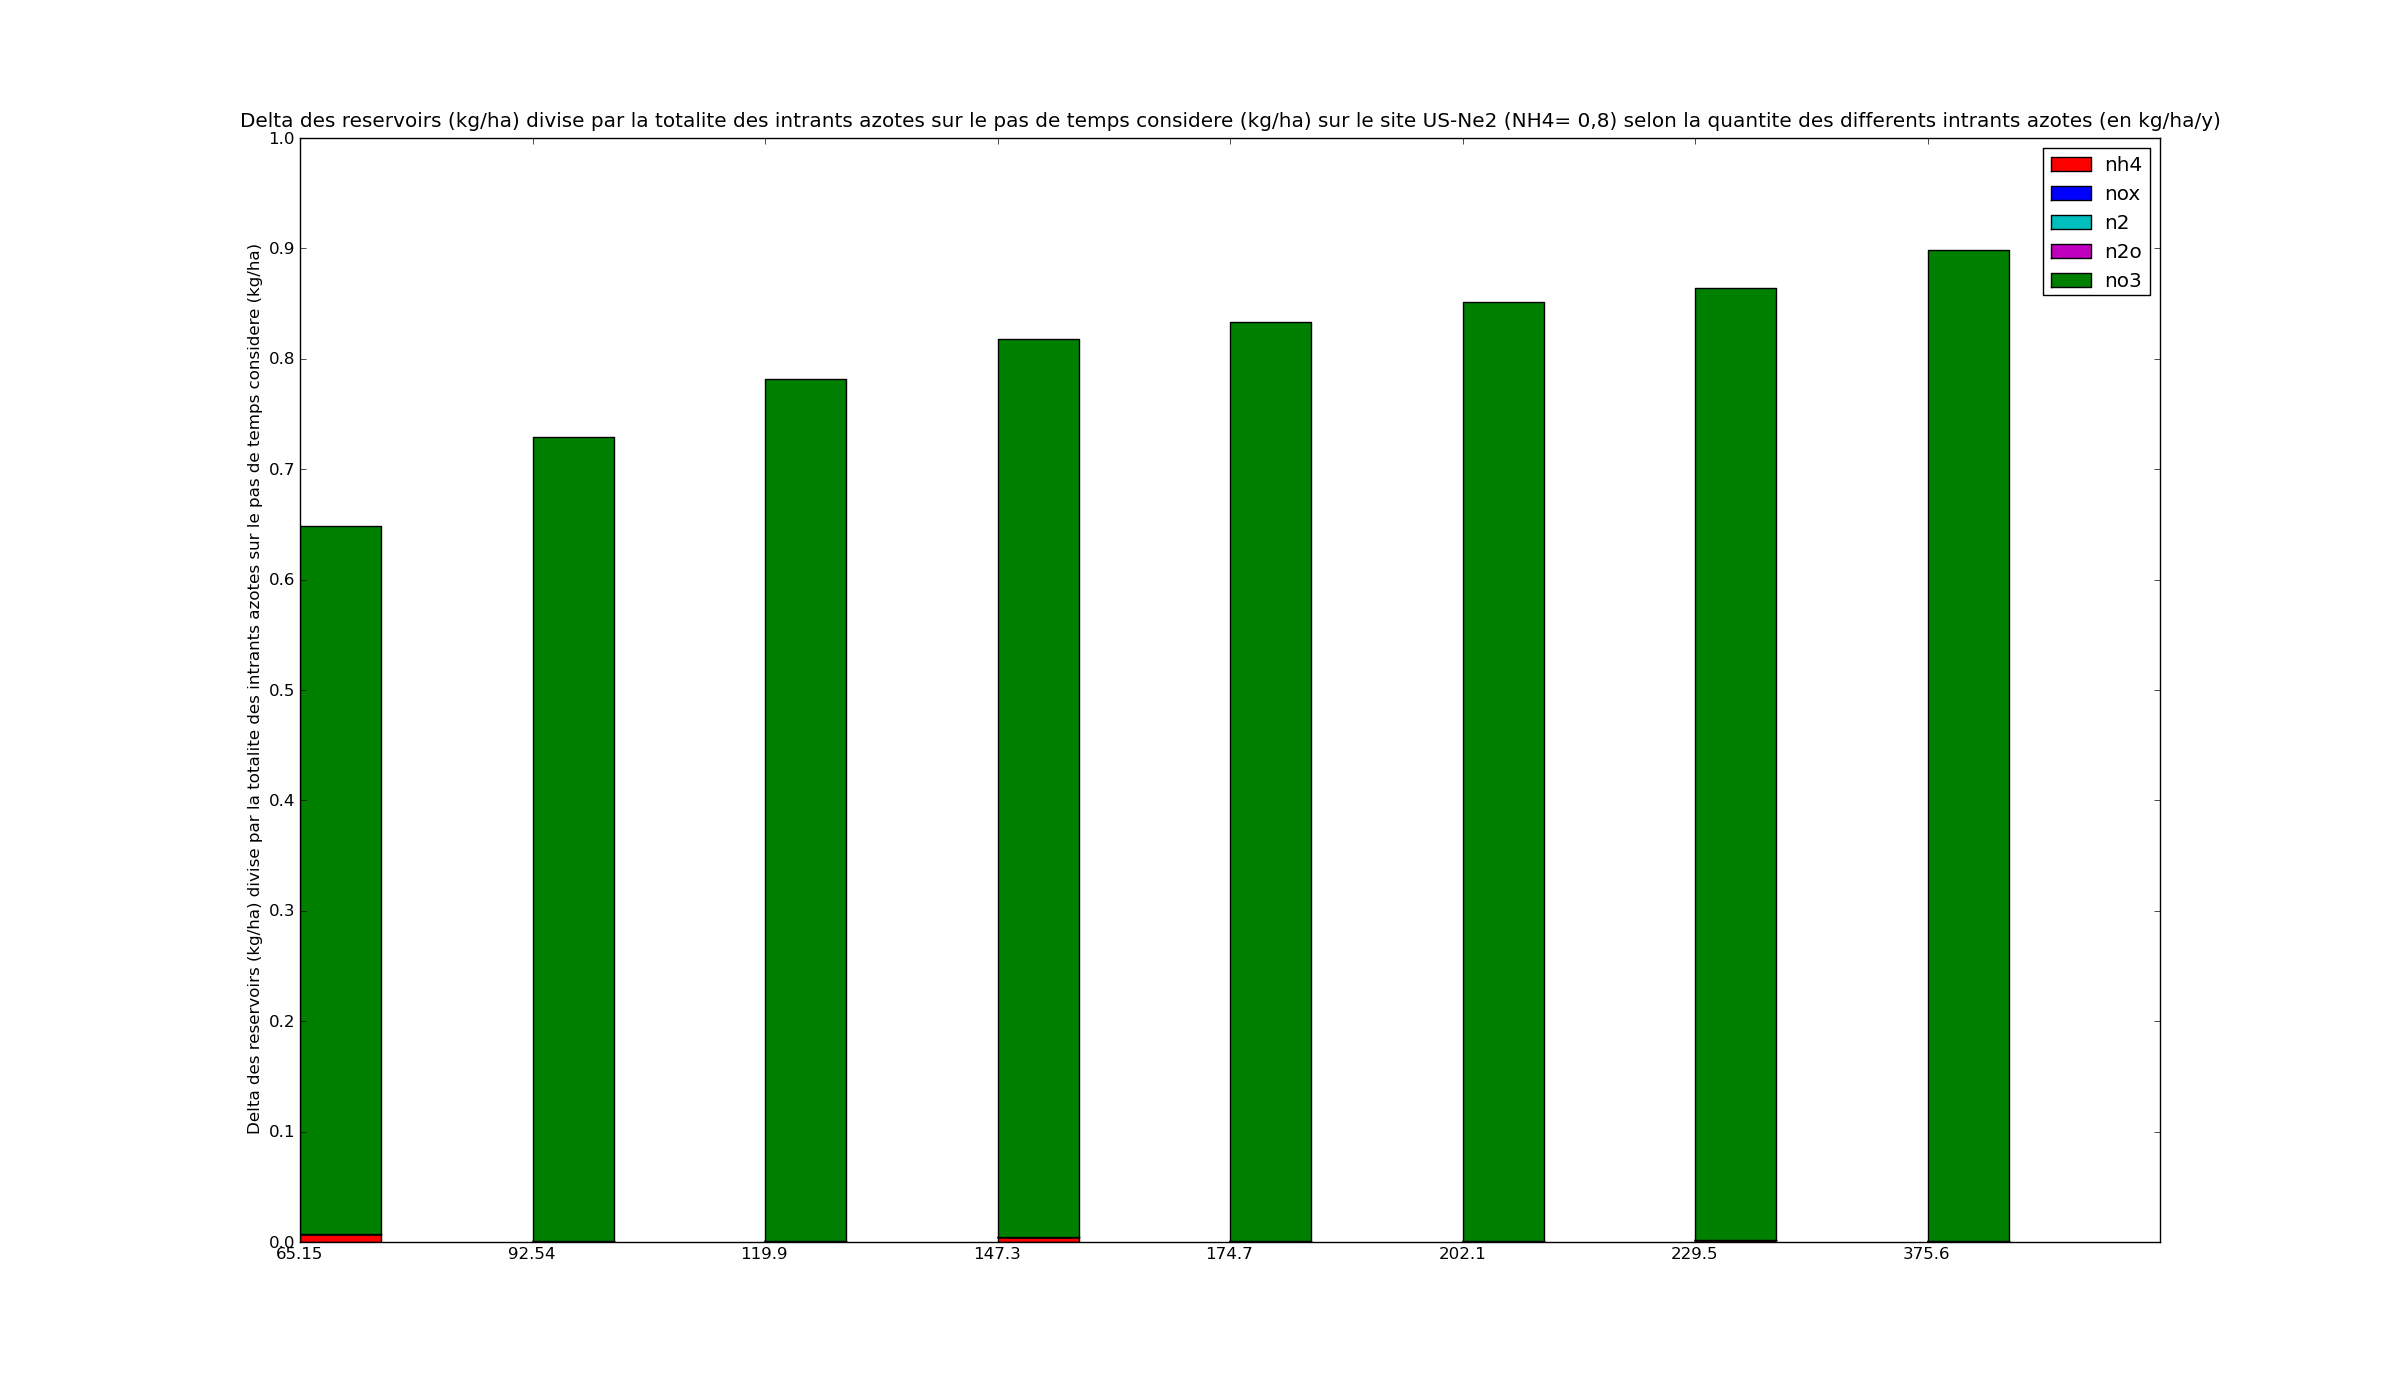
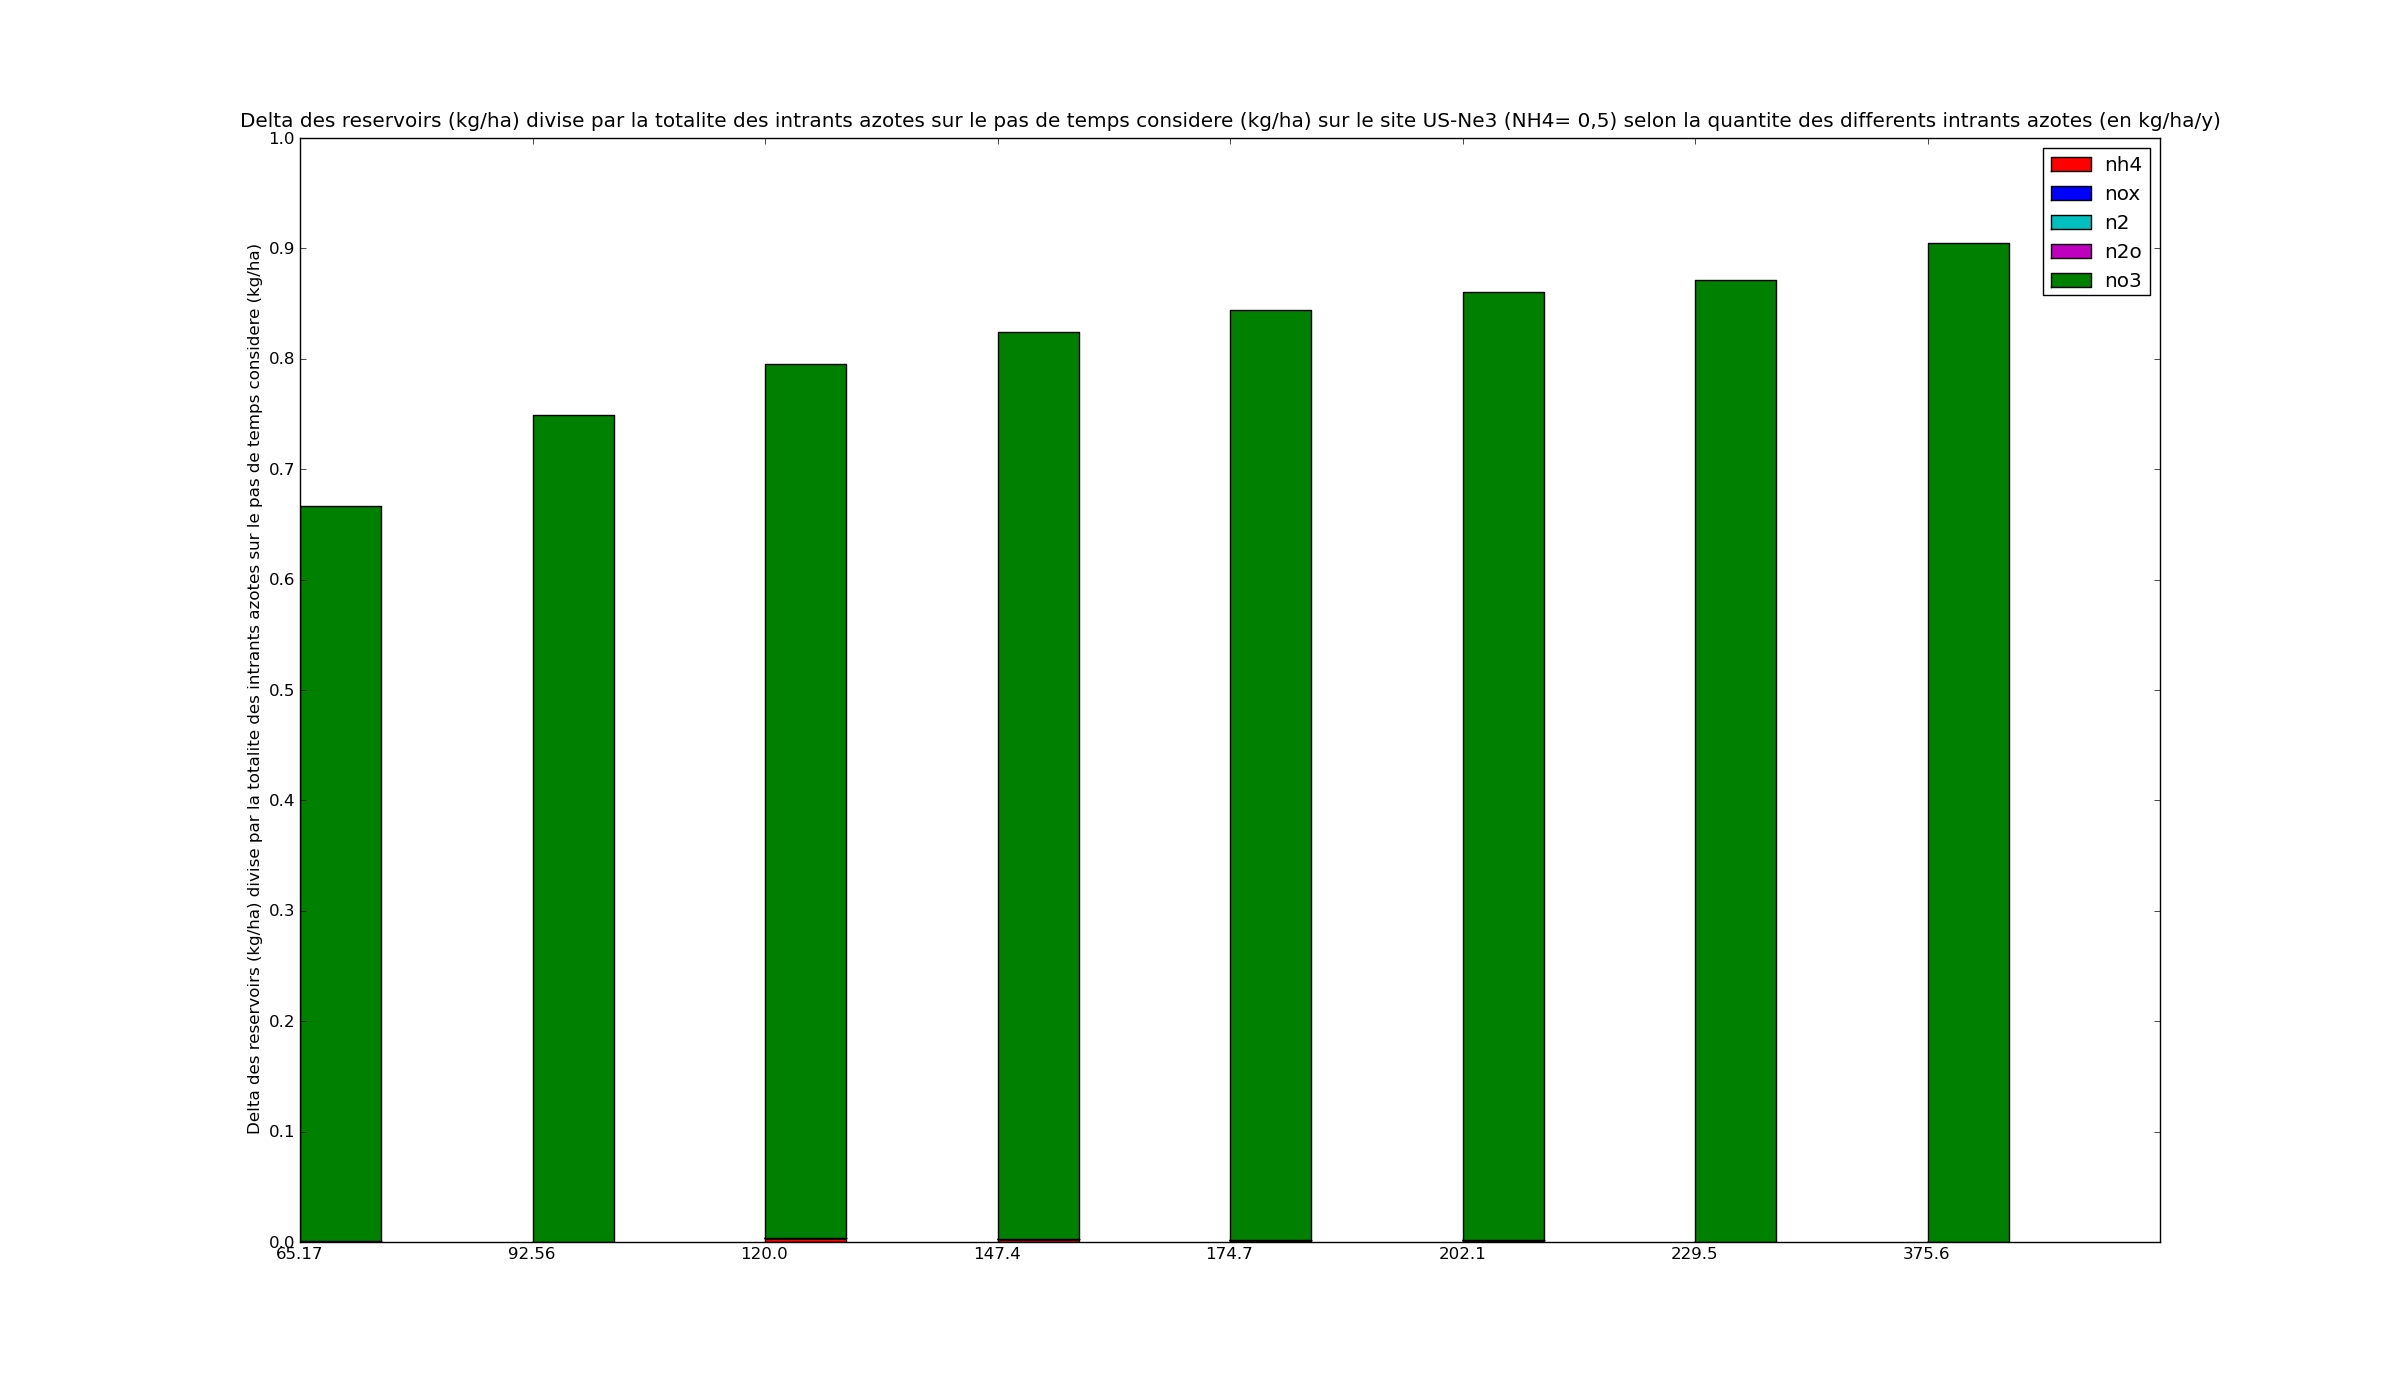
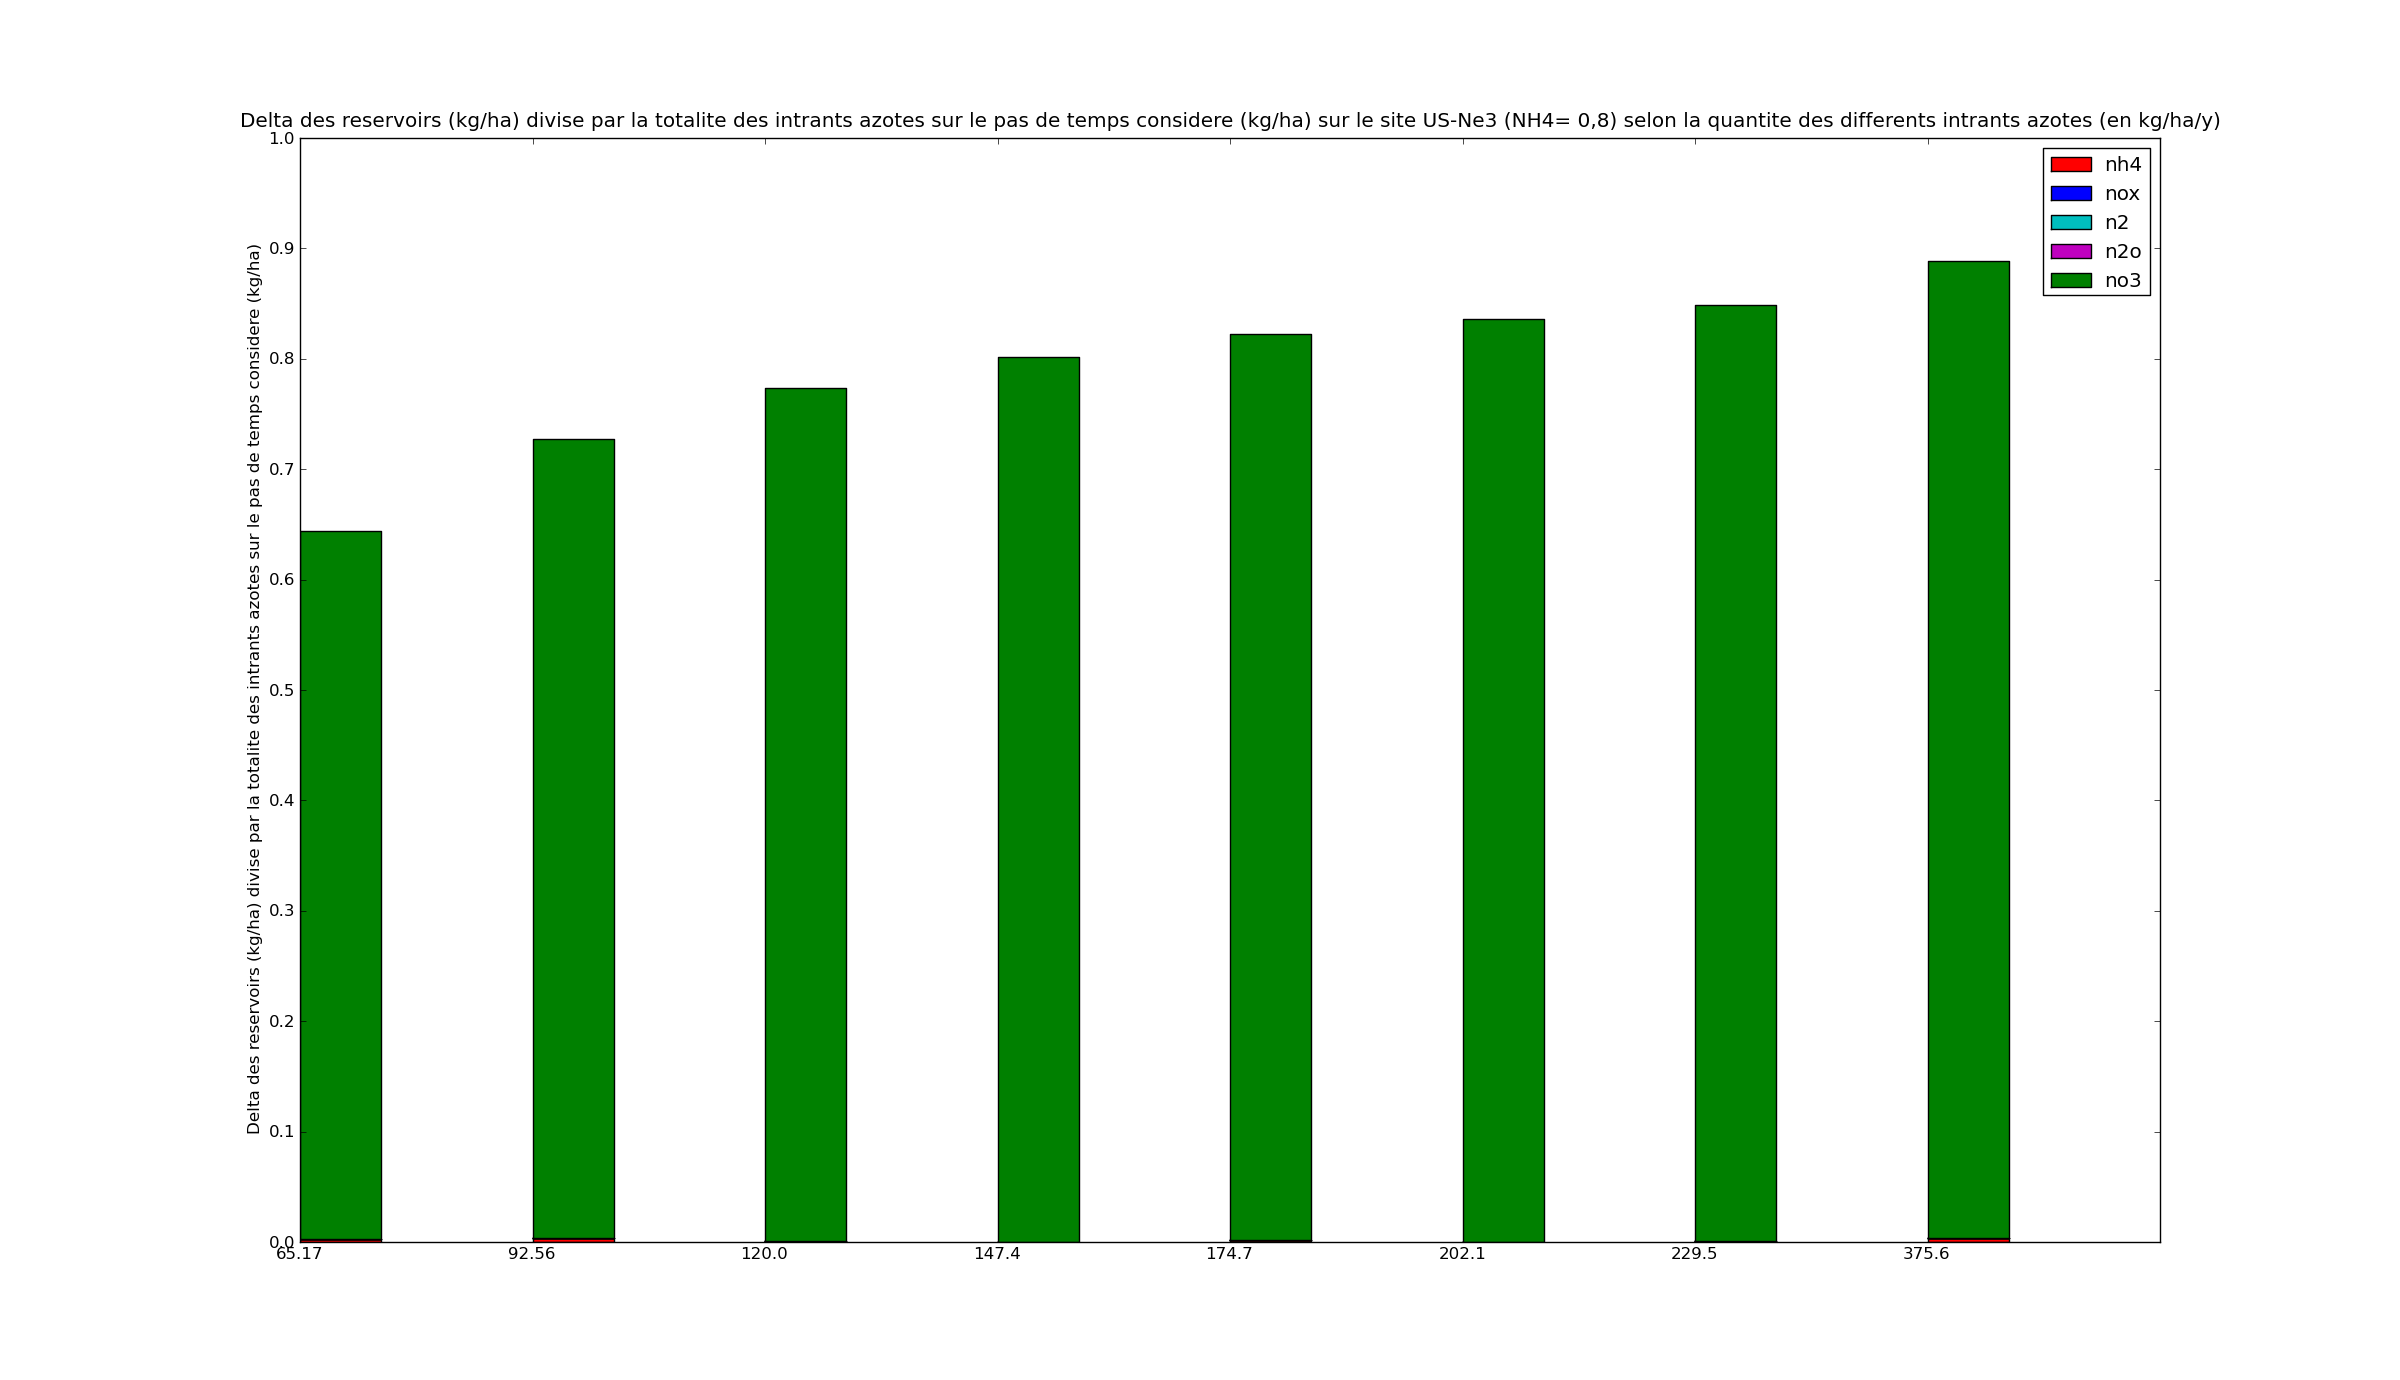
The sum of those EF is not equal to 1 for each site. So we looked at the difference between nitrogen pools (soil_nh4, soil_n2, soil_n2o, soil_no3 and soil_nox) at day1 and nitrogen pools on the last day.
path : /home/users/taudoux/documents/Results/B/EFd/
Difference between nitrogen pools normalized by the amount of all nitrogen inputs (fertilizer, NHx and NOx deposition).
| DK-Ris | |
|---|---|
| 0.5 | 0.8 |
 | 
|
| FR-Gri | |
|---|---|
| 0.5 | 0.8 |
 | 
|
| NL-Lan | |
|---|---|
| 0.5 | 0.8 |
 | 
|
| NL-Lut | |
|---|---|
| 0.5 | 0.8 |
 | 
|
| US-Bo1 | |
|---|---|
| 0.5 | 0.8 |
 | 
|
| US-Ne1 | |
|---|---|
| 0.5 | 0.8 |
 | 
|
| US-Ne2 | |
|---|---|
| 0.5 | 0.8 |
 | 
|
| US-Ne3 | |
|---|---|
| 0.5 | 0.8 |
 | 
|
Attachments (208)
- nh3_em_nhx_depot.png (23.5 KB) - added by taudoux 7 years ago.
- litterhum.png (21.5 KB) - added by taudoux 7 years ago.
- nh3_em_pH.png (20.5 KB) - added by taudoux 7 years ago.
- t2m.png (22.3 KB) - added by taudoux 7 years ago.
- nh3_em_n2o_soil.png (21.2 KB) - added by taudoux 7 years ago.
- nh3_em_nh4_soil.png (22.7 KB) - added by taudoux 7 years ago.
- nh3_em_no3_soil.png (22.7 KB) - added by taudoux 7 years ago.
- nh3_em_nox_soil.png (23.4 KB) - added by taudoux 7 years ago.
- Correlation SOIL NOx.pdf (23.4 KB) - added by taudoux 7 years ago.
- Correlation SOIL NO3-.pdf (23.9 KB) - added by taudoux 7 years ago.
- nh3_em_nh4_soil.2.png (22.7 KB) - added by taudoux 7 years ago.
- nh3_em_n2o_soil.2.png (21.2 KB) - added by taudoux 7 years ago.
- Correlation SOIL N2O.pdf (23.5 KB) - added by taudoux 7 years ago.
- Correlation SOIL NO3-.2.pdf (23.9 KB) - added by taudoux 7 years ago.
- Correlation SOIL NH4.pdf (23.5 KB) - added by taudoux 7 years ago.
- Correlation LITTERHUM.pdf (23.0 KB) - added by taudoux 7 years ago.
- Correlation T2M .pdf (23.6 KB) - added by taudoux 7 years ago.
- Correlation depot NHx.pdf (23.6 KB) - added by taudoux 7 years ago.
- R2Depot.png (27.7 KB) - added by taudoux 7 years ago.
- R2litterhum.png (27.4 KB) - added by taudoux 7 years ago.
- R2t2m.png (28.8 KB) - added by taudoux 7 years ago.
- R2n2o.png (27.0 KB) - added by taudoux 7 years ago.
- R2nh4.png (27.2 KB) - added by taudoux 7 years ago.
- R2no3.png (28.8 KB) - added by taudoux 7 years ago.
- R2nox.png (27.0 KB) - added by taudoux 7 years ago.
- Comparison.png (54.1 KB) - added by taudoux 7 years ago.
- R2Depot.2.png (27.7 KB) - added by taudoux 7 years ago.
- DK-Ris_0.5.png (37.2 KB) - added by taudoux 7 years ago.
- DK-Ris_0.8.png (36.0 KB) - added by taudoux 7 years ago.
- FR-Gri_0.5.png (33.8 KB) - added by taudoux 7 years ago.
- FR-Gri_0.8.png (34.2 KB) - added by taudoux 7 years ago.
- NL-Lan_0.5.png (35.2 KB) - added by taudoux 7 years ago.
- NL-Lan_0.8.png (34.3 KB) - added by taudoux 7 years ago.
- NL-Lut_0.5.png (34.0 KB) - added by taudoux 7 years ago.
- NL-Lut_0.8.png (33.7 KB) - added by taudoux 7 years ago.
- US-Bo1_0.5.png (35.5 KB) - added by taudoux 7 years ago.
- US-Bo1_0.8.png (34.9 KB) - added by taudoux 7 years ago.
- US-Ne1_0.5.png (34.3 KB) - added by taudoux 7 years ago.
- US-Ne1_0.8.png (33.5 KB) - added by taudoux 7 years ago.
- US-Ne2_0.5.png (34.0 KB) - added by taudoux 7 years ago.
- US-Ne2_0.8.png (33.6 KB) - added by taudoux 7 years ago.
- US-Ne3_0.5.png (34.2 KB) - added by taudoux 7 years ago.
- US-Ne3_0.8.png (33.2 KB) - added by taudoux 7 years ago.
- DK-Ris_0.5b.png (38.1 KB) - added by taudoux 7 years ago.
- DK-Ris_0.8b.png (38.5 KB) - added by taudoux 7 years ago.
- FR-Gri_0.5b.png (35.4 KB) - added by taudoux 7 years ago.
- FR-Gri_0.8b.png (36.5 KB) - added by taudoux 7 years ago.
- NL-Lan_0.5b.png (37.1 KB) - added by taudoux 7 years ago.
- NL-Lut_0.5b.png (36.8 KB) - added by taudoux 7 years ago.
- NL-Lan_0.8b.png (38.0 KB) - added by taudoux 7 years ago.
- NL-Lut_0.8b.png (37.8 KB) - added by taudoux 7 years ago.
- US-Bo1_0.5b.png (38.0 KB) - added by taudoux 7 years ago.
- US-Bo1_0.8b.png (37.2 KB) - added by taudoux 7 years ago.
- US-Ne1_0.5b.png (36.2 KB) - added by taudoux 7 years ago.
- US-Ne1_0.8b.png (38.2 KB) - added by taudoux 7 years ago.
- US-Ne2_0.5b.png (35.6 KB) - added by taudoux 7 years ago.
- US-Ne2_0.8b.png (36.3 KB) - added by taudoux 7 years ago.
- US-Ne3_0.5b.png (36.1 KB) - added by taudoux 7 years ago.
- US-Ne3_0.8b.png (36.3 KB) - added by taudoux 7 years ago.
- n2_em.png (28.6 KB) - added by taudoux 7 years ago.
- n2o_em.png (33.3 KB) - added by taudoux 7 years ago.
- n2opool.png (33.4 KB) - added by taudoux 7 years ago.
- n2pool.png (32.5 KB) - added by taudoux 7 years ago.
- nh3_em.png (26.5 KB) - added by taudoux 7 years ago.
- nh4_leaching.png (29.0 KB) - added by taudoux 7 years ago.
- nh4pool.png (38.8 KB) - added by taudoux 7 years ago.
- no3_leaching.png (33.2 KB) - added by taudoux 7 years ago.
- no3pool.png (41.2 KB) - added by taudoux 7 years ago.
- nox_em.png (34.2 KB) - added by taudoux 7 years ago.
- noxpool.png (33.3 KB) - added by taudoux 7 years ago.
- n2_emb.png (28.5 KB) - added by taudoux 7 years ago.
- GPP.png (32.9 KB) - added by taudoux 7 years ago.
- GPPb.png (32.3 KB) - added by taudoux 7 years ago.
- n2o_emb.png (34.2 KB) - added by taudoux 7 years ago.
- n2opoolb.png (32.4 KB) - added by taudoux 7 years ago.
- n2poolb.png (35.4 KB) - added by taudoux 7 years ago.
- nh3_emb.png (30.1 KB) - added by taudoux 7 years ago.
- nh4_leachingb.png (30.7 KB) - added by taudoux 7 years ago.
- nh4poolb.png (37.2 KB) - added by taudoux 7 years ago.
- no3_leachingb.png (34.3 KB) - added by taudoux 7 years ago.
- no3poolb.png (40.9 KB) - added by taudoux 7 years ago.
- nox_emb.png (35.5 KB) - added by taudoux 7 years ago.
- noxpoolb.png (33.1 KB) - added by taudoux 7 years ago.
- DK-Ris_0.5c.png (61.3 KB) - added by taudoux 7 years ago.
- DK-Ris_0.8c.png (61.5 KB) - added by taudoux 7 years ago.
- FR-Gri_0.5c.png (59.3 KB) - added by taudoux 7 years ago.
- FR-Gri_0.8c.2.png (59.5 KB) - added by taudoux 7 years ago.
- NL-Lan_0.5c.png (59.2 KB) - added by taudoux 7 years ago.
- FR-Gri_0.8c.png (59.5 KB) - added by taudoux 7 years ago.
- NL-Lan_0.8c.png (59.4 KB) - added by taudoux 7 years ago.
- NL-Lut_0.5c.png (60.3 KB) - added by taudoux 7 years ago.
- NL-Lut_0.8c.png (60.5 KB) - added by taudoux 7 years ago.
- US-Bo1_0.5c.png (59.8 KB) - added by taudoux 7 years ago.
- US-Bo1_0.8c.png (59.9 KB) - added by taudoux 7 years ago.
- US-Ne1_0.5c.png (59.2 KB) - added by taudoux 7 years ago.
- US-Ne1_0.8c.png (59.4 KB) - added by taudoux 7 years ago.
- US-Ne2_0.5c.png (59.8 KB) - added by taudoux 7 years ago.
- US-Ne2_0.8c.png (60.0 KB) - added by taudoux 7 years ago.
- US-Ne3_0.5c.png (59.7 KB) - added by taudoux 7 years ago.
- US-Ne3_0.8c.png (60.0 KB) - added by taudoux 7 years ago.
- DK-Ris_0.5d.png (81.3 KB) - added by taudoux 7 years ago.
- DK-Ris_0.8d.png (81.5 KB) - added by taudoux 7 years ago.
- FR-Gri_0.5d.png (80.4 KB) - added by taudoux 7 years ago.
- FR-Gri_0.8d.png (80.7 KB) - added by taudoux 7 years ago.
- NL-Lan_0.5d.png (77.9 KB) - added by taudoux 7 years ago.
- NL-Lan_0.8d.png (78.1 KB) - added by taudoux 7 years ago.
- NL-Lut_0.5d.png (80.7 KB) - added by taudoux 7 years ago.
- NL-Lut_0.8d.png (81.1 KB) - added by taudoux 7 years ago.
- US-Bo1_0.5d.png (79.7 KB) - added by taudoux 7 years ago.
- US-Bo1_0.8d.png (79.9 KB) - added by taudoux 7 years ago.
- US-Ne1_0.5d.png (79.5 KB) - added by taudoux 7 years ago.
- US-Ne1_0.8d.png (79.8 KB) - added by taudoux 7 years ago.
- US-Ne2_0.5d.png (79.9 KB) - added by taudoux 7 years ago.
- US-Ne2_0.8d.png (80.1 KB) - added by taudoux 7 years ago.
- US-Ne3_0.5d.png (80.2 KB) - added by taudoux 7 years ago.
- US-Ne3_0.8d.png (80.4 KB) - added by taudoux 7 years ago.
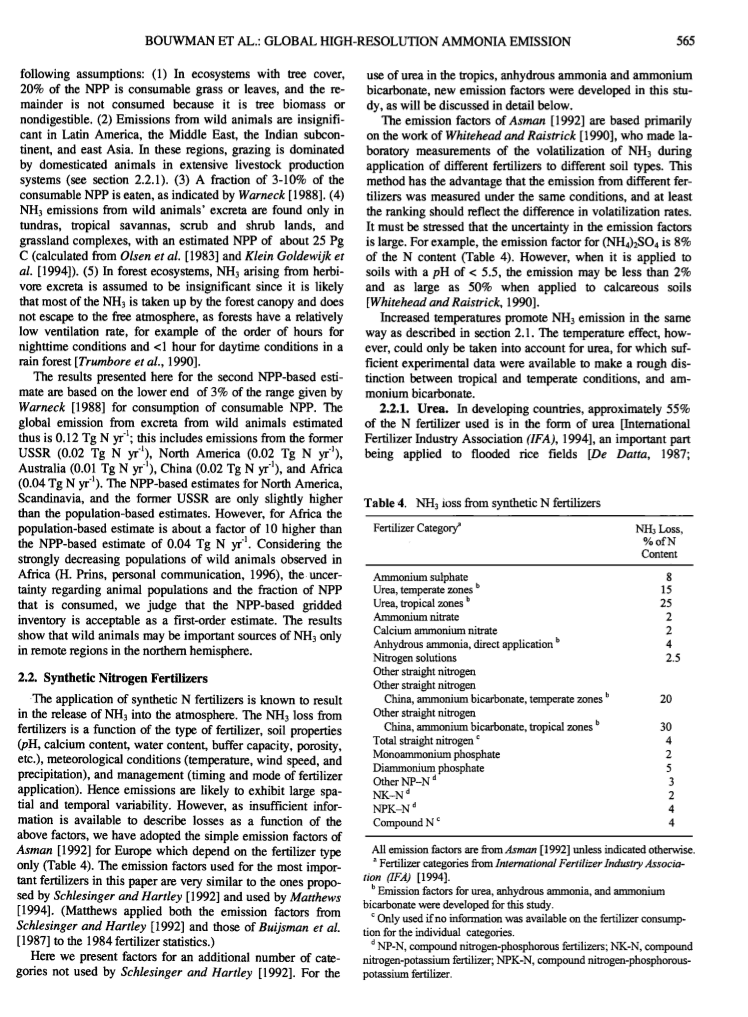
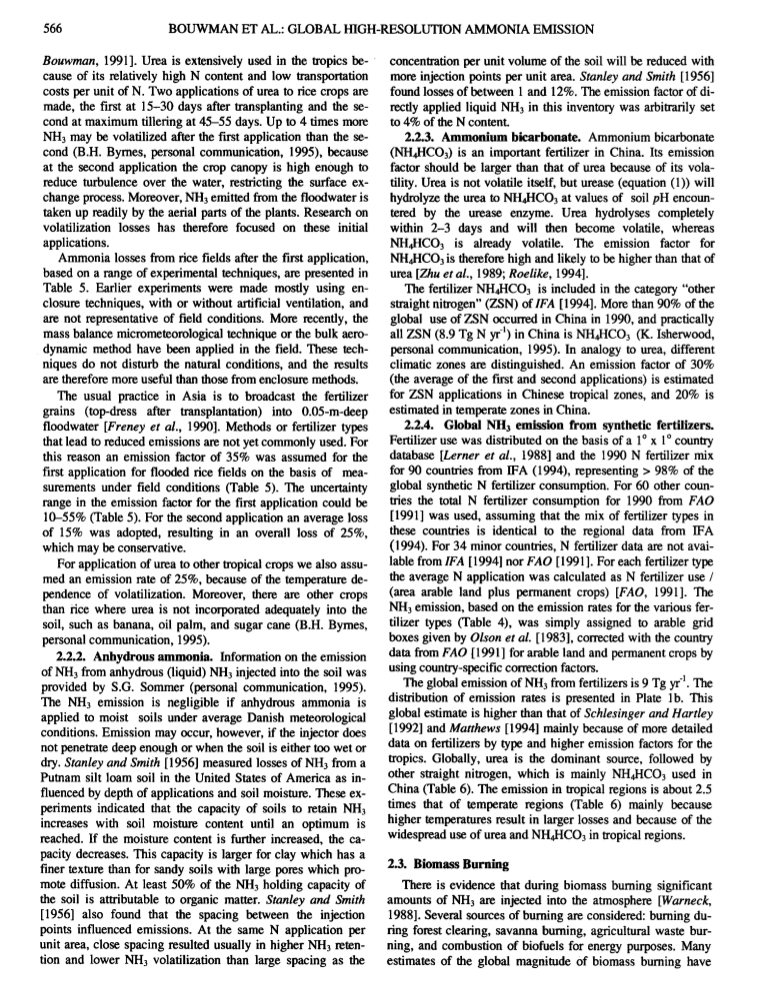
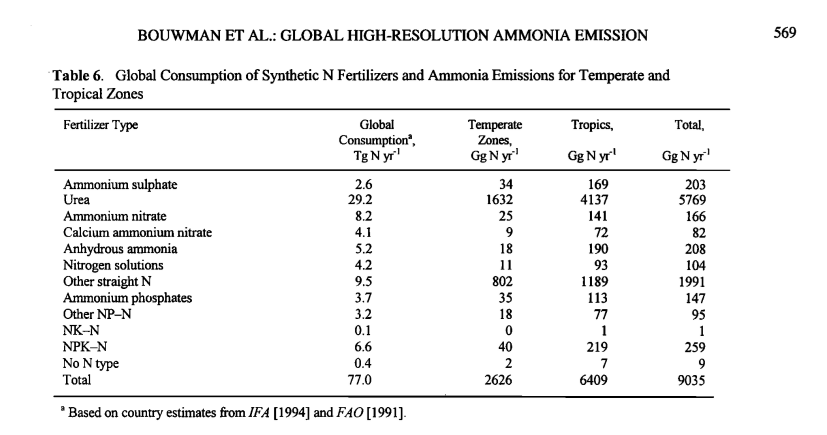
- EF_bouwman_1.png (649.2 KB) - added by taudoux 7 years ago.
- EF_bouwman_2.png (859.3 KB) - added by taudoux 7 years ago.
- EF_bouwman_3.png (374.9 KB) - added by taudoux 7 years ago.
- EF_bouwman_4.png (109.2 KB) - added by taudoux 7 years ago.
- Behera et al., 2013.png (70.6 KB) - added by taudoux 7 years ago.
- Behera_2013.png (70.6 KB) - added by taudoux 7 years ago.
- EF_behera.png (103.4 KB) - added by taudoux 7 years ago.
- US-Ne3_0.8e.png (78.8 KB) - added by taudoux 7 years ago.
- US-Ne2_0.8e.png (79.5 KB) - added by taudoux 7 years ago.
- US-Ne1_0.8e.png (78.7 KB) - added by taudoux 7 years ago.
- US-Bo1_0.8e.png (79.7 KB) - added by taudoux 7 years ago.
- NL-Lan_0.8e.png (78.6 KB) - added by taudoux 7 years ago.
- NL-Lut_0.8e.png (78.7 KB) - added by taudoux 7 years ago.
- DK-Ris_0.8e.png (82.9 KB) - added by taudoux 7 years ago.
- FR-Gri_0.8e.png (78.6 KB) - added by taudoux 7 years ago.
- US-Ne3_0.5e.png (78.7 KB) - added by taudoux 7 years ago.
- US-Ne2_0.5e.png (79.4 KB) - added by taudoux 7 years ago.
- US-Ne1_0.5e.png (78.7 KB) - added by taudoux 7 years ago.
- US-Bo1_0.5e.png (79.6 KB) - added by taudoux 7 years ago.
- NL-Lan_0.5e.png (78.4 KB) - added by taudoux 7 years ago.
- NL-Lut_0.5e.png (78.4 KB) - added by taudoux 7 years ago.
- FR-Gri_0.5e.png (78.6 KB) - added by taudoux 7 years ago.
- DK-Ris_0.5e.png (82.8 KB) - added by taudoux 7 years ago.
- FR-Gri_0.8i.png (74.6 KB) - added by taudoux 7 years ago.
- US-Ne1_0.8i.png (75.4 KB) - added by taudoux 7 years ago.
- US-Ne2_0.8i.png (75.2 KB) - added by taudoux 7 years ago.
- US-Ne3_0.8i.png (75.4 KB) - added by taudoux 7 years ago.
- DK-Ris_0.5ebis.png (74.7 KB) - added by taudoux 7 years ago.
- FR-Gri_0.5ebis.png (71.6 KB) - added by taudoux 7 years ago.
- NL-Lan_0.5ebis.png (70.0 KB) - added by taudoux 7 years ago.
- NL-Lut_0.5ebis.png (70.1 KB) - added by taudoux 7 years ago.
- US-Bo1_0.5ebis.png (70.9 KB) - added by taudoux 7 years ago.
- US-Ne1_0.5ebis.png (71.2 KB) - added by taudoux 7 years ago.
- US-Ne2_0.5ebis.png (71.6 KB) - added by taudoux 7 years ago.
- US-Ne3_0.5ebis.png (72.2 KB) - added by taudoux 7 years ago.
- US-Ne3_0.8ebis.png (72.3 KB) - added by taudoux 7 years ago.
- US-Ne2_0.8ebis.png (71.7 KB) - added by taudoux 7 years ago.
- US-Ne1_0.8ebis.png (71.4 KB) - added by taudoux 7 years ago.
- US-Bo1_0.8ebis.png (71.0 KB) - added by taudoux 7 years ago.
- NL-Lan_0.8ebis.png (70.1 KB) - added by taudoux 7 years ago.
- NL-Lut_0.8ebis.png (70.3 KB) - added by taudoux 7 years ago.
- DK-Ris_0.8ebis.png (74.8 KB) - added by taudoux 7 years ago.
- FR-Gri_0.8ebis.png (71.7 KB) - added by taudoux 7 years ago.
- US-Ne3_0.5g.png (72.9 KB) - added by taudoux 7 years ago.
- US-Ne2_0.5g.png (72.3 KB) - added by taudoux 7 years ago.
- US-Ne1_0.5g.png (72.3 KB) - added by taudoux 7 years ago.
- US-Bo1_0.5g.png (73.5 KB) - added by taudoux 7 years ago.
- DK-Ris_0.5g.png (76.4 KB) - added by taudoux 7 years ago.
- FR-Gri_0.5g.png (72.3 KB) - added by taudoux 7 years ago.
- NL-Lan_0.5g.png (72.4 KB) - added by taudoux 7 years ago.
- NL-Lut_0.5g.png (72.4 KB) - added by taudoux 7 years ago.
- US-Ne3_0.5f.png (79.4 KB) - added by taudoux 7 years ago.
- US-Ne2_0.5f.png (78.6 KB) - added by taudoux 7 years ago.
- US-Ne1_0.5f.png (78.9 KB) - added by taudoux 7 years ago.
- US-Bo1_0.5f.png (79.7 KB) - added by taudoux 7 years ago.
- NL-Lan_0.5f.png (79.3 KB) - added by taudoux 7 years ago.
- NL-Lut_0.5f.png (79.0 KB) - added by taudoux 7 years ago.
- DK-Ris_0.5f.png (83.0 KB) - added by taudoux 7 years ago.
- FR-Gri_0.5f.png (78.1 KB) - added by taudoux 7 years ago.
- DK-Ris_0.5fbis.png (82.9 KB) - added by taudoux 7 years ago.
- FR-Gri_0.5fbis.png (79.5 KB) - added by taudoux 7 years ago.
- NL-Lut_0.5fbis.png (80.0 KB) - added by taudoux 7 years ago.
- NL-Lan_0.5fbis.png (78.3 KB) - added by taudoux 7 years ago.
- US-Bo1_0.5fbis.png (78.6 KB) - added by taudoux 7 years ago.
- US-Ne3_0.5fbis.png (78.7 KB) - added by taudoux 7 years ago.
- US-Ne2_0.5fbis.png (78.7 KB) - added by taudoux 7 years ago.
- US-Ne1_0.5fbis.png (79.2 KB) - added by taudoux 7 years ago.
- US-Ne3_0.5gbis.png (72.5 KB) - added by taudoux 7 years ago.
- US-Ne2_0.5gbis.png (72.6 KB) - added by taudoux 7 years ago.
- US-Ne1_0.5gbis.png (72.5 KB) - added by taudoux 7 years ago.
- US-Bo1_0.5gbis.png (72.8 KB) - added by taudoux 7 years ago.
- NL-Lan_0.5gbis.png (72.2 KB) - added by taudoux 7 years ago.
- FR-Gri_0.5gbis.png (73.1 KB) - added by taudoux 7 years ago.
- NL-Lut_0.5gbis.png (72.7 KB) - added by taudoux 7 years ago.
- DK-Ris_0.5gbis.png (76.5 KB) - added by taudoux 7 years ago.
- US-Ne3_0.5_EF.png (44.1 KB) - added by taudoux 7 years ago.
- US-Ne2_0.5_EF.png (44.1 KB) - added by taudoux 7 years ago.
- US-Ne1_0.5_EF.png (44.0 KB) - added by taudoux 7 years ago.
- US-Bo1_0.5_EF.png (44.7 KB) - added by taudoux 7 years ago.
- NL-Lut_0.5_EF.png (43.7 KB) - added by taudoux 7 years ago.
- DK-Ris_0.5_EF.png (45.0 KB) - added by taudoux 7 years ago.
- NL-Lan_0.5_EF.png (44.1 KB) - added by taudoux 7 years ago.
- FR-Gri_0.5_EF.png (44.1 KB) - added by taudoux 7 years ago.
- Rapport de stage final.pdf (1.3 MB) - added by taudoux 7 years ago.
- nh3_em_pH_g.gif (8.9 KB) - added by taudoux 7 years ago.
- nh3_em_t2m_g.gif (24.5 KB) - added by taudoux 7 years ago.
- nh3_em_soil_nh4_g.gif (13.7 KB) - added by taudoux 7 years ago.
- nh3_em_soil_n2o_g.gif (7.1 KB) - added by taudoux 7 years ago.
- nh3_em_hum_g.gif (27.1 KB) - added by taudoux 7 years ago.
- nh3_em_soil_no3_g.gif (22.5 KB) - added by taudoux 7 years ago.
- nh3_em_nhx_dep_g.gif (17.1 KB) - added by taudoux 7 years ago.
- nh3_em_soil_nox_g.gif (9.9 KB) - added by taudoux 7 years ago.