Work of Thomas Audoux carried out during an internship on NH3 fluxes in ORCHIDEE model
This has been done with rev 4164. My work is divided in 4 parts, the first part corresponds to the work done for the internship report. Then, the second part is a brief bibliography about emission factors. Then, the third part corresponds to the second part of my internship: analyzing ammonia emission factor. Finally, the last part corresponds to a brief look at a global simulation of the model made by P.Messina.
I. Evaluation of ammonia emissions results calculated by the model ( Fertilizer =0 )
Internship_report.pdf
Sites and PFT
| PFT | Sites
|
|---|
| 2 | BR-Sa3 ; ID-Pag
|
| 4 | IL-Yat ; ES-ES1 ; IT-SRo ; US-Blo ; US-Me4 ; US-SP2 ; US-SP3 ; US-SP4 ; DE-Bay ; DE-Tha ; FR-LBr
|
| 5 | FR-Pue ; IT-Cpz ; IT-Lec ; PT-Esp ; PT-Mi1 ; AU-Tum ; AU-Wac
|
| 6 | IT-Col ; IT-Non ; IT-PT1 ; IT-Ro2 ; US-MMS ; US-MOz ; DK-Sor ; FR-Fon ; UK-PL3 ; IS-Gun ; IT-Ro1 ; US-WBW ; DE-Hai ; FR-Hes ; UK-Ham ; US-Bar ; US-Ha1 ; US-Oho ; US-UMB ; US-WCr
|
| 7 | CA-Man ; CA-NS2 ; CA-NS4 ; CA-Qcu ; CA-Qfo ; CA-SF1 ; CA-SF2 ; FI-Hyy ; FI-Sod ; SE-Fla
|
| 12 | FR-Gri ; DK-Ris ; NL-Lut
|
| 13 | NL-Lan ; US-Bo1 ; US-Ne1 ; US-Ne2 ; US-Ne3
|
Sites we have not looked at
AT-Neu ; CA-NS1 ; CA-NS3 ; CA-NS5 ; CH-Oe1 ; CZ-BK1 ; DE-Gri ; DE-Meh ; DE-Wet ; DK-Lva ; ES-VDA ; FR-Lq1 ; FR-Lqr2 ; HU-Bug ; ID-Dri ; IT-Amp ; IT-Lav ; IT-Lma ; IT-Lmal ; IT-Mbor ; IT-Ren ; NL-Ca1 ; NL-Haar ; NL-Hor ; NL-Loo ; PT-Mi2 ; RU-Fyo ; RU-Ha1 ; RU-Ha2 ; RU-Ha3 ; RU-Zot ; SE-Nor ; SE-SK1 ; SE-Sk2 ; SK-Tat ; UK-EBu ; UK-Gri ; UK-Tad ; US-Aud ; US-Bkg ; US-FPe ; US-Goo ; US-Ho1 ; US-Ho2 ; US-SP1 ; US-Var ; US-Wci0 ; US-Wi1 ; US-Wi2 ; US-Wi4 ; US-Wi5 ; US-Wi8 ; US-Wi9
- Parameters studied
- Temperature
- Humidity
- pH
- Nitrogen Pools (Soil_NH4, Soil_NO3, Soil_NOX and Soil_N2O)
- Emissions (NH3) and Depositions (NHX)
path : /home/orchidee03/taudoux/documents/Results/Parameters/ (Temperature, Humidity and pH)
path : /home/orchidee03/taudoux/documents/Results/Pools/ (Nitrogen Pools)
path : /home/orchidee03/taudoux/documents/Results/Emission-Deposition/ (NH3 emission and NHX deposition)
Files
All the script are in the folders /home/orchidee03/taudoux/documents/Results/Scripts/
- The script "script_calcul_parameters.ksh" used in order to create files of Temperature, Humidity and pH of each site in function of time listed in :
- /home/orchidee03/taudoux/documents/Results/Parameters/T2M/SITES/
- /home/orchidee03/taudoux/documents/Results/Parameters/LITTERHUM/SITES/
- /home/orchidee03/taudoux/documents/Results/Parameters/pH/SITES/
- The script "script_calcul_pools.ksh" used in order to create files of soil_NH4+, Soil_NO3-, Soil_NOX and Soil_N2O for each site in function of time listed in :
- /home/orchidee03/taudoux/documents/Results/Pools/SOIL_NH4/SITES/
- /home/orchidee03/taudoux/documents/Results/Pools/SOIL_NO3/SITES/
- /home/orchidee03/taudoux/documents/Results/Pools/SOIL_NOX/SITES/
- /home/orchidee03/taudoux/documents/Results/Pools/SOIL_N2O/SITES/
- The Script "script_calcul_emission-deposition.ksh" used in order to create files of NH3 emission and NHX deposition for each site in function of time in :
- /home/orchidee03/taudoux/documents/Results/Emission-Deposition/NH3_EMISSION/Sites/
- /home/orchidee03/taudoux/documents/Results/Emission-Deposition/NHX_DEPOSITION/Sites/
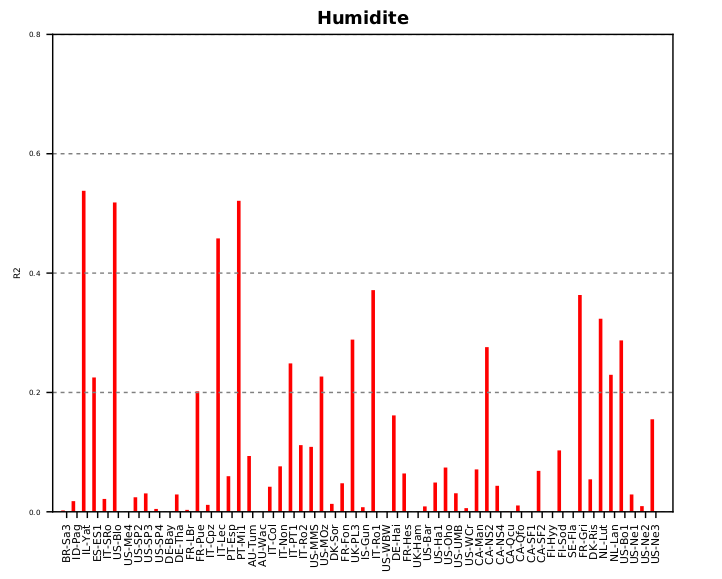
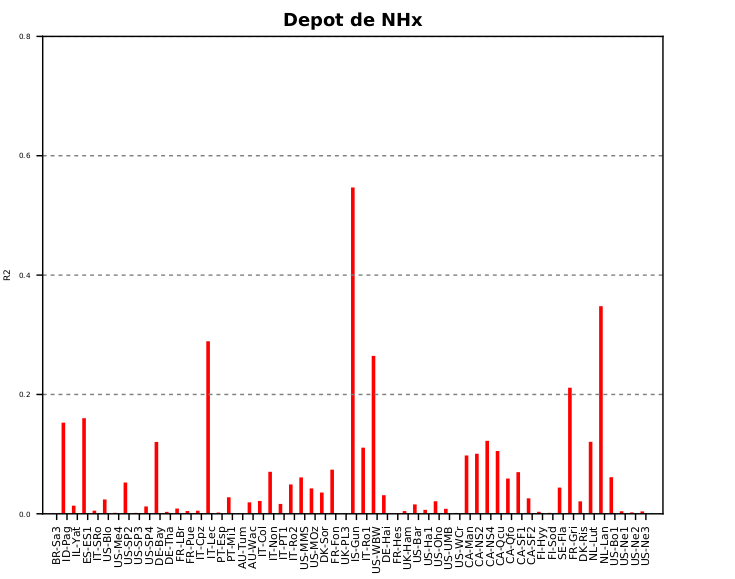
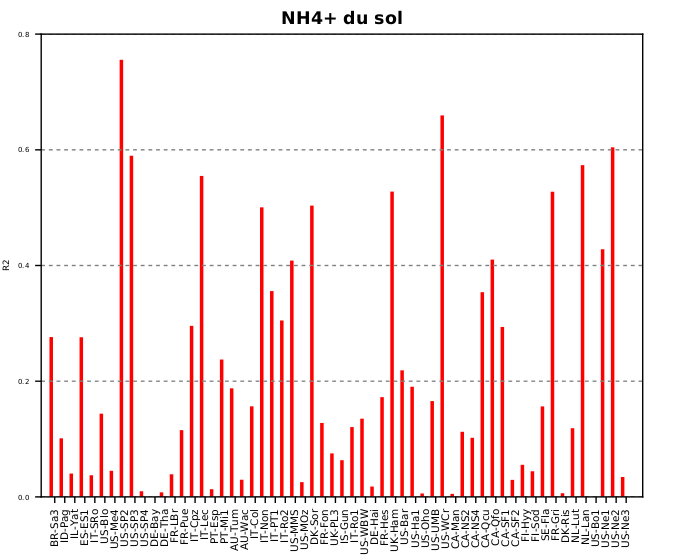
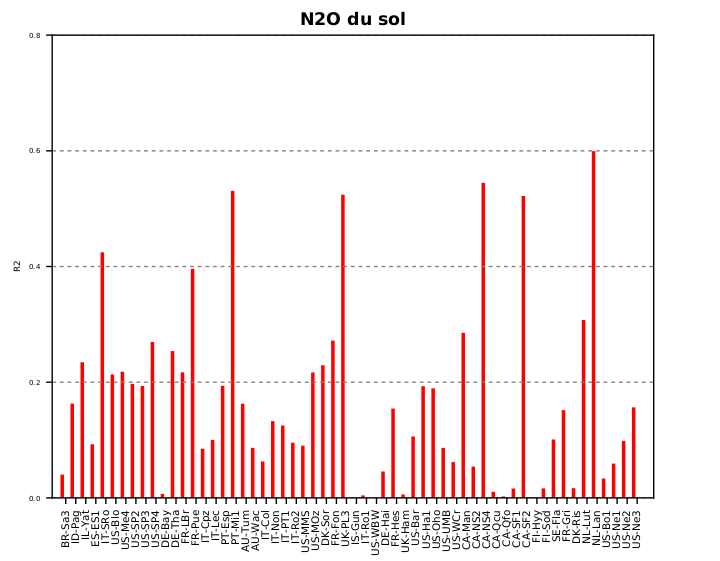
- For each parameter are listed :
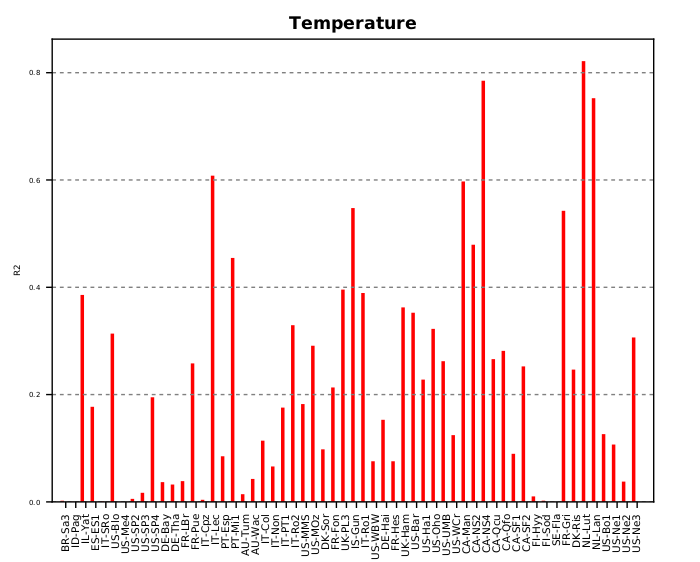
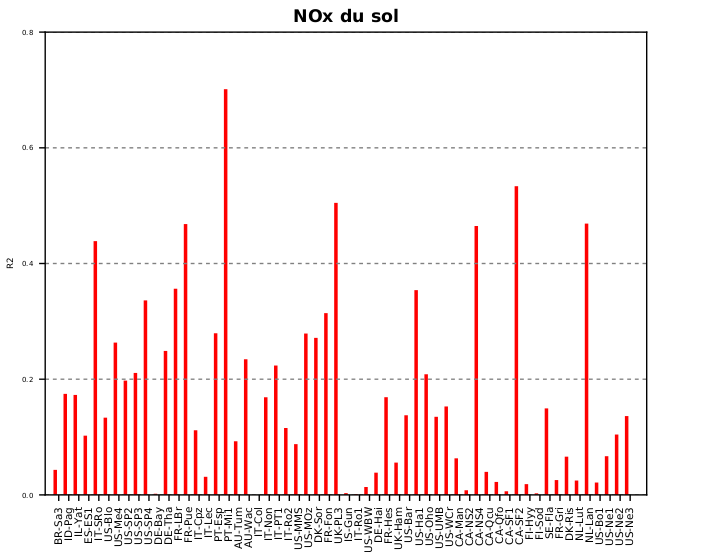
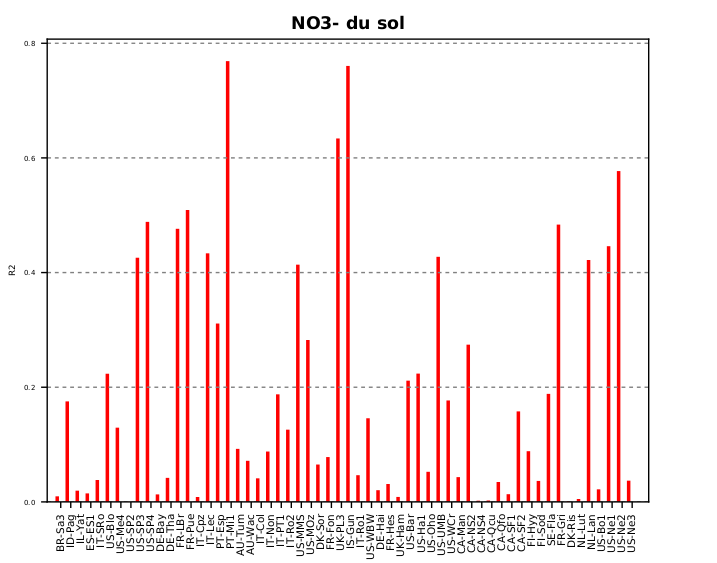
- Figure of correlation with NH3 emissions (except pH) obtained using "script_calcul_r2.ksh" to obtain the R2 and then bar_plot.py in order to create the figure
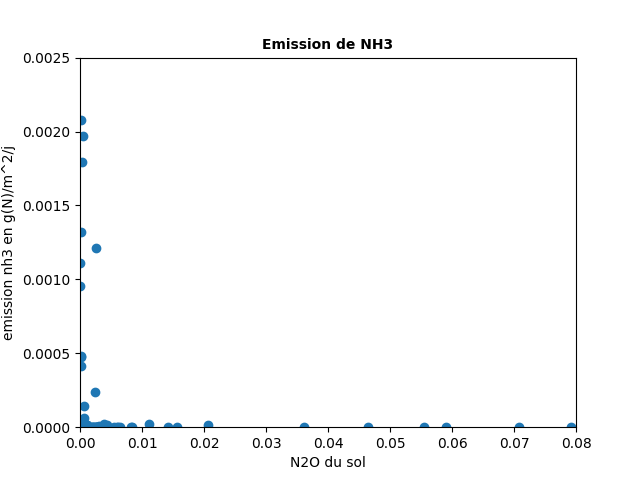
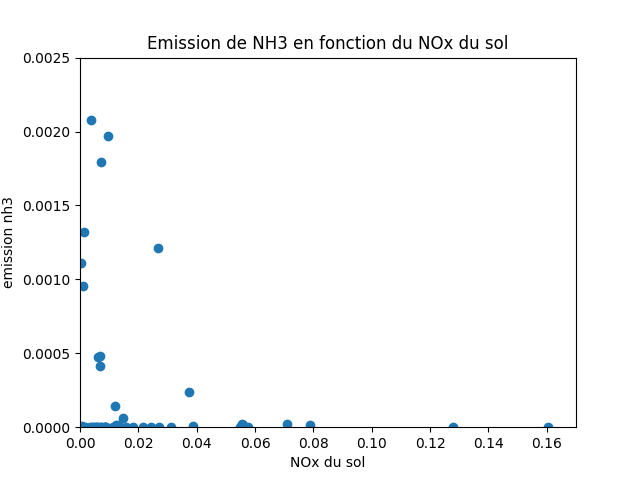
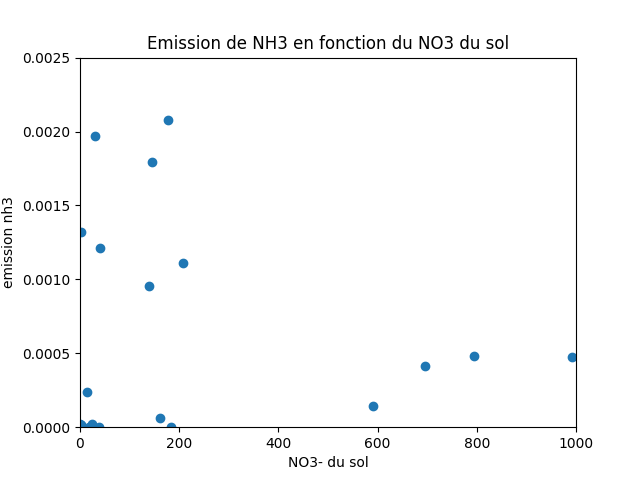
- Average emission of ammonia on each site in function of the parameter studied using "scatterplot.py"
- Text documents in which are listed the different values.
| Average emission of ammonia (g(NH3-N).m⁻².day⁻¹) on each site in function of the parameter considered
|
|---|
| Temperature (K) | Humidity (-) | pH (-) | Deposition g(NHx).m-2
|
|---|
 |  |  | 
|
| SOIL NH4 g(NH4).m-2 | SOIL N2O g(N2O).m-2 | SOIL NOX g(NOx).m-2 | SOIL NO3 g(NO3).m-2
|
|---|
 |  |  | 
|
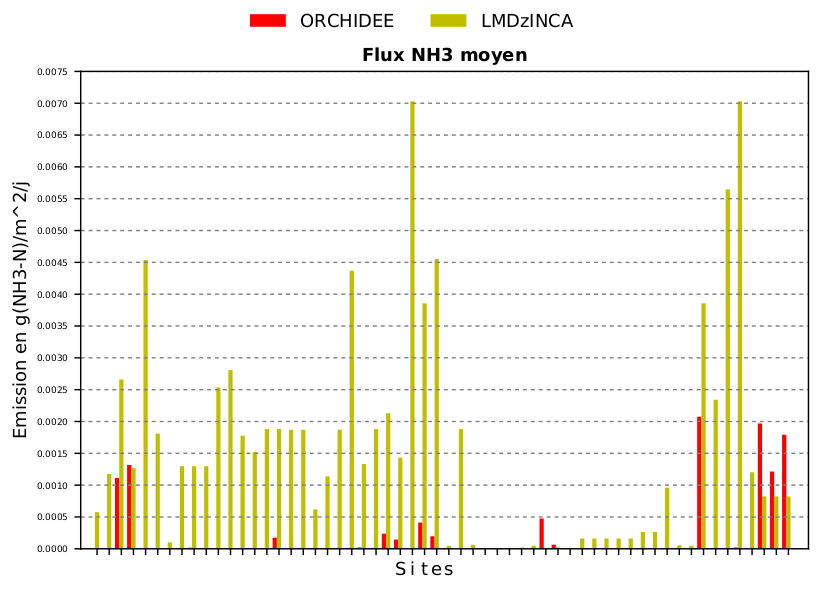
Figure, created using "bar_plot_donnees.py", in which for each site are listed the average emission of NH3 for both model.
| Correlation with NH3 emissions (g(NH3-N).m⁻².day⁻¹)
|
|---|
| Temperature (K) | Humidity (-) | Deposition g(NHx).m-2 |
|
|---|
 |  |  |
|
| SOIL NH4 g(NH4).m-2 | SOIL N2O g(N2O).m-2 | SOIL NOX g(NOx).m-2 | SOIL NO3 g(NO3).m-2
|
|---|
 |  |  | 
|
| Comparison with LMDz-INCA model's data
|
|---|
|
path : /home/orchidee03/taudoux/documents/Results/Comparison/
II. Bibliography on ammonia emission factor
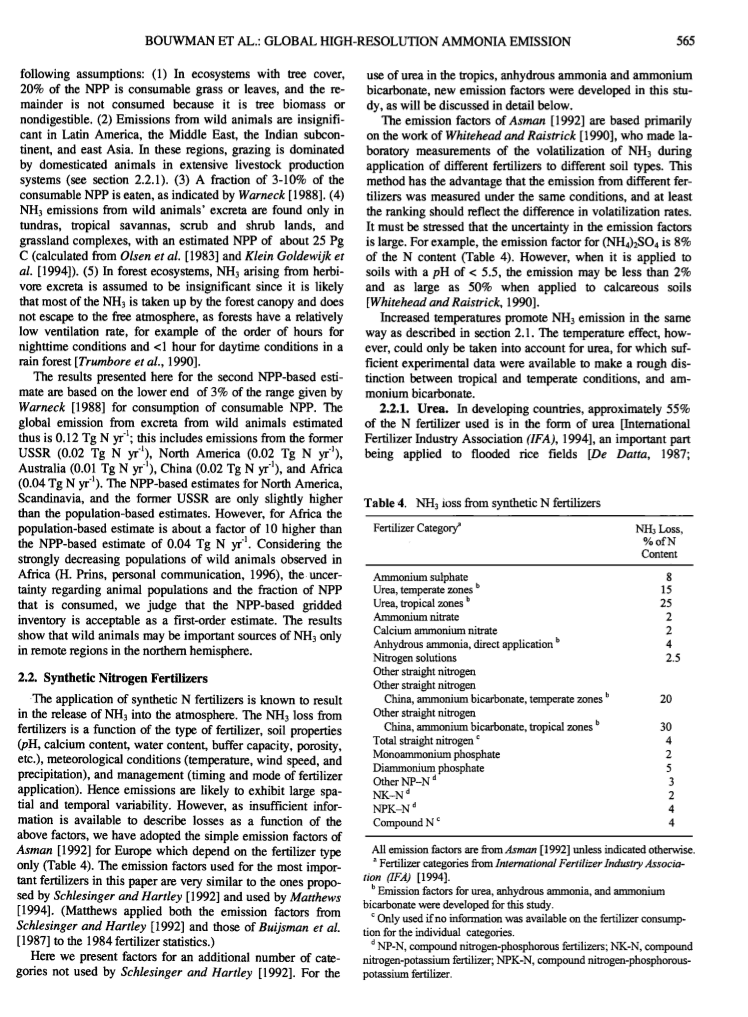
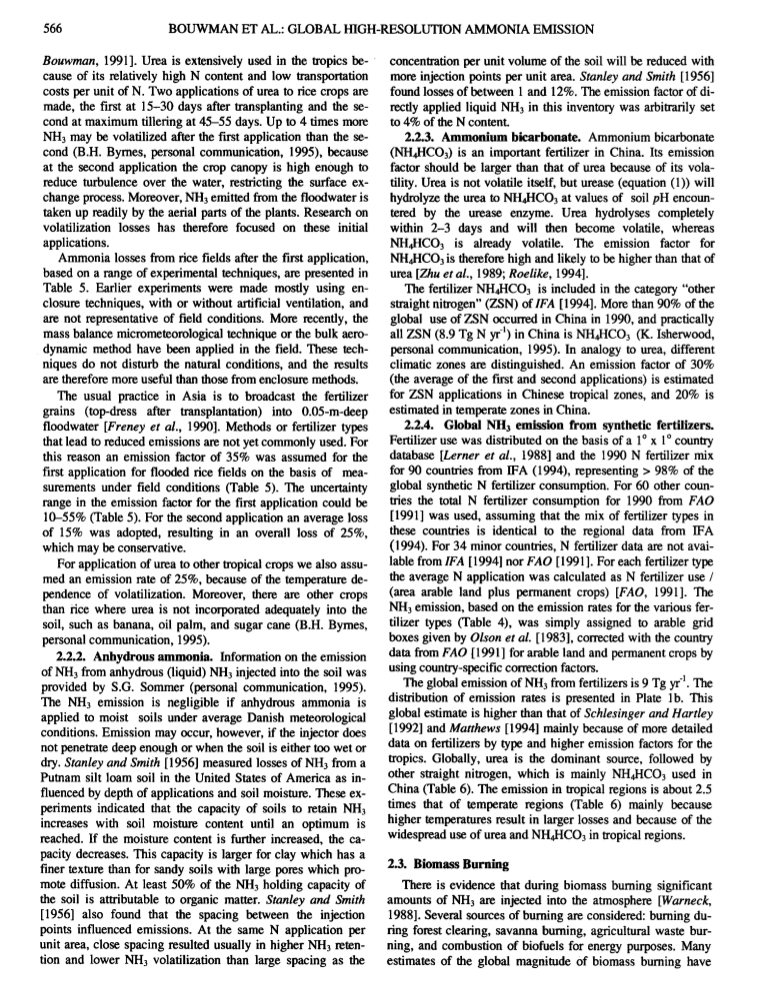
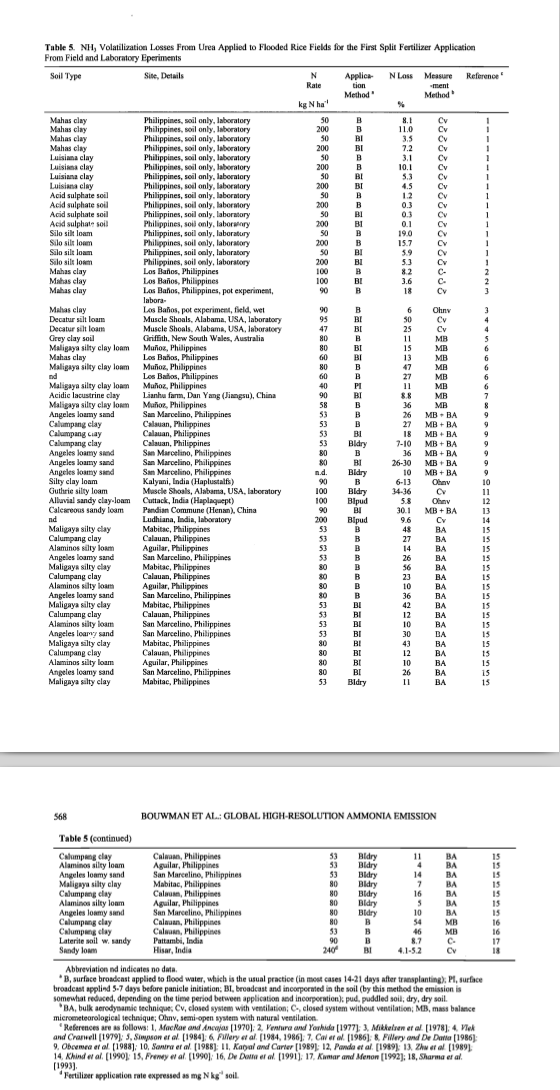
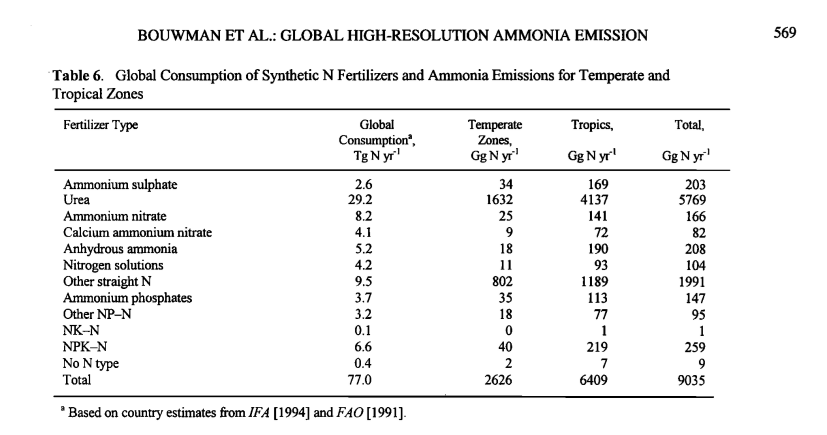
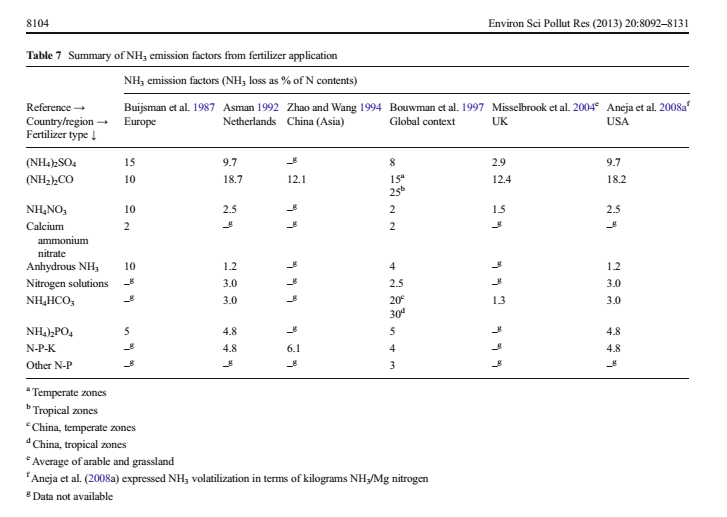
| Bouwman et al., 1997 : A global high-resolution emission inventory for ammonia
|
|---|
 | 
|
|---|
 | 
|
|---|
| Behera et al., 2013 : Ammonia in the atmosphere: a review on emission sources, atmospheric chemistry and deposition on terrestrial bodies.
|
|---|
 | 
|
|---|
III. Evaluation of ammonia emissions results calculated by the model (Fertilizer added)
Where to find the files
- All the scripts used to generate the files.txt and figures are in the folder :
- /home/orchidee03/taudoux/documents/Results/B/Script/
- For the script : script_delta_X.ksh ( X depends on the simulation we are analyzing )
- arg1= Name of the site
- arg2= PFT
- arg3= Last Time Step
Example : ./script_delta_0.5e.ksh FR-Gri 12 730
- Scripts python used to generate graphics are named :
- barplot_X.py ( X depends on the simulation we are analyzing)
- Others scripts don't need arguments and generate files.txt according to their appellation :
- 0.5 --> Simuls_ratio0.5_v1/ ; 0.8 --> Simuls_ratio0.8_v1/ (0.5 ; 0.8 correspond to the ratio NH4/NO3 for the fertilizer)
- x --> EFx/ ; (x = b to g ; those letters correspond to the method I called "x" used to analyze the run )
- Runs were launched in the folders /home/orchidee03/taudoux/
- files.txt are in the folders :
- /home/orchidee03/taudoux/documents/Results/B/Simuls_ratio0.5_v1/
- /home/orchidee03/taudoux/documents/Results/B/Simuls_ratio0.5_v2/
- /home/orchidee03/taudoux/documents/Results/B/Simuls_ratio0.8_v1/
- /home/orchidee03/taudoux/documents/Results/B/Simuls_ratio_init/
- /home/orchidee03/taudoux/documents/Results/B/RundBis/
V1/ -> Sensitivity of NH3 emissions to the intensity of fertilization
V2/ and RundBis/? -> Evaluation of a new model version for denitrification v2 corresponds to the upper bound and RundBis? to the lower bound.
Init -> variable affecting denitrification called "anvf" was deleted.
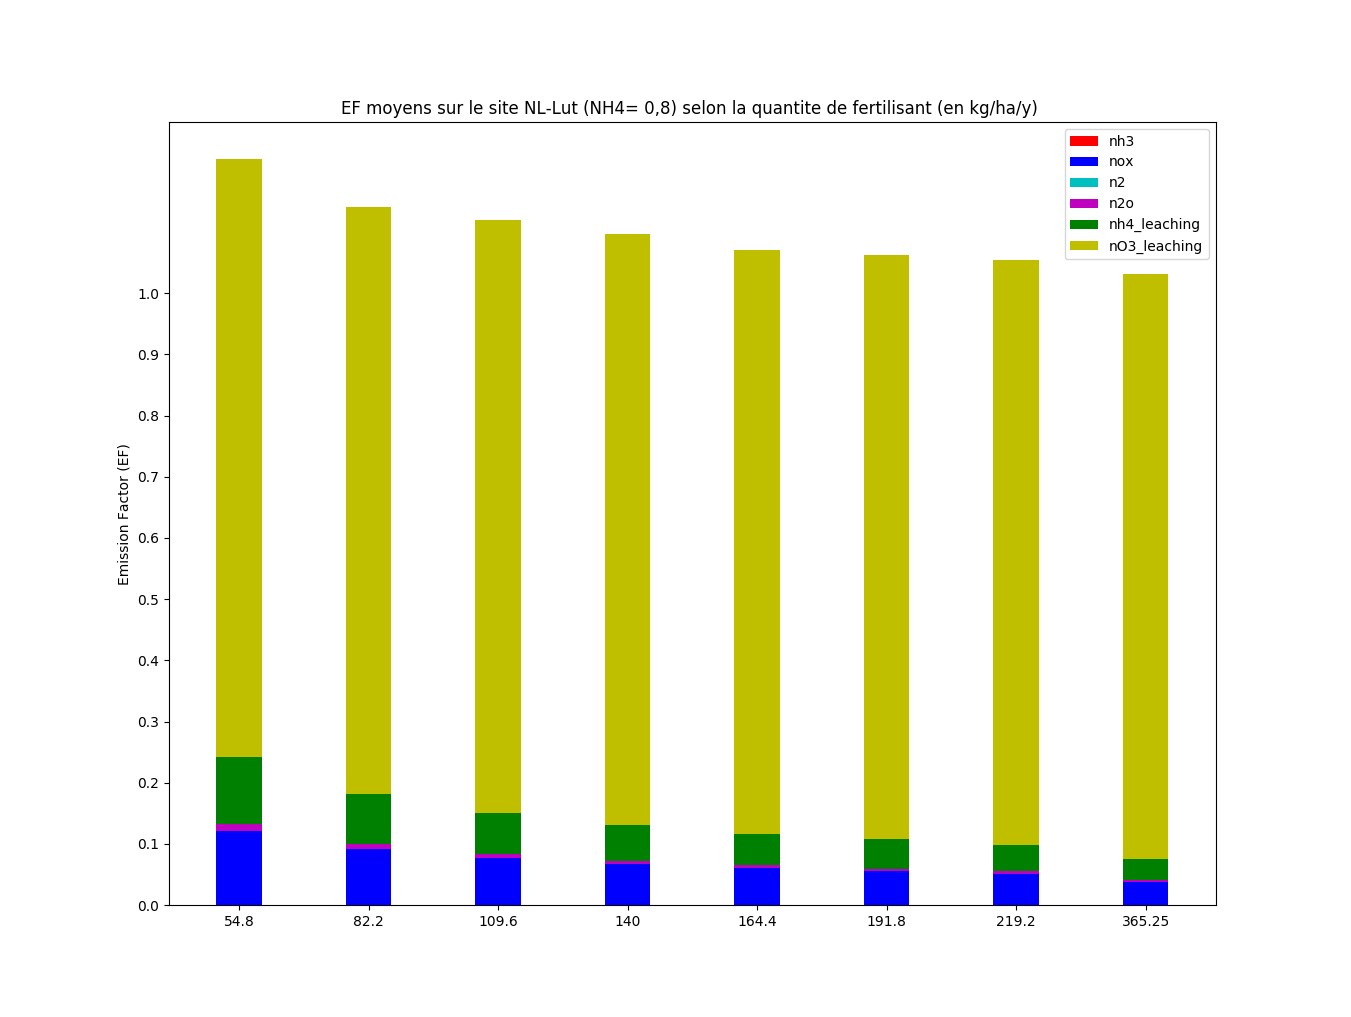
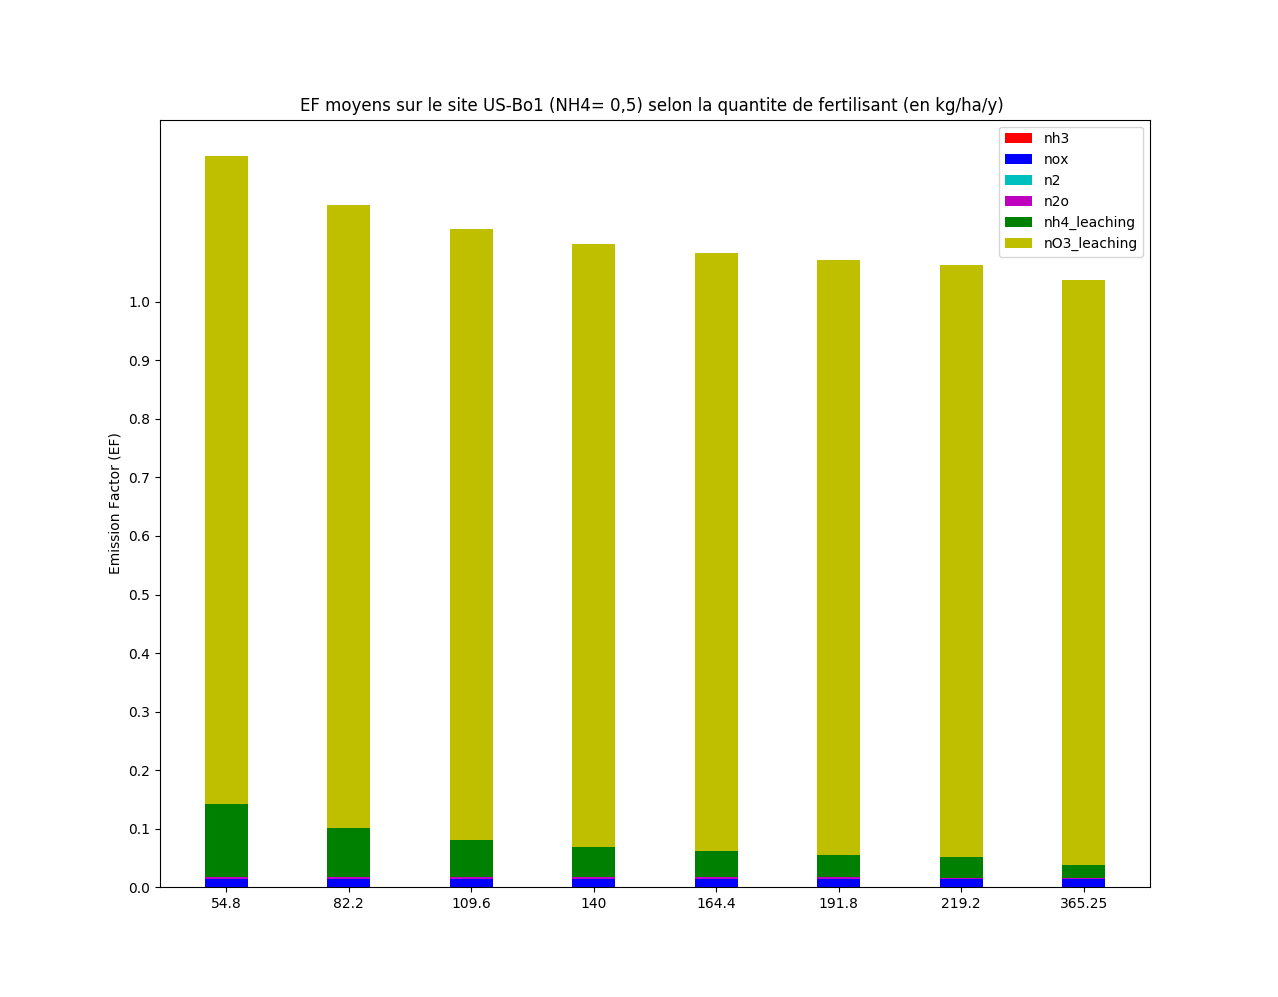
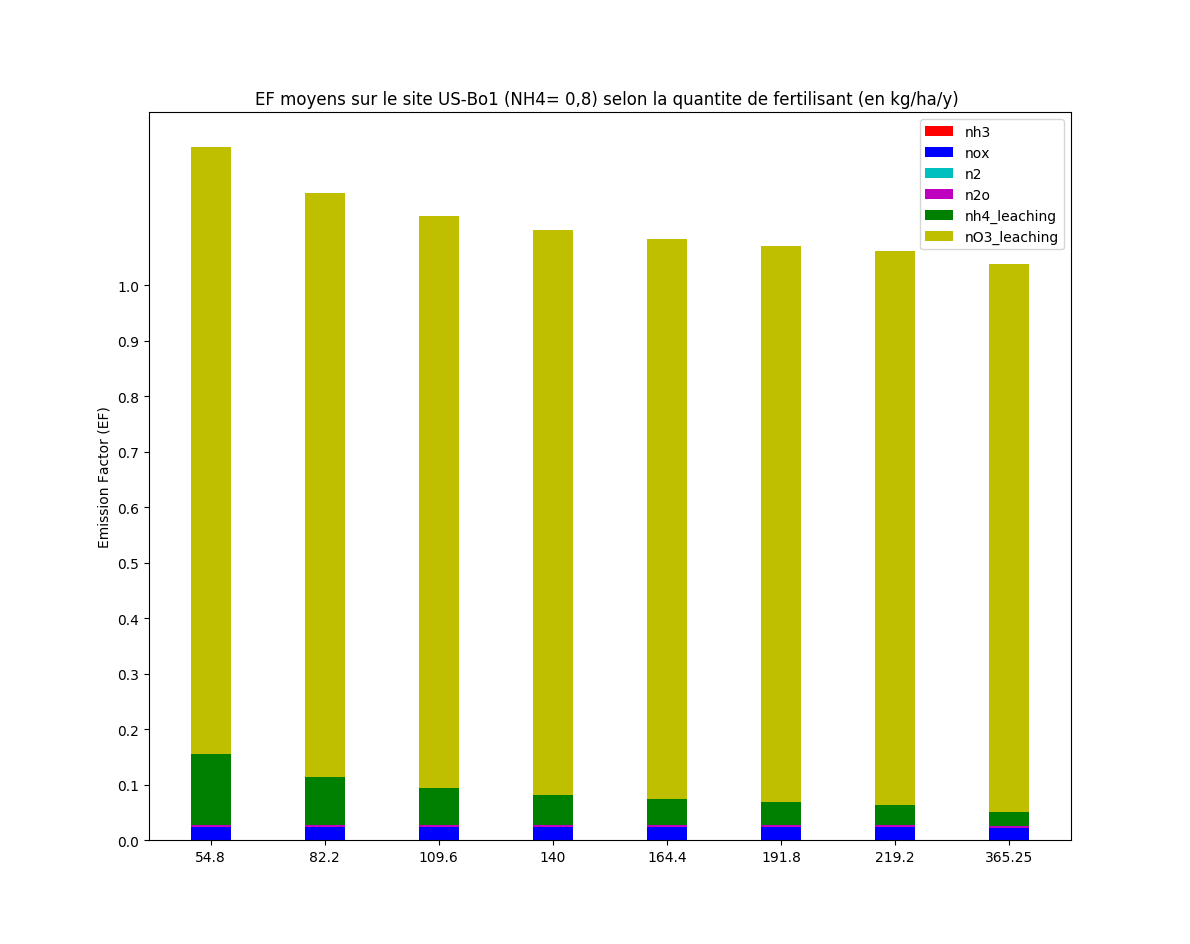
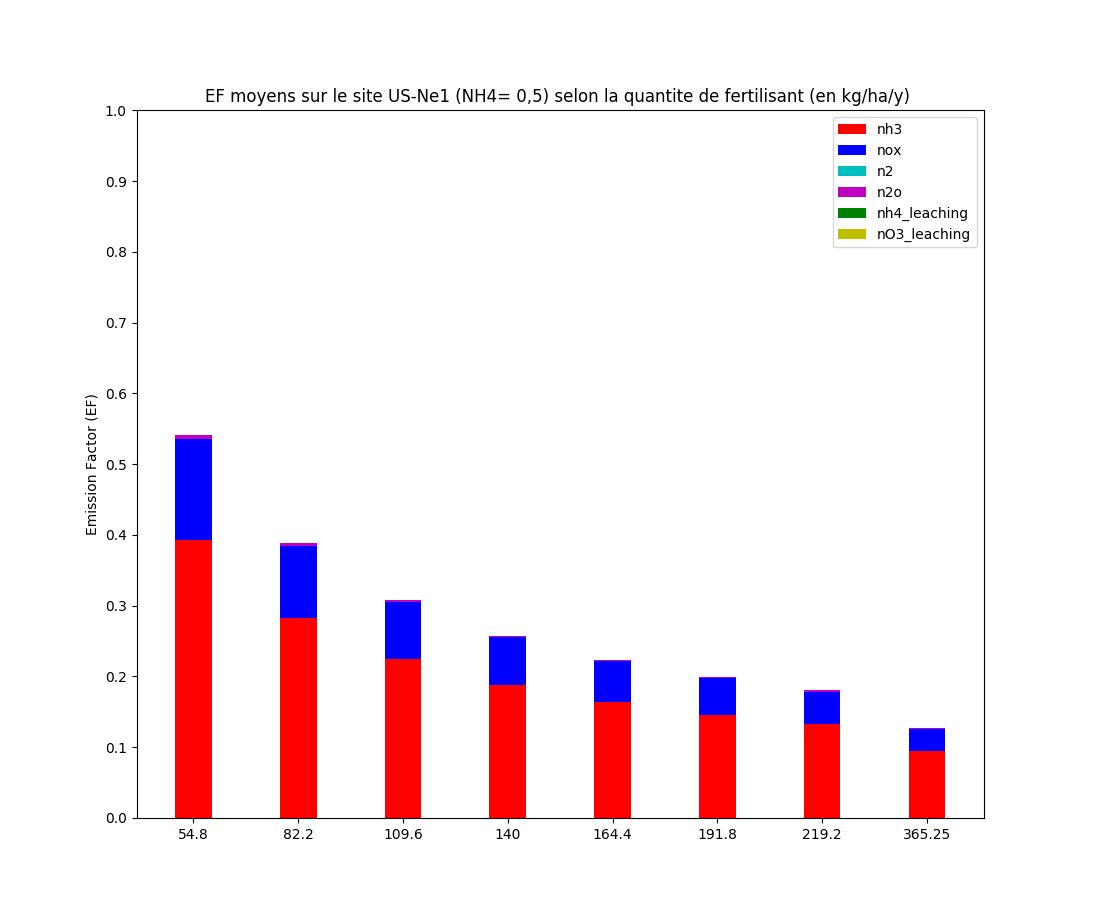
We calculated emission factor (EF) of different fluxes of nitrogen (NH3, N2, N2O and NOx emission, but also NH4 and NO3 leaching) with different methods :
- A. consisted to normalized the fluxes minus emissions when nfert=0 by the amount of fertilizer added
- B. consisted to normalized the fluxes by the amount of fertilizer added
- C. consisted to normalized the fluxes by the amount of all nitrogen inputs
- D. Evaluation of the model v1
- E. Evaluation of a new model version for denitrification v2 corresponds to the upper bound
- F. Evaluation of a new model version for denitrification v2 corresponds to the lower bound
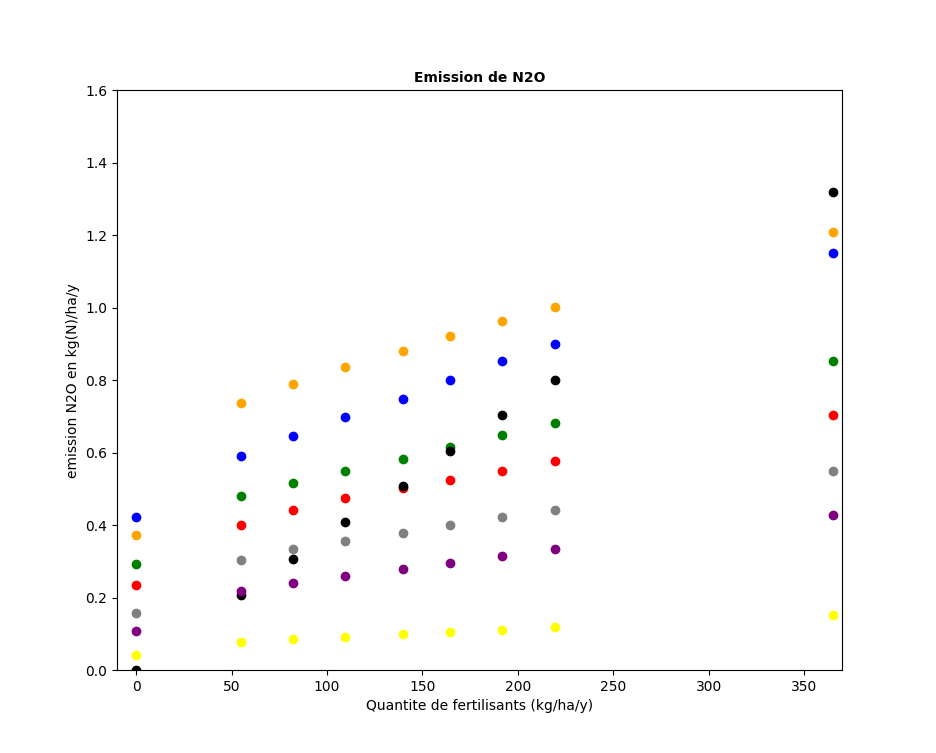
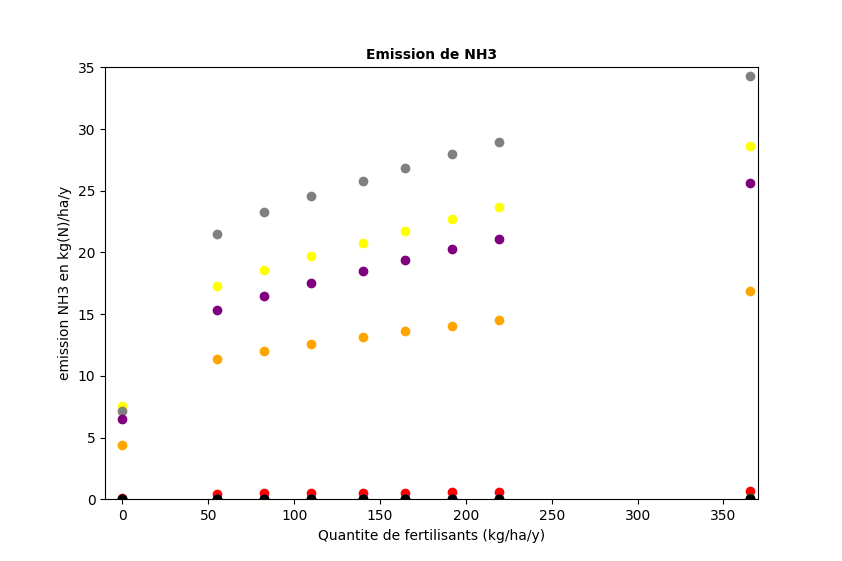
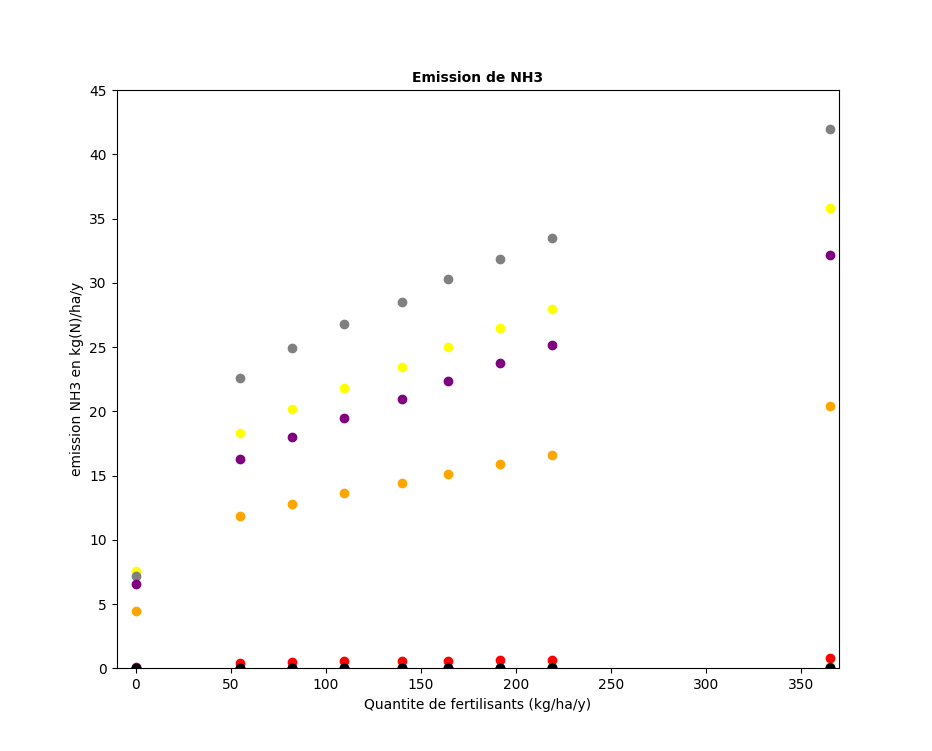
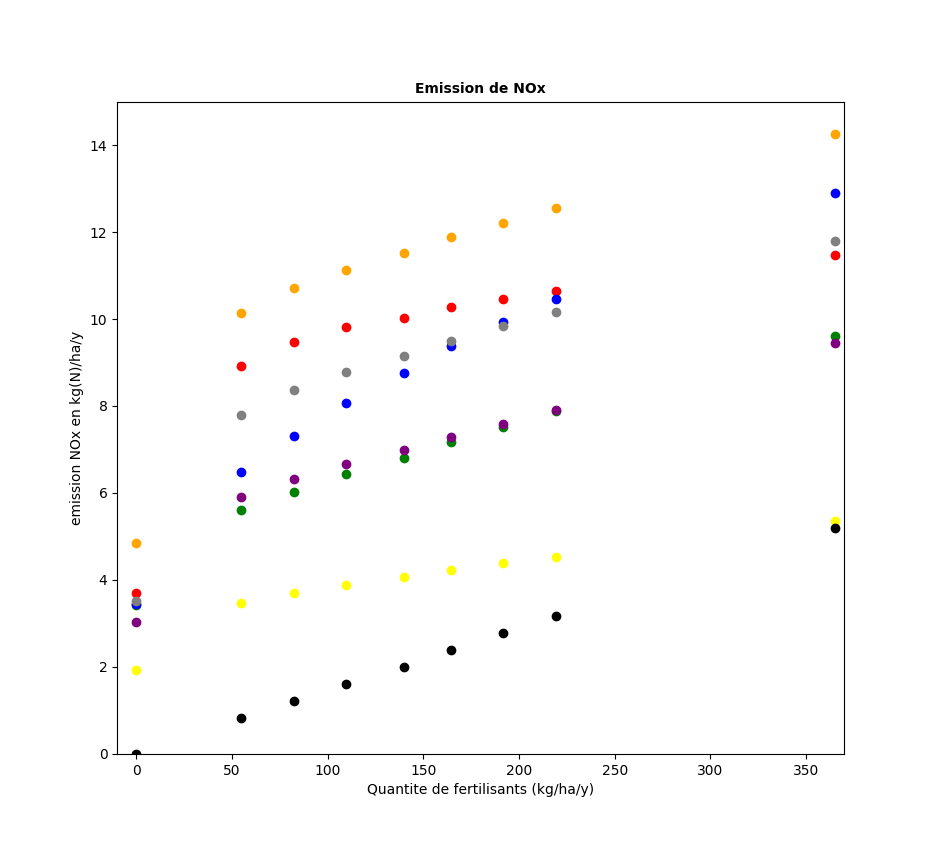
Sensitivity of NH3 emissions to the intensity of fertilization
Separation of nitrogen input. Initially fertilizer, bnf and atmospheric deposition were in the same loop
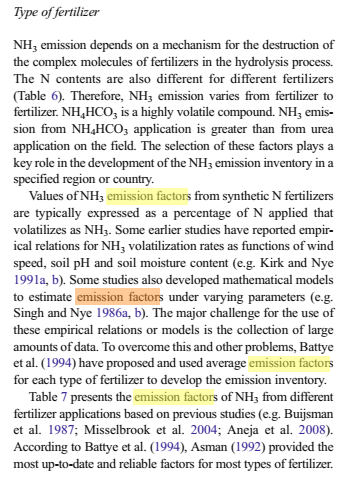
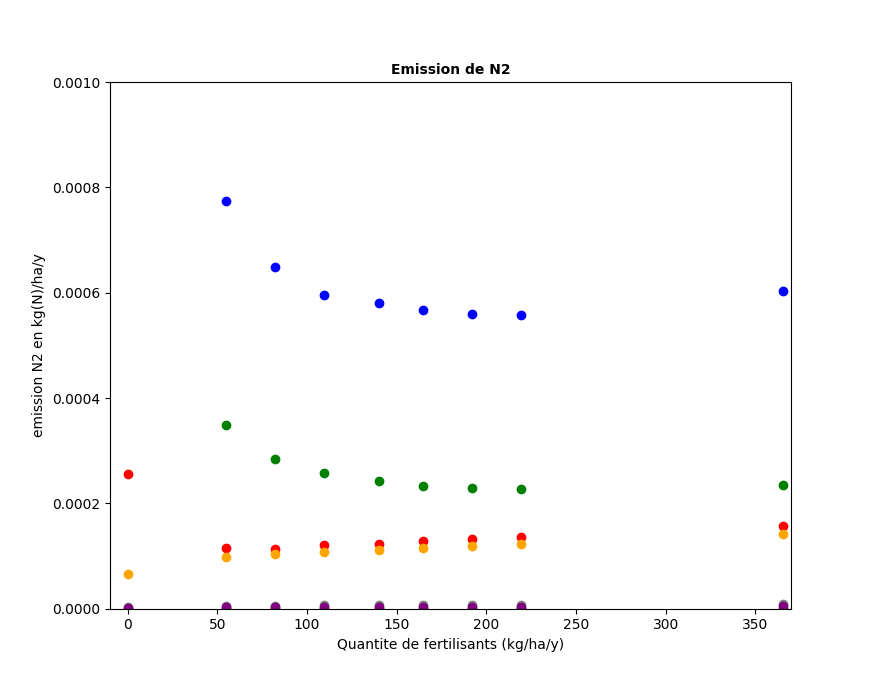
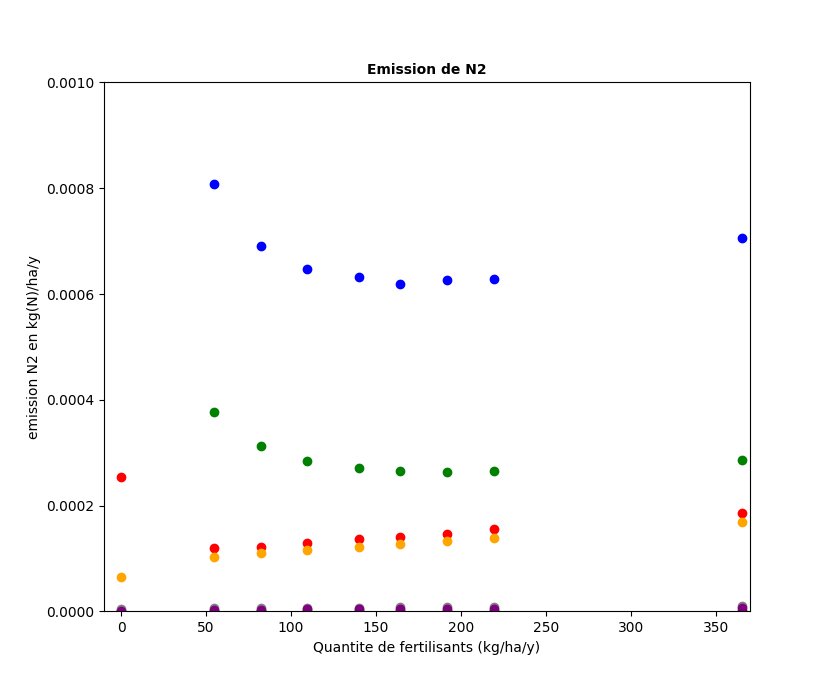
Multiple simulations were run with different amount of fertilizer (0 , 0.015, 0.0225, 0.03, 0.0375, 0.045 , 0.0525, 0.06 and 0.1 g.m-2.day-1).
Each simulation were run with two different ratio of NH4 in the fertilizer : 0.5 and 0.8.
We obtain same results when nfert=0 or when nfert is not precised.
- Sites we looked at and their PFT :
| PFT | Sites
|
|---|
| 12 | FR-Gri ; DK-Ris ; NL-Lut
|
| 13 | NL-Lan ; US-Bo1 ; US-Ne1 ; US-Ne2 ; US-Ne3
|
/home/orchidee03/taudoux/documents/Results/B/Simul_ratio0.5_v1/
/home/orchidee03/taudoux/documents/Results/B/Simul_ratio0.8_v1/
- Parameters studied
- Temperature
- Humidity
- Nitrogen Pools (soil_nh4, soil_no3, Soil_nox and soil_n2o) and Leaching (NH4 and NO3)
- Emissions (NH3, N2, N2O, NOX)
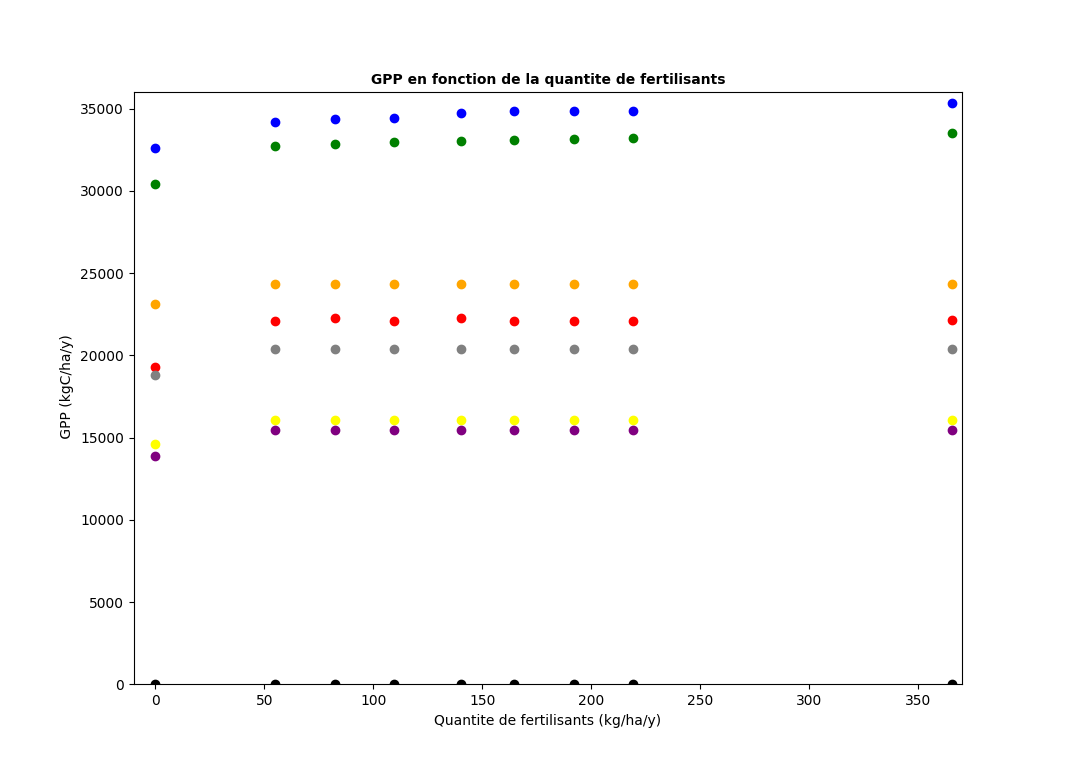
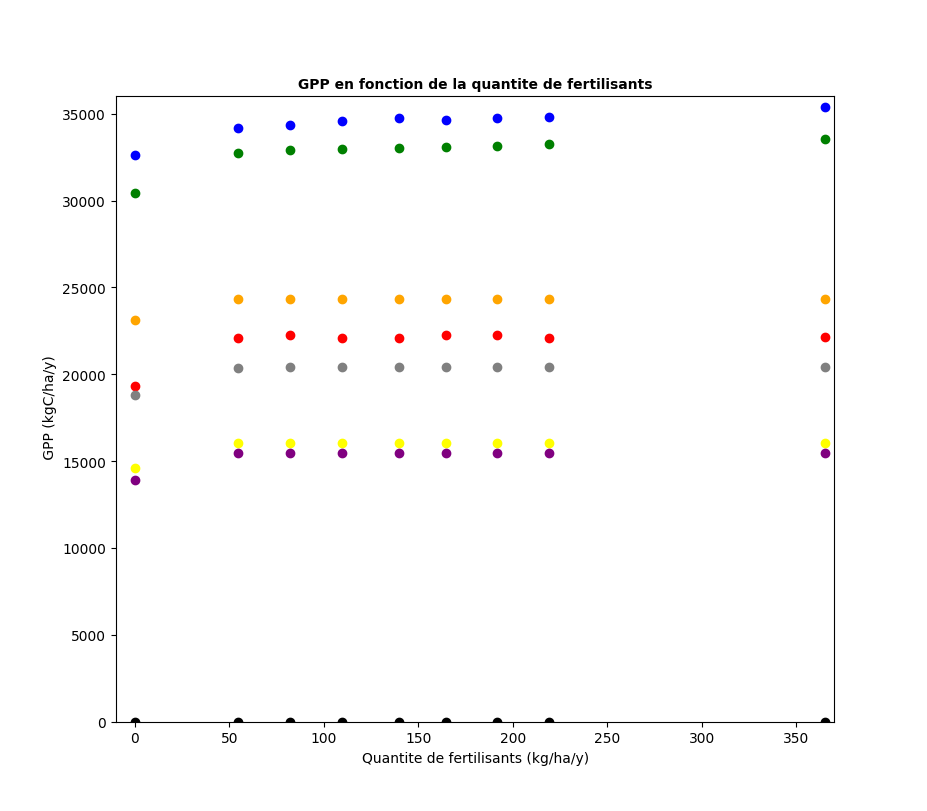
- GPP
- Nitrogen input summed (fertilizer, NHX and NOX depositions)
- SOIL_ACTIVE_N , SOIL_SURF_N , SOIL_SLOW_N , SOIL_PASSIVE_N , TOTAL_M_N LITTER_STR_AB_N , LITTER_MET_AB_N , LITTER_STR_BE_N , LITTER_MET_BE_N , LITTER_WOD_AB_N , LITTER_WOD_BE_N (in "delta_stock" with others delta stock of soil nitrogen pools for analysis about loop at ORCHIDEE scale)
Respectively in the folders Parameters (T° and Hum), Pools_fluxes, NH3_EM, DEP_FERT and GPP.
We looked at how those parameters evolved in each site with the amount of fertilizer with both of ammonium's percentage in the fertilizer (0.5 and 0.8).
- Script used : scatterplot_X.py in the folders
- /home/orchidee03/taudoux/documents/Results/B/Simuls_ratio0.5_v1/Graph/
- /home/orchidee03/taudoux/documents/Results/B/Simuls_ratio0.8_v1/Graph/
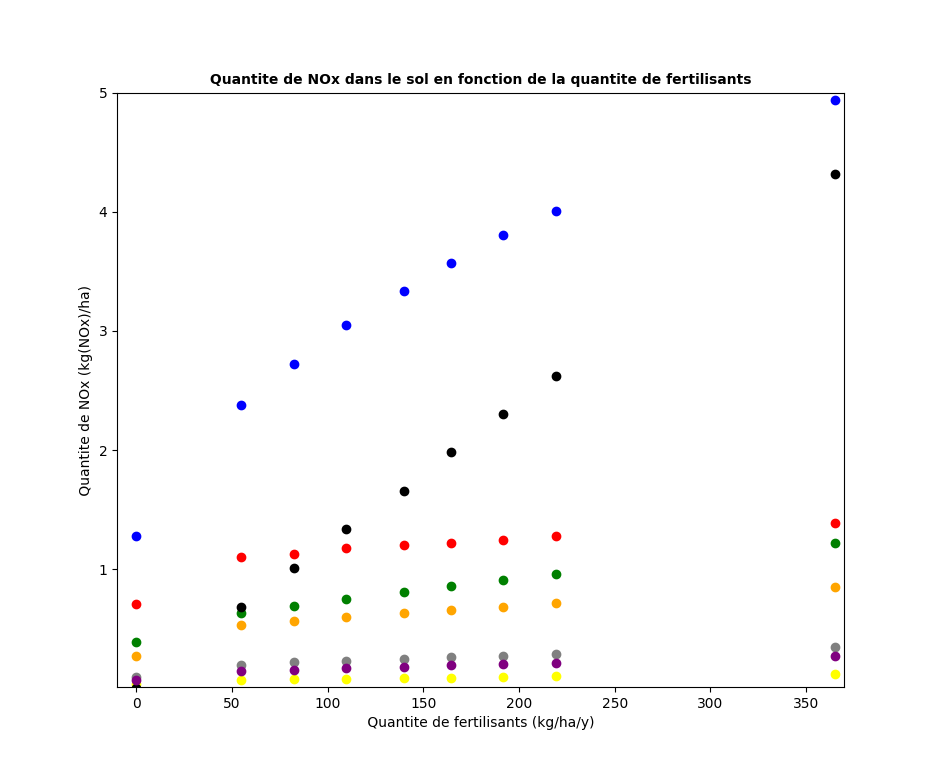
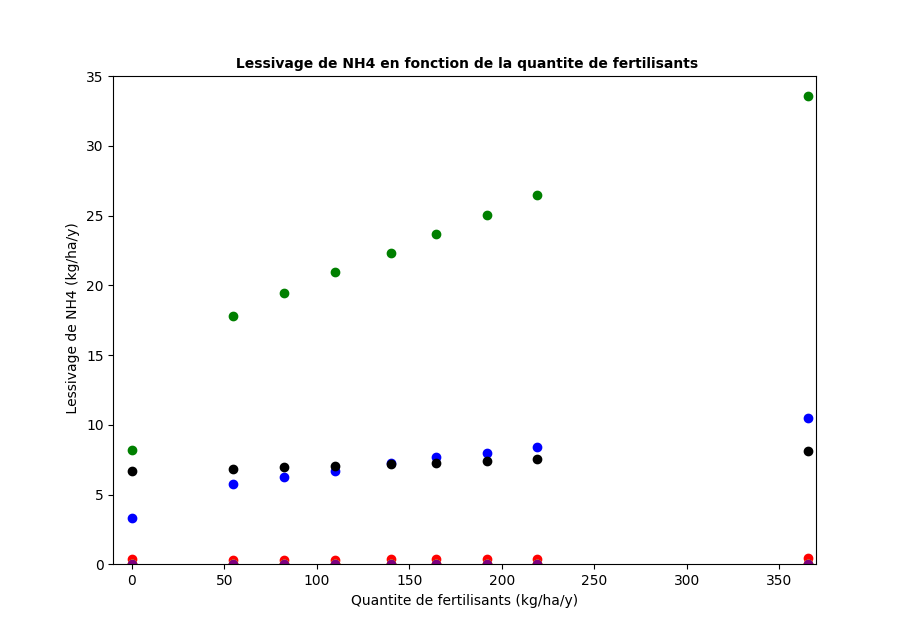
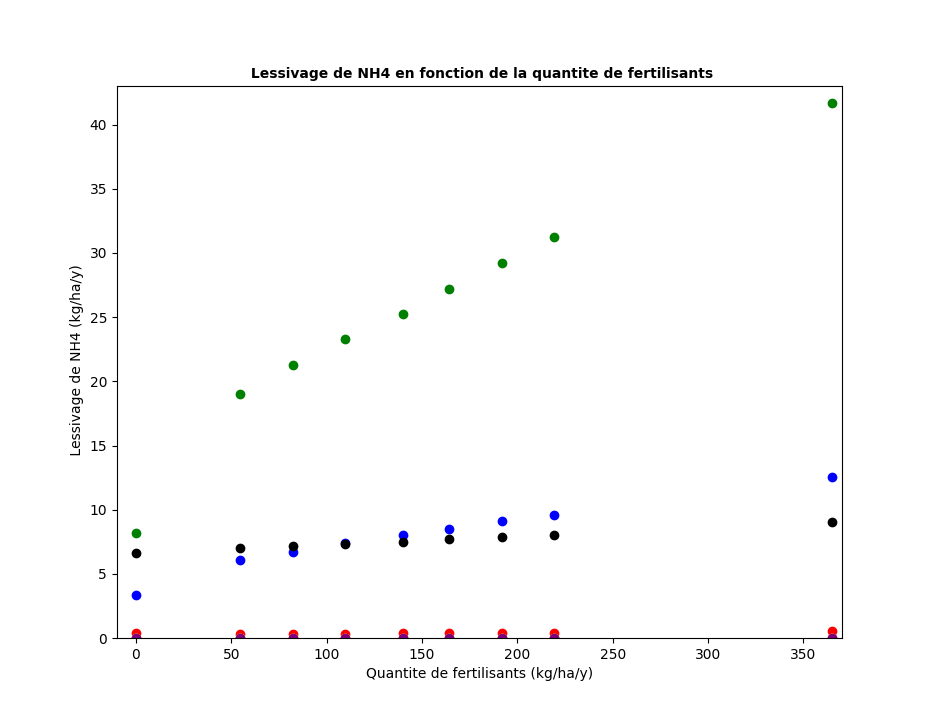
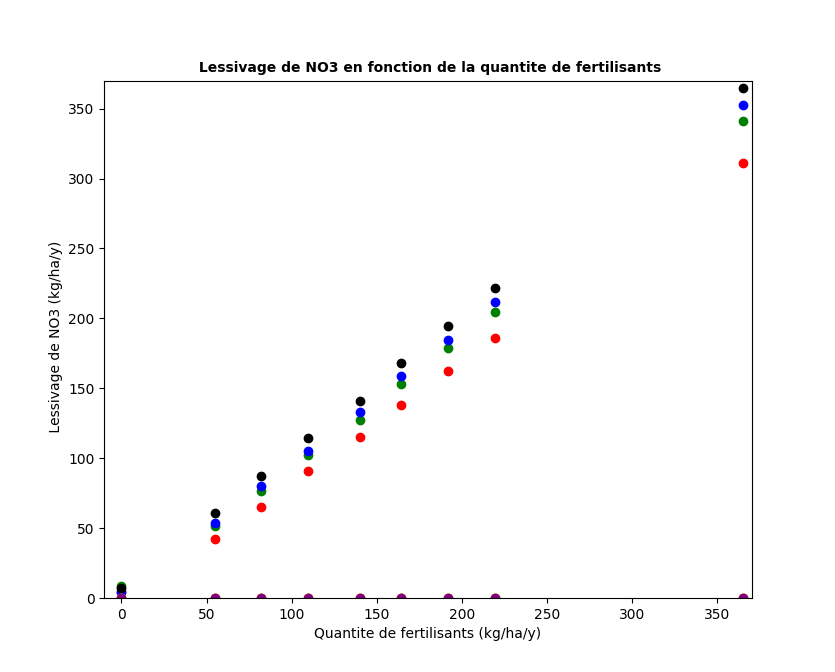
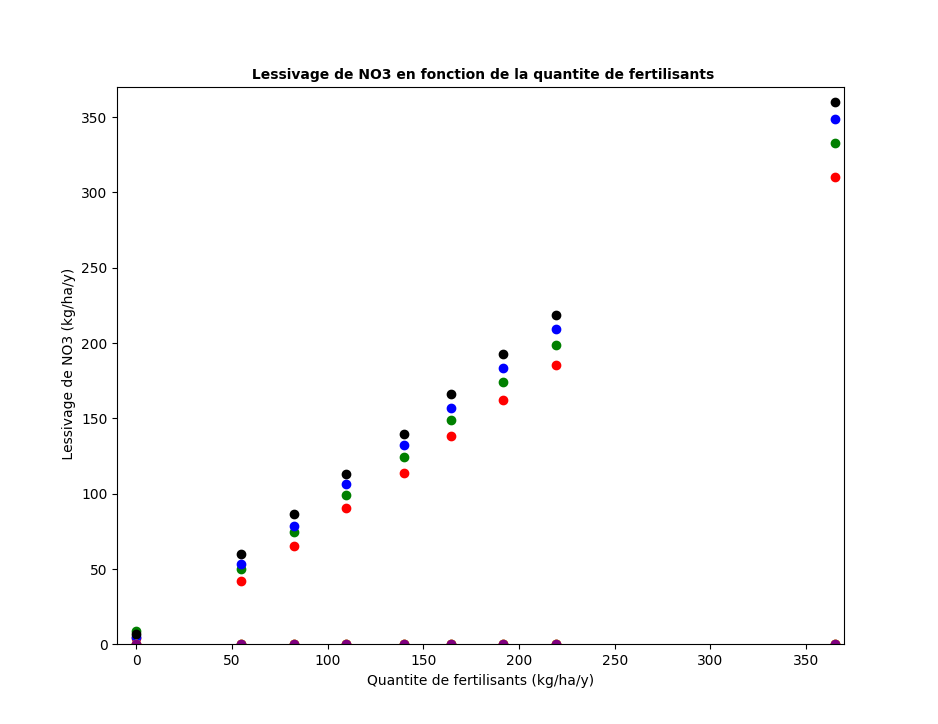
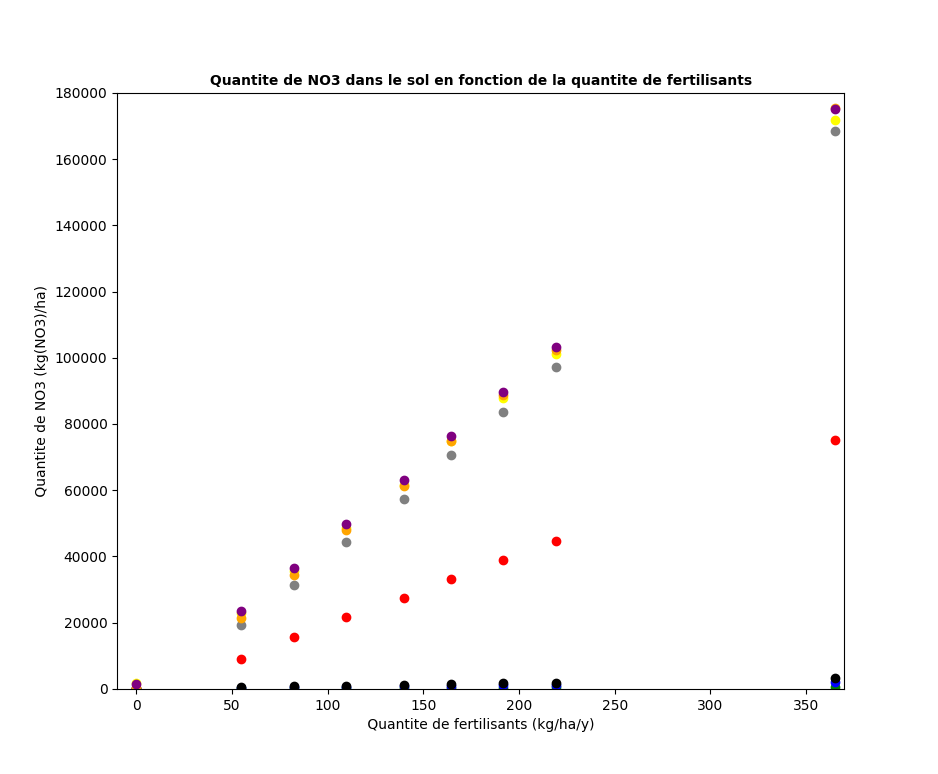
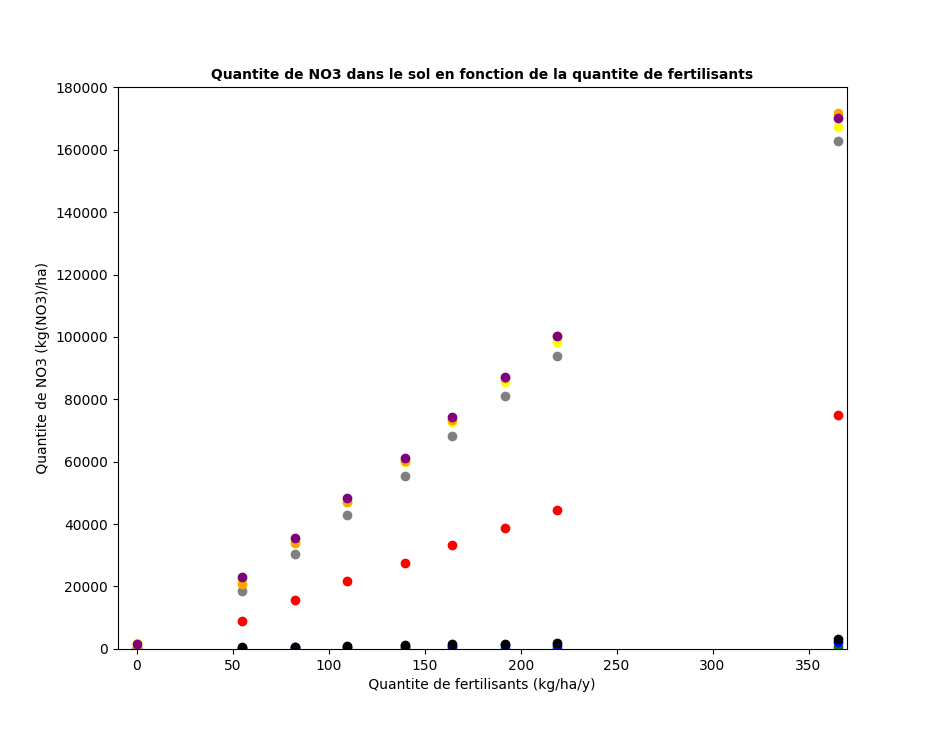
X = em_n2 ; em_n2o ; em_nh3 ; em_nox ; GPP ; leaching_nh4 ; leaching_no3 ; pools_n2 ; pools_n2o ; pools_nh4 ; pools_no3 ; pools_nox.
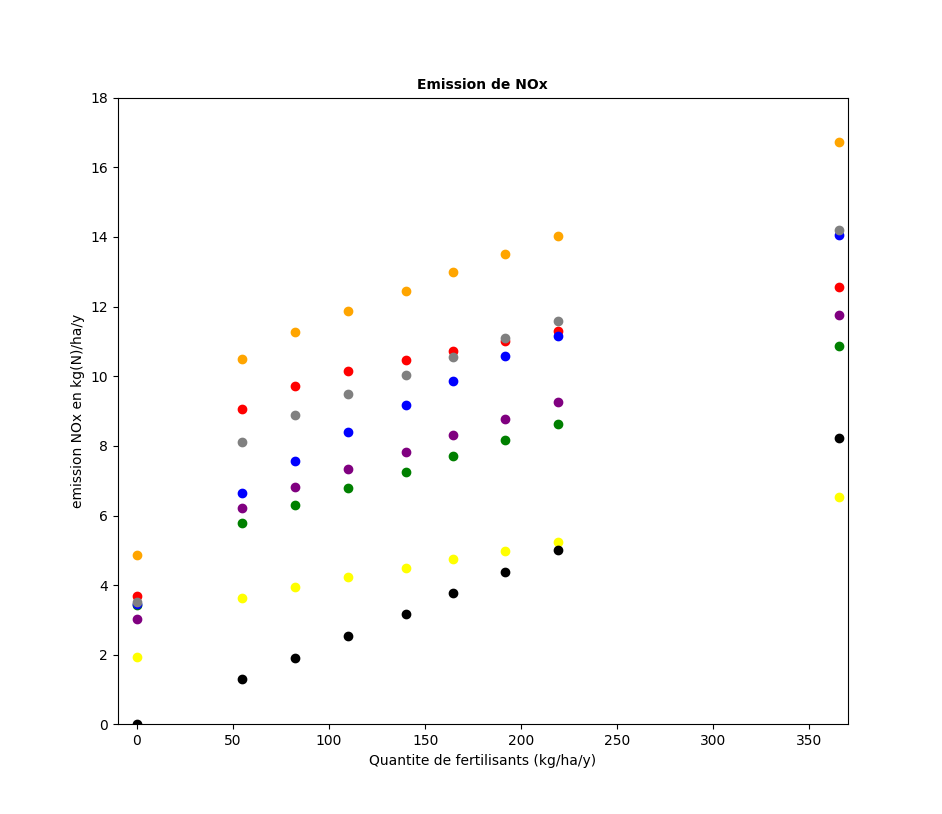
| N2 emission | N2O emission | NH3 emission | NOx emission
|
|---|
| 0.5 | 0.8 | 0.5 | 0.8 | 0.5 | 0.8 | 0.5 | 0.8
|
|---|
 |  |  |  |  |  |  | 
|
|---|
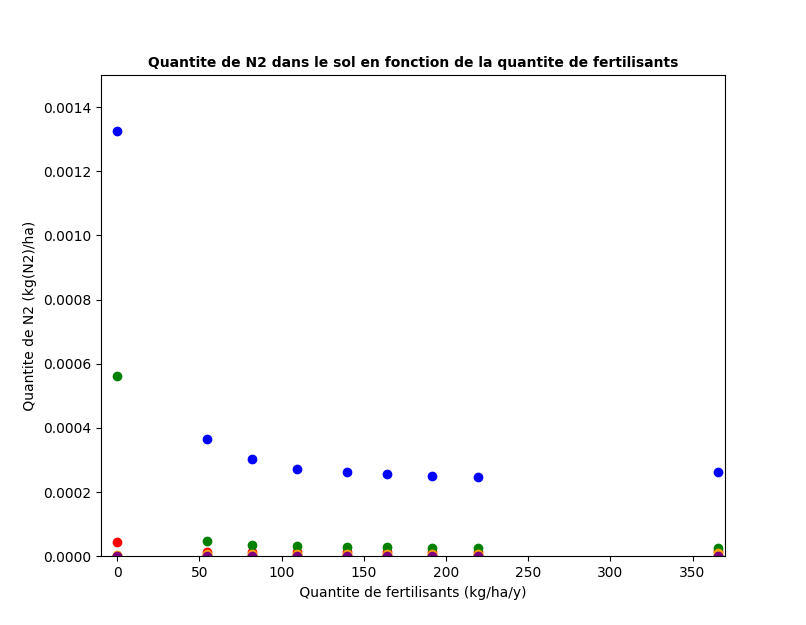
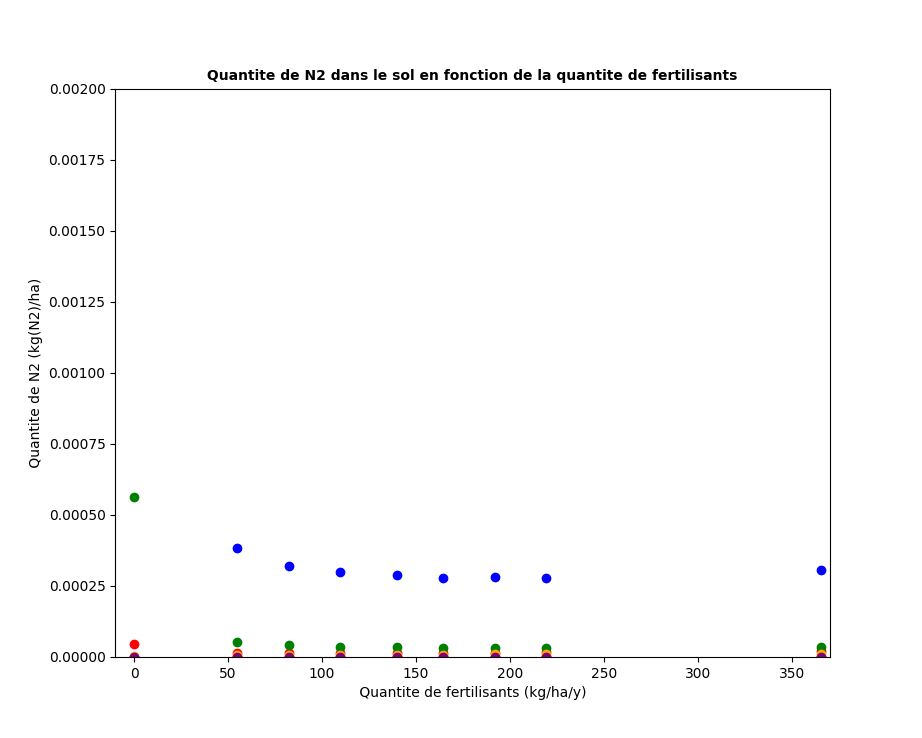
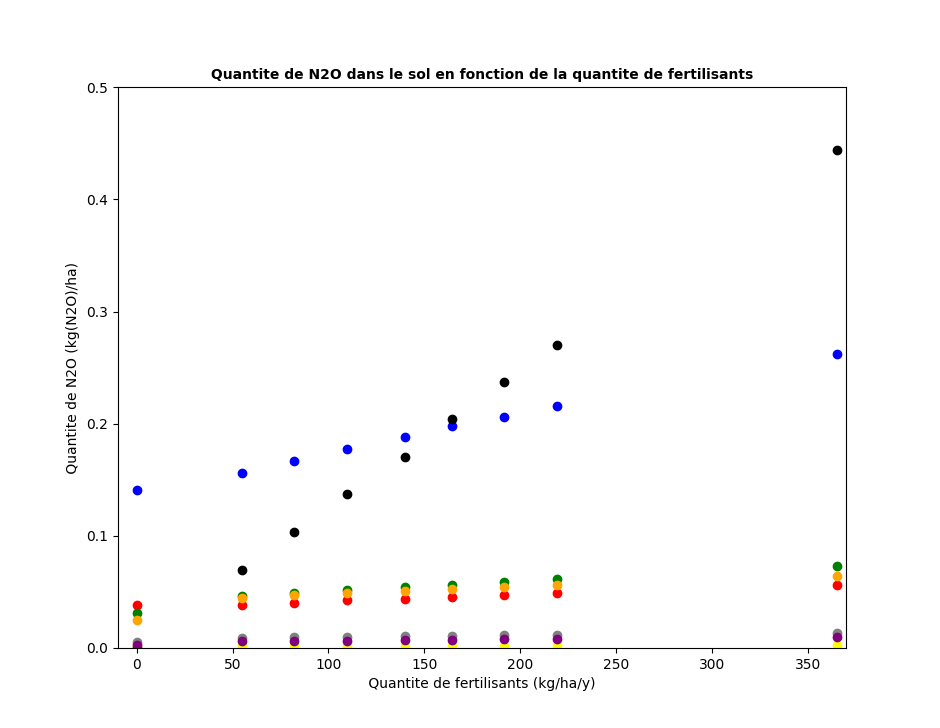
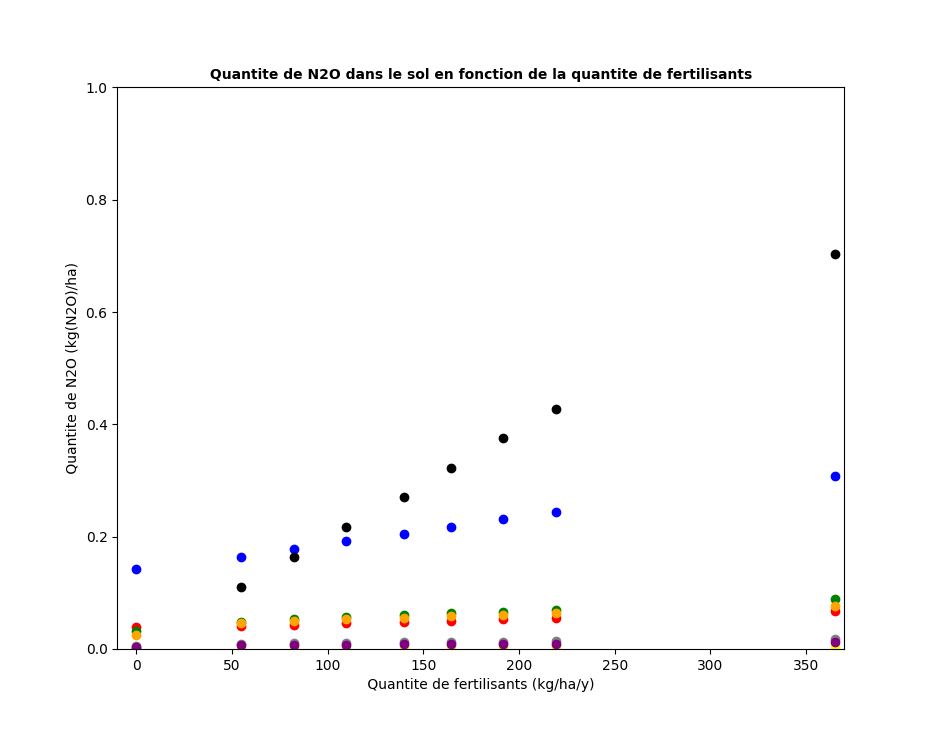
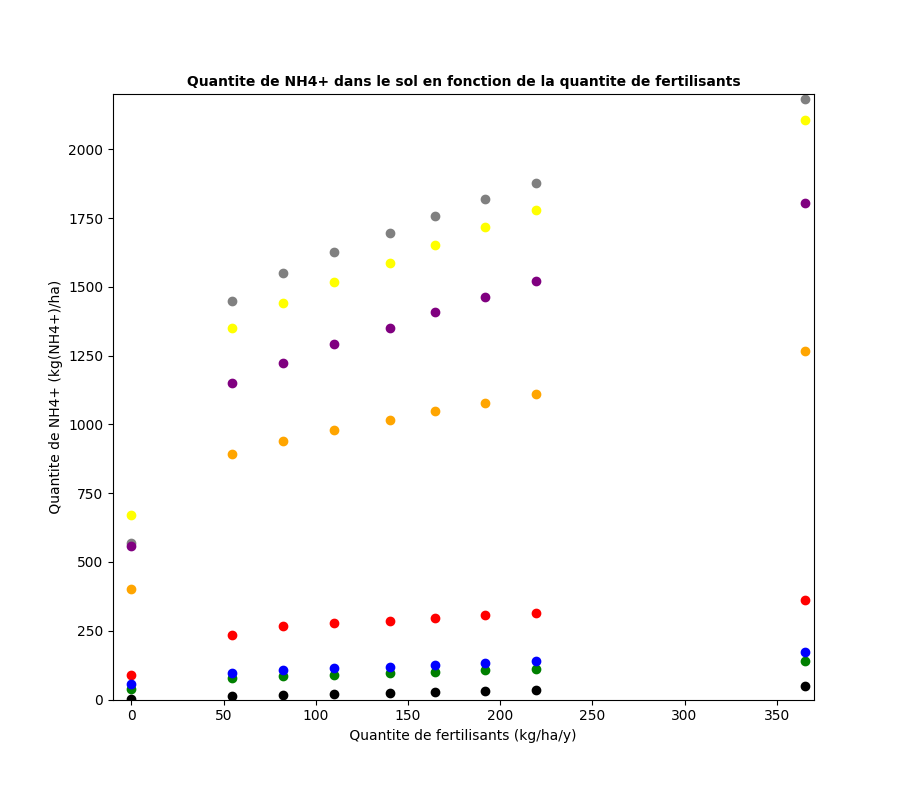
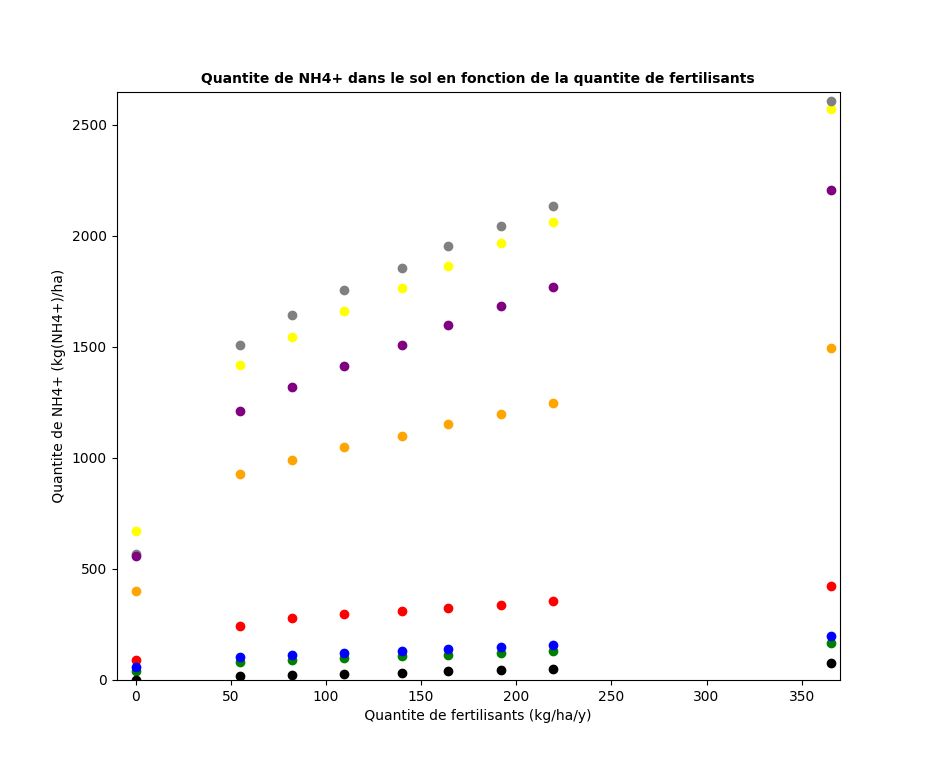
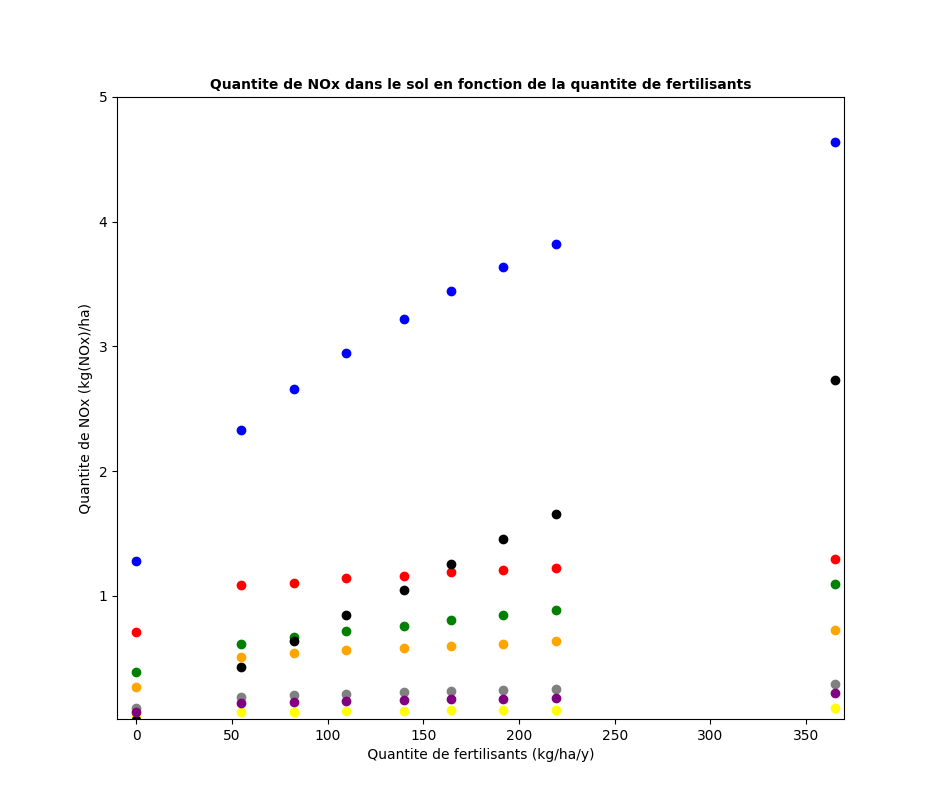
| Soil N2 | Soil N2O | Soil NH4 | Soil NOx
|
|---|
| 0.5 | 0.8 | 0.5 | 0.8 | 0.5 | 0.8 | 0.5 | 0.8
|
|---|
 |  |  |  |  |  |  | 
|
|---|
| NH4 leaching | NO3 leaching | Soil NO3 | GPP
|
|---|
| 0.5 | 0.8 | 0.5 | 0.8 | 0.5 | 0.8 | 0.5 | 0.8
|
|---|
 |  |  |  |  |  |  | 
|
|---|
- Legend :
- Red = DK-Ris
- Yellow = FR-Gri
- Green = NL-Lan
- Blue= NL-Lut
- Black= US-Bo1
- Gray = US-Ne1
- Orange = US-Ne2
- Purple = US-Ne3
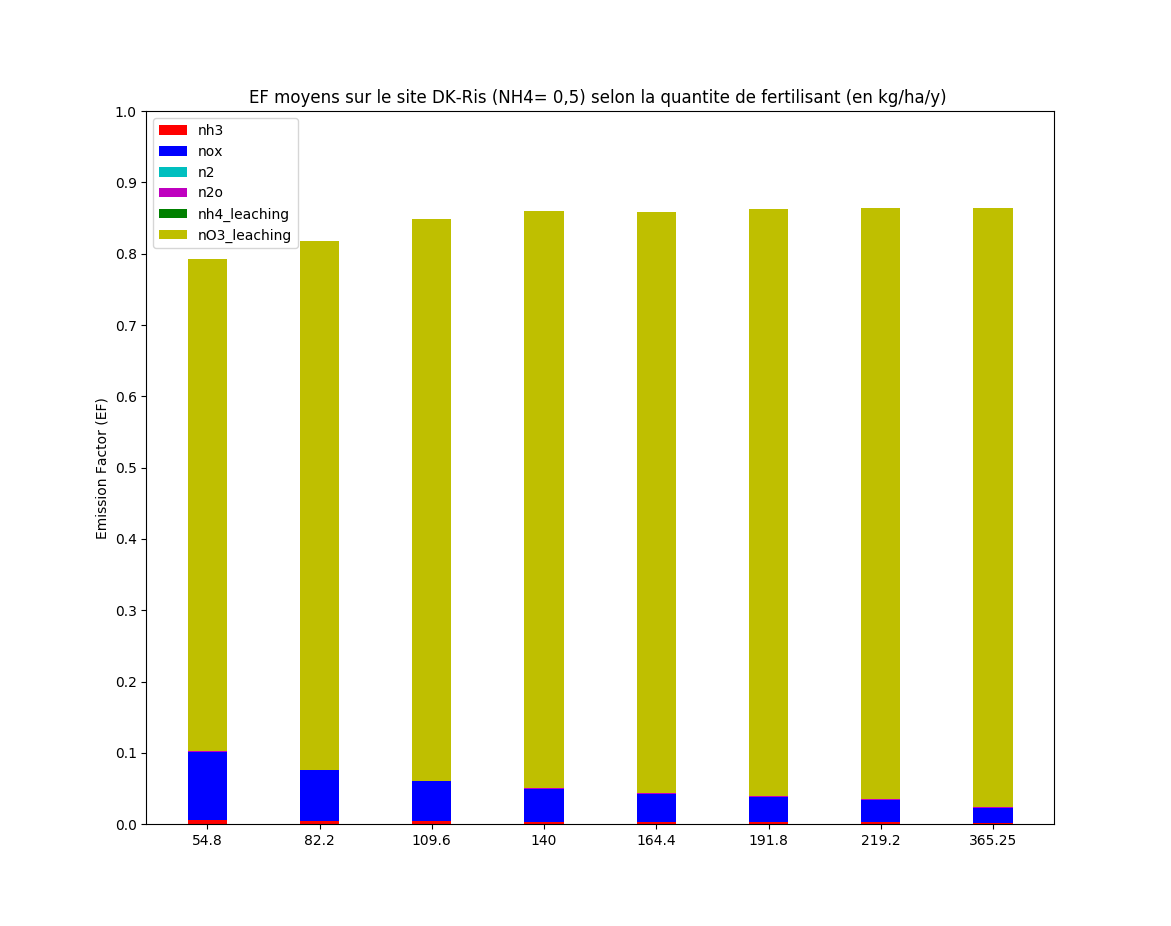
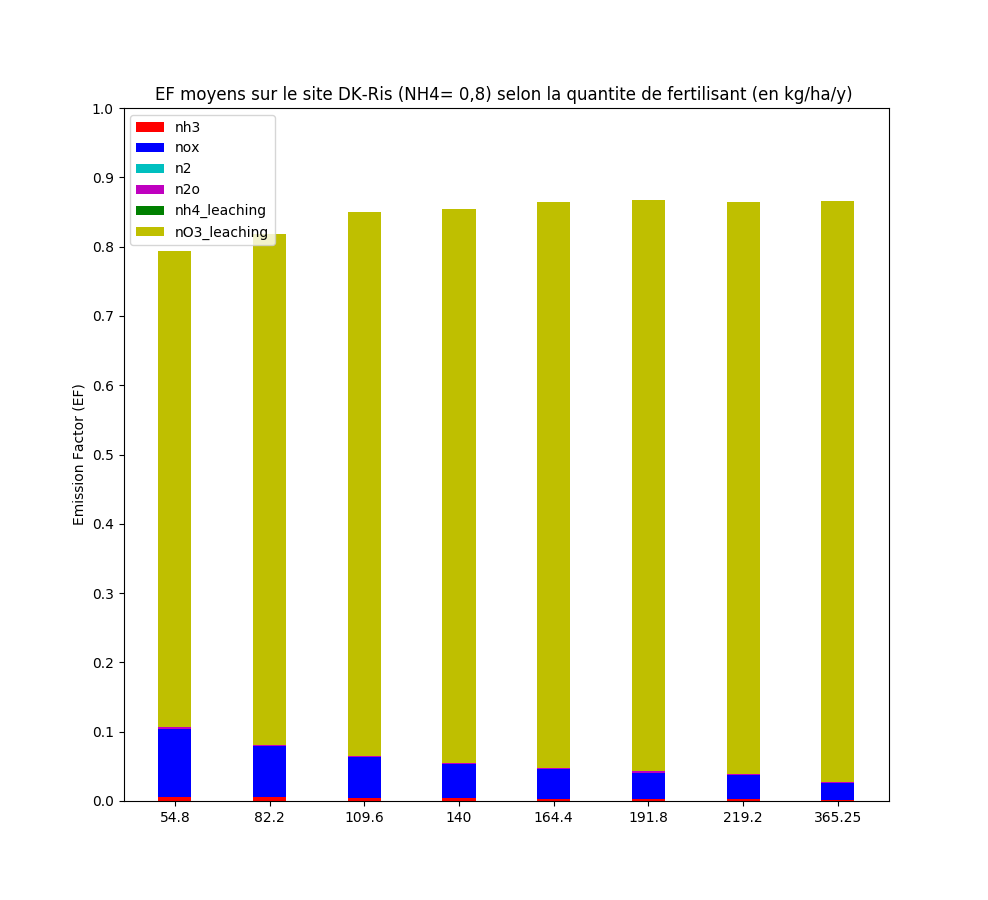
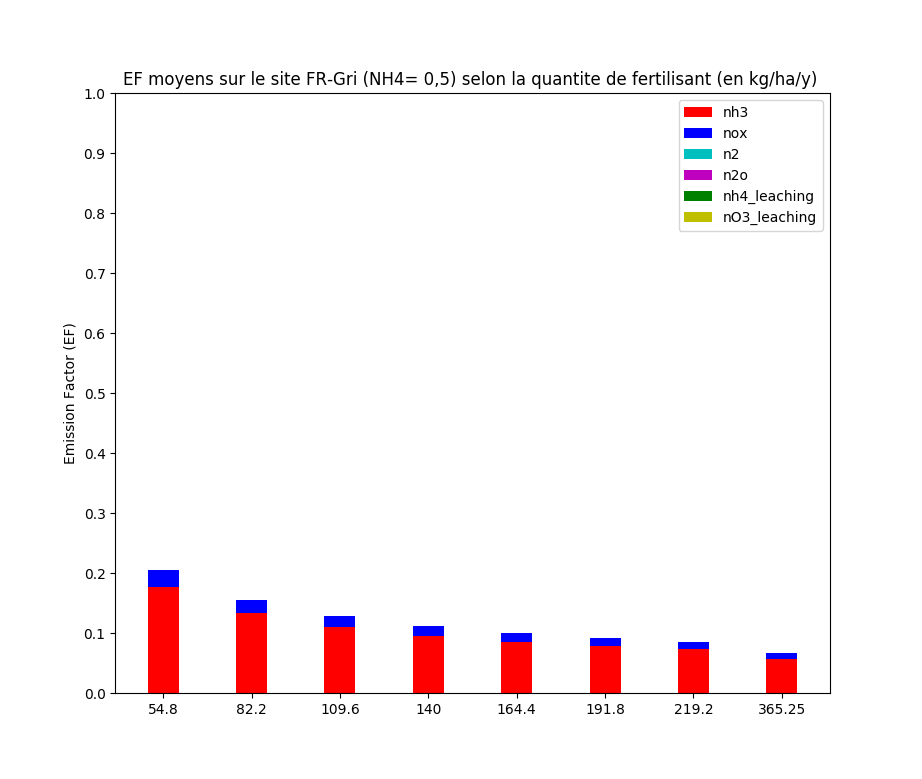
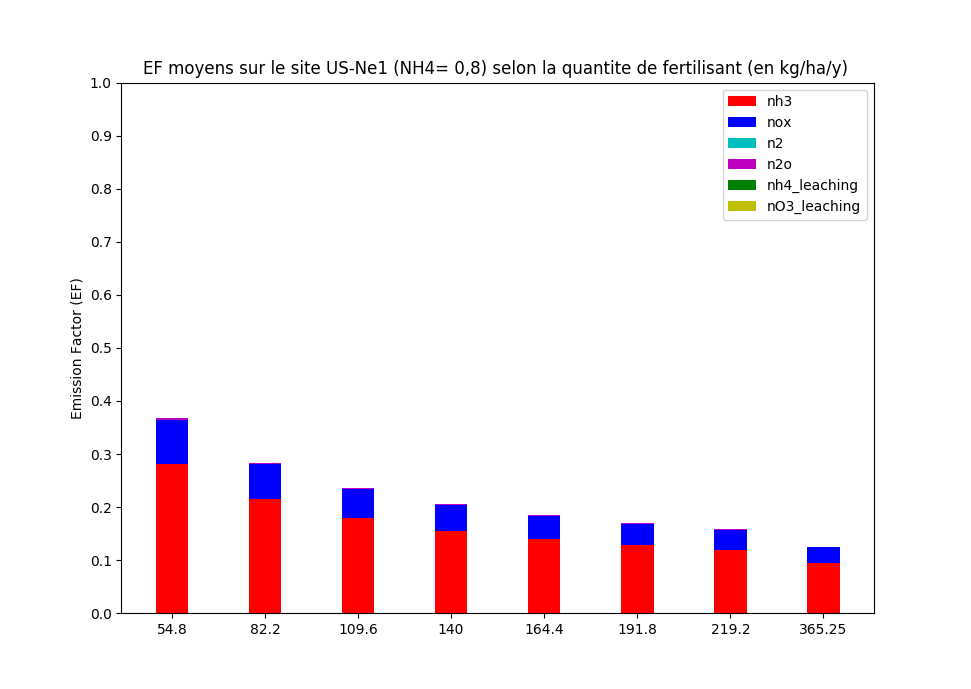
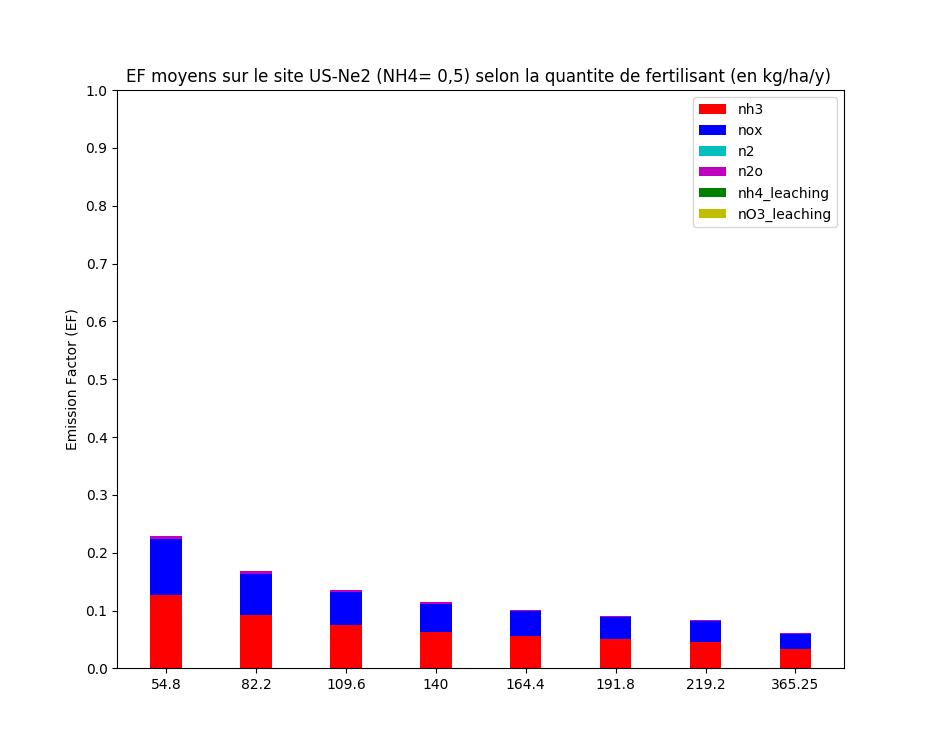
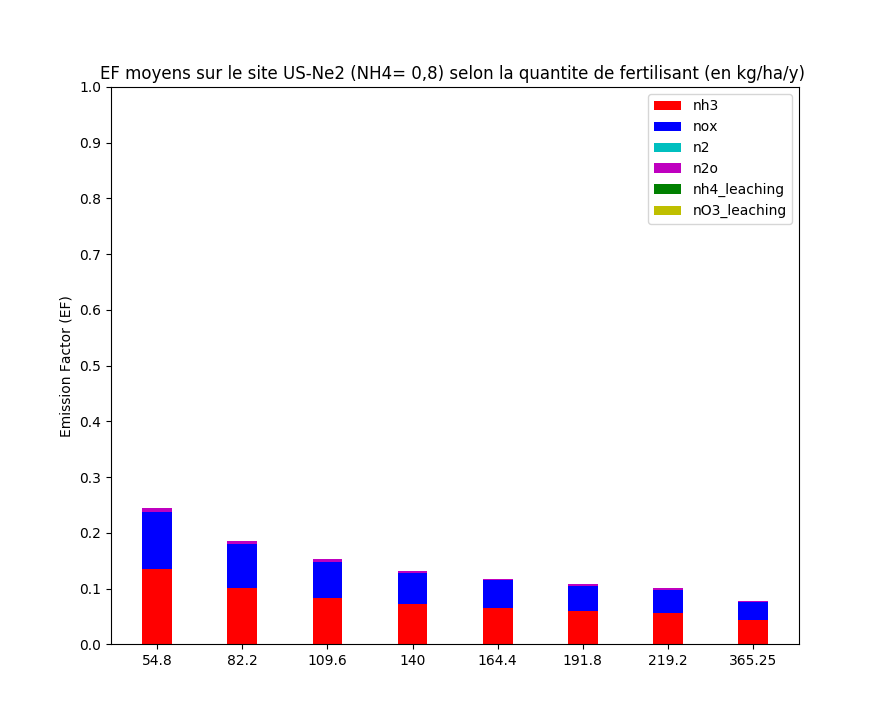
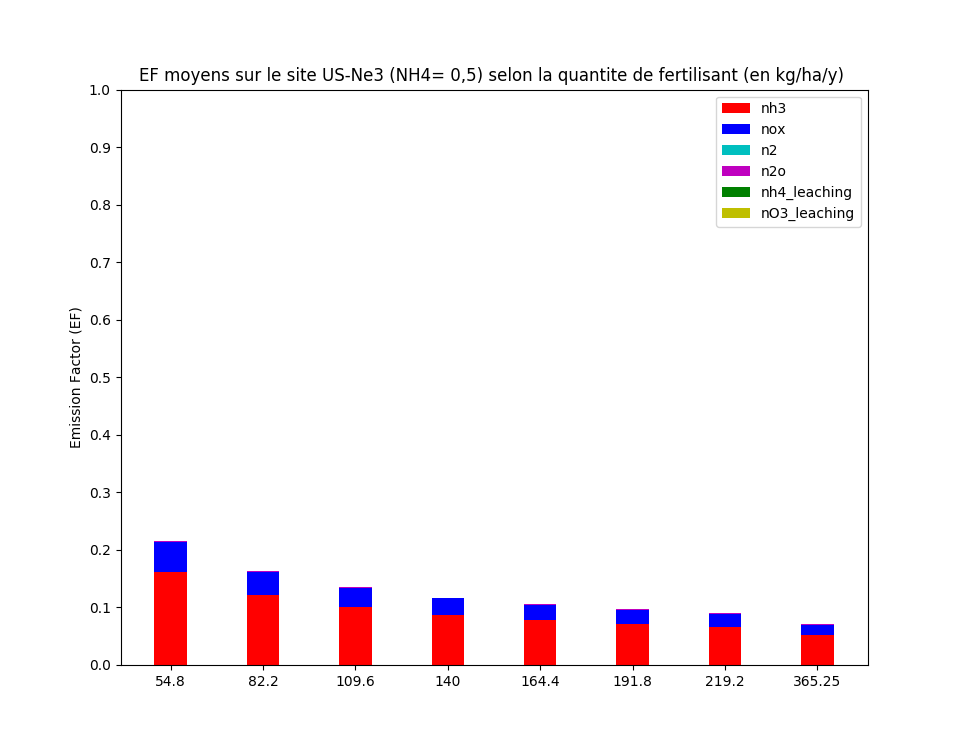
A. EF of each parameters on each site for NH4%=0.5 and 0.8
path : /home/orchidee03/taudoux/documents/Results/B/EF/
Python : barplot.py using files.txt in which values of nitrogen emissions and leaching are listed in order to plot EF in function of fertilizer added. arg1= Name of the site
| DK-Ris
|
|---|
| 0.5 | 0.8
|
|---|
 | 
|
|---|
| FR-Gri
|
|---|
| 0.5 | 0.8
|
|---|
 | 
|
|---|
| NL-Lan
|
|---|
| 0.5 | 0.8
|
|---|
 | 
|
|---|
| NL-Lut
|
|---|
| 0.5 | 0.8
|
|---|
 | 
|
|---|
| US-Bo1
|
|---|
| 0.5 | 0.8
|
|---|
 | 
|
|---|
| US-Ne1
|
|---|
| 0.5 | 0.8
|
|---|
 | 
|
|---|
| US-Ne2
|
|---|
| 0.5 | 0.8
|
|---|
 | 
|
|---|
| US-Ne3
|
|---|
| 0.5 | 0.8
|
|---|
 | 
|
|---|
B. EF of each parameters on each site for NH4%=0.5 and 0.8 (method b)
path : /home/orchidee03/taudoux/documents/Results/B/EFb/
| DK-Ris
|
|---|
| 0.5 | 0.8
|
|---|
 | 
|
|---|
| FR-Gri
|
|---|
| 0.5 | 0.8
|
|---|
 | 
|
|---|
| NL-Lan
|
|---|
| 0.5 | 0.8
|
|---|
 | 
|
|---|
| NL-Lut
|
|---|
| 0.5 | 0.8
|
|---|
 | 
|
|---|
| US-Bo1
|
|---|
| 0.5 | 0.8
|
|---|
 | 
|
|---|
| US-Ne1
|
|---|
| 0.5 | 0.8
|
|---|
 | 
|
|---|
| US-Ne2
|
|---|
| 0.5 | 0.8
|
|---|
 | 
|
|---|
| US-Ne3
|
|---|
| 0.5 | 0.8
|
|---|
 | 
|
|---|
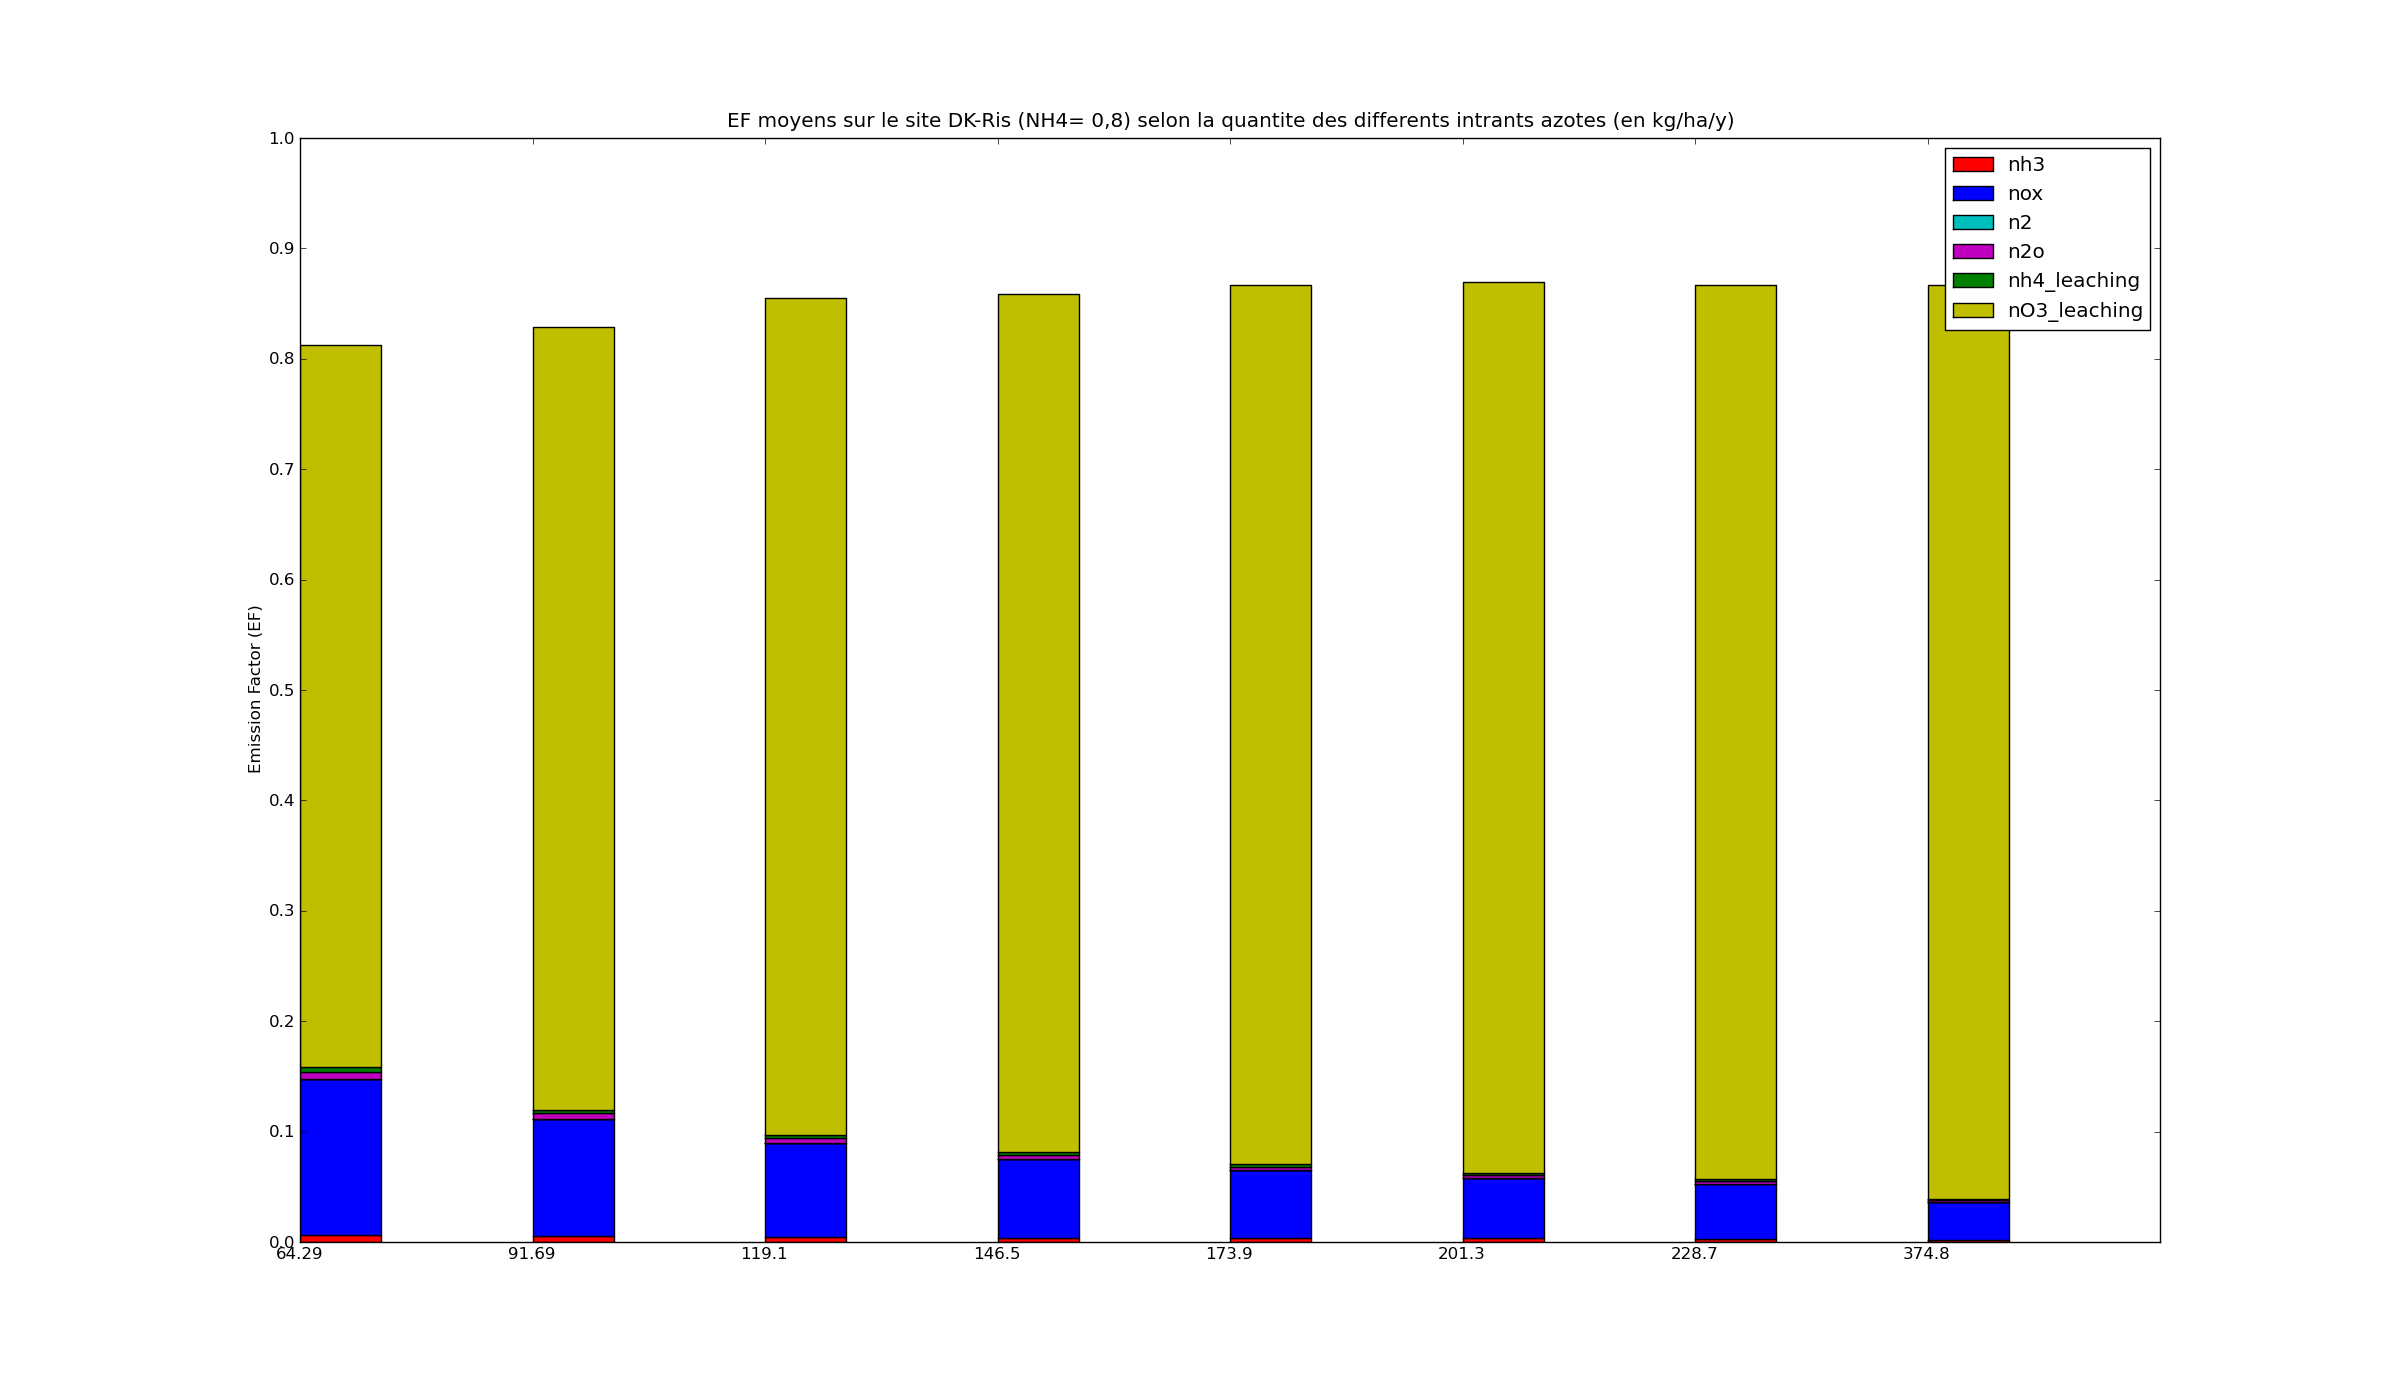
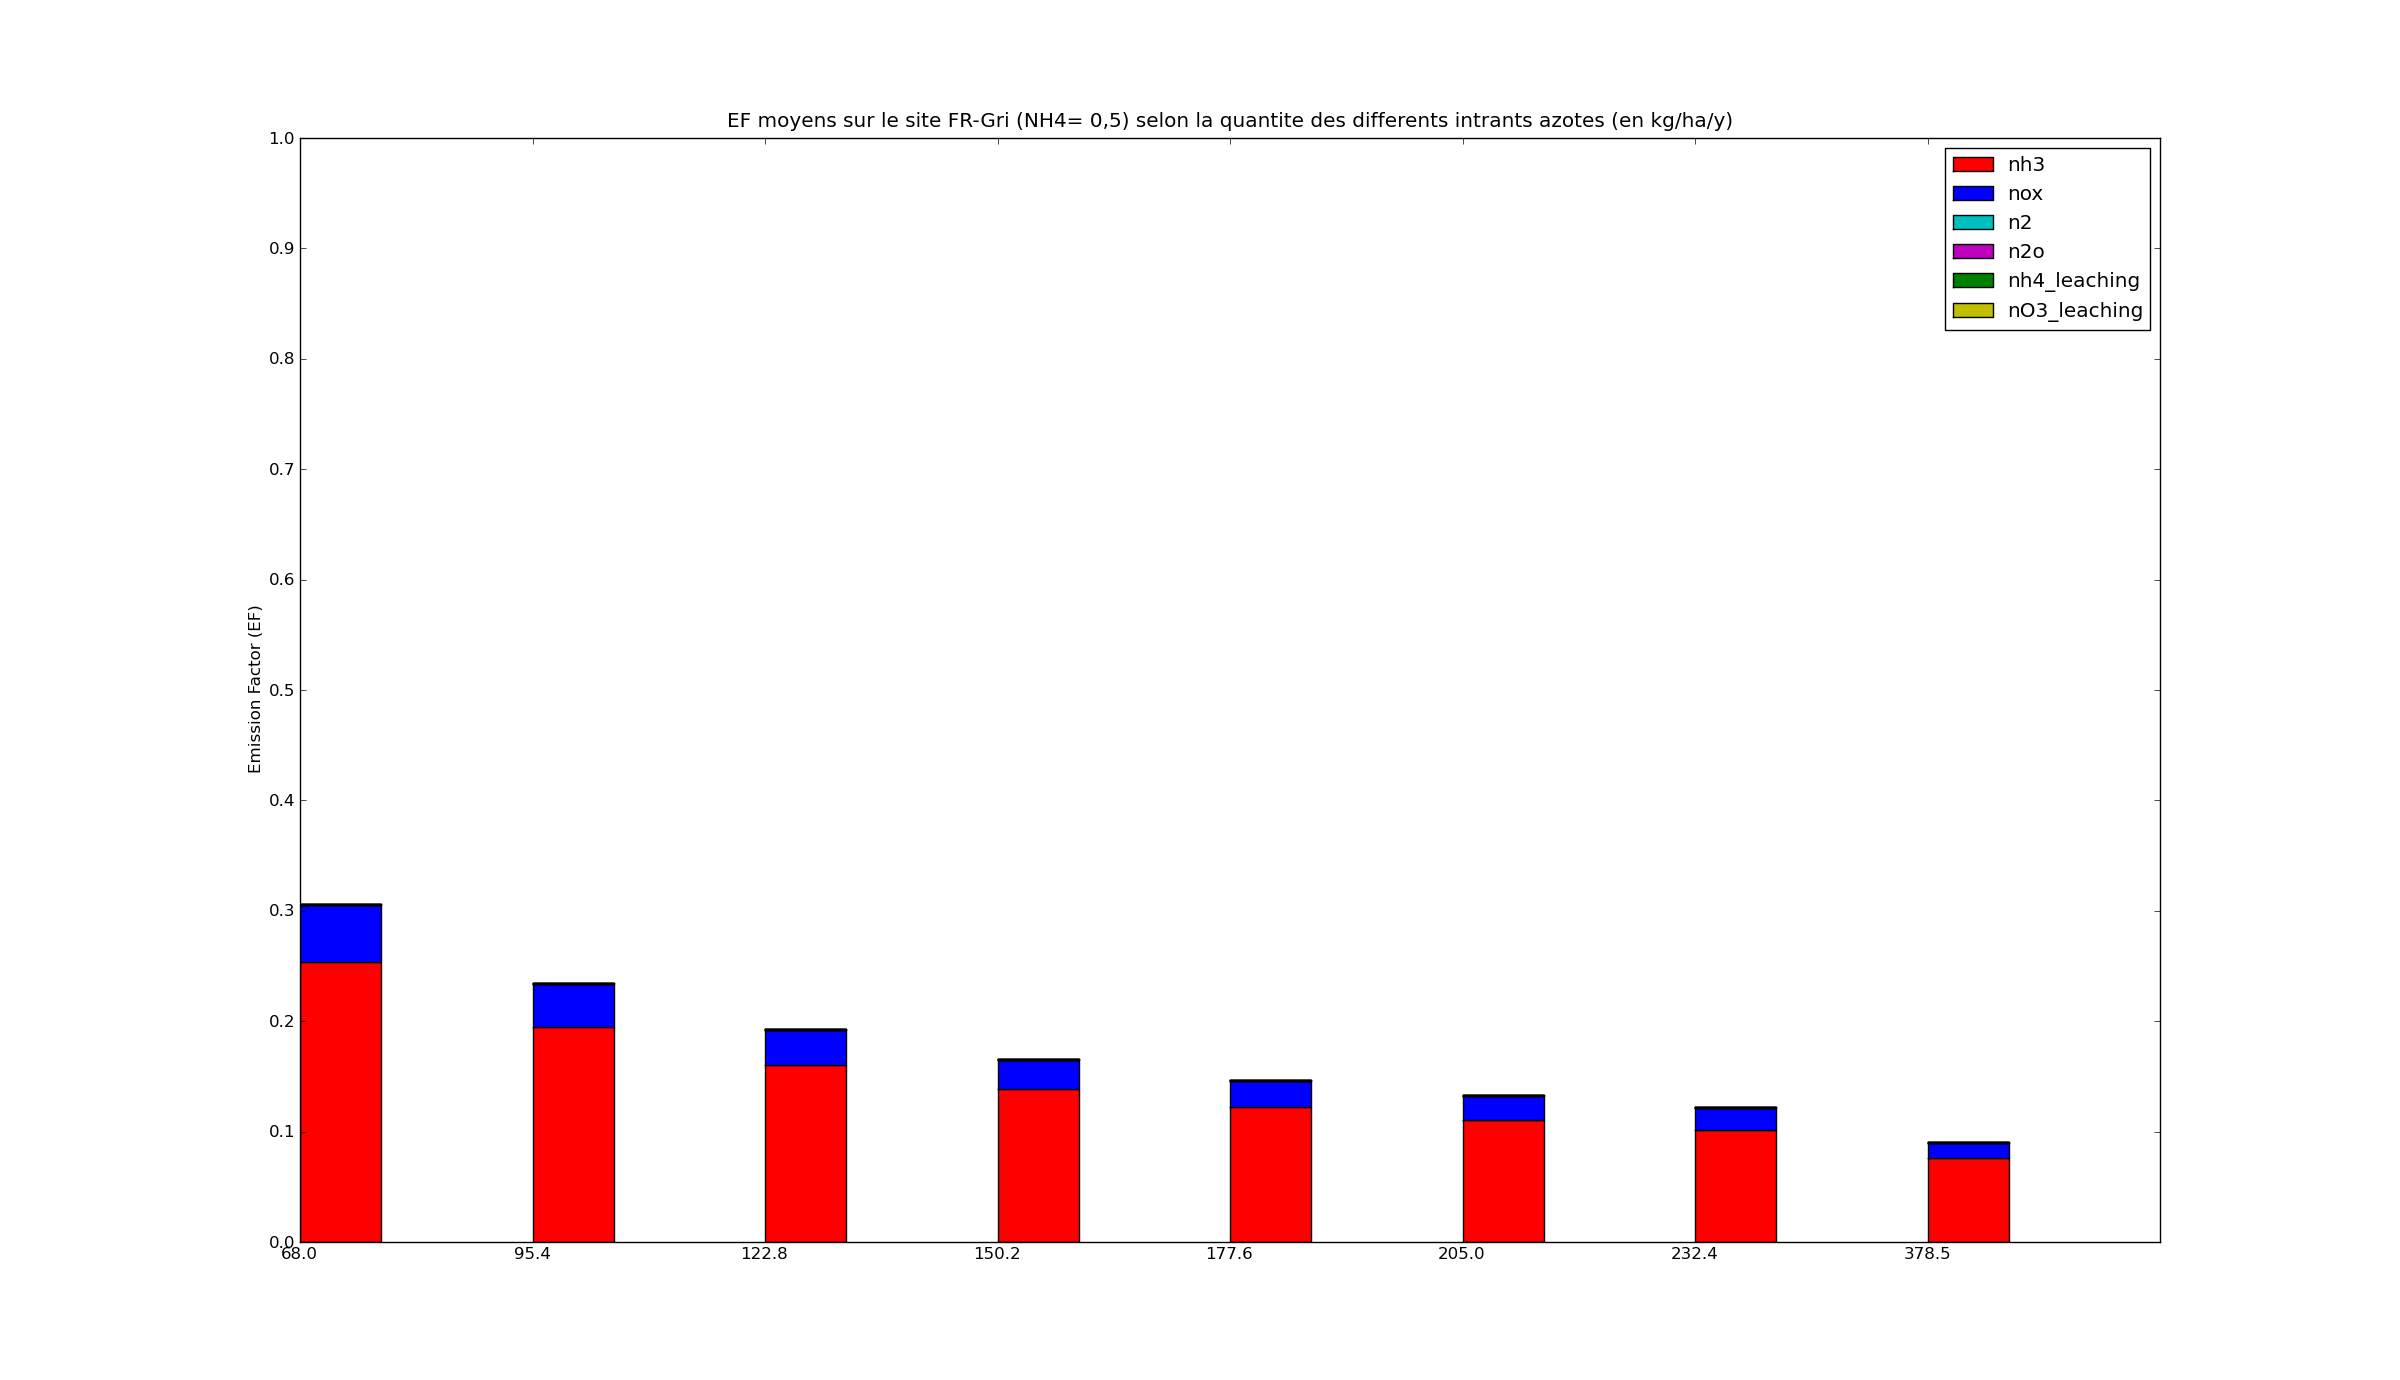
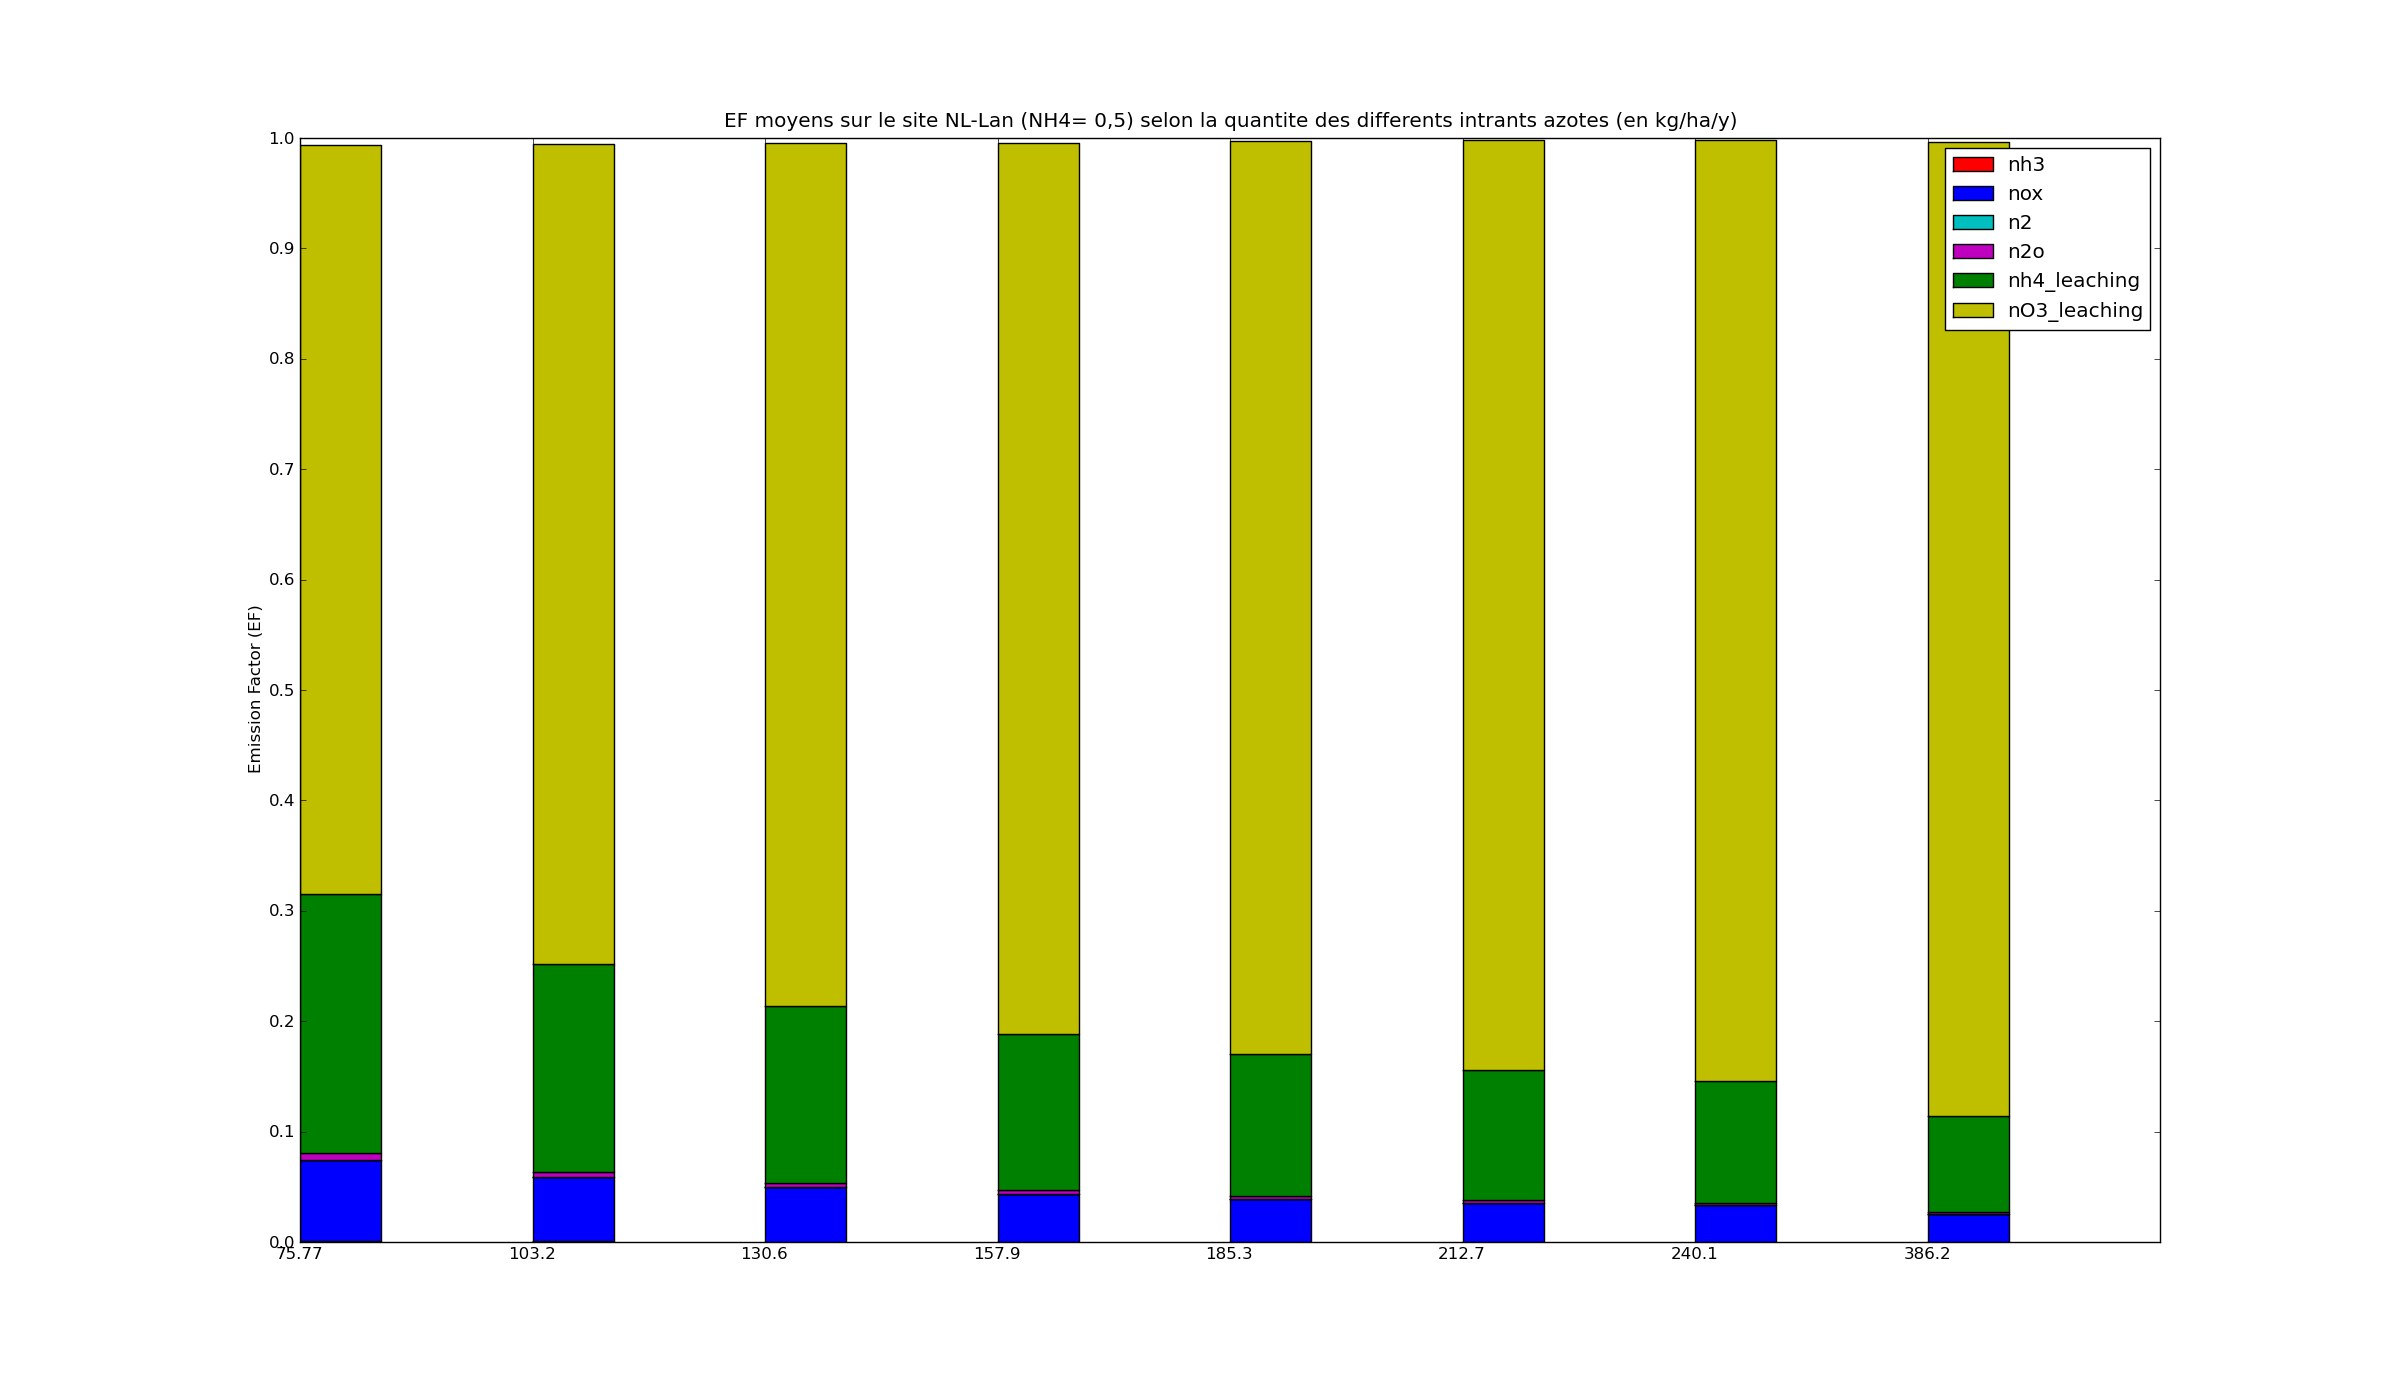
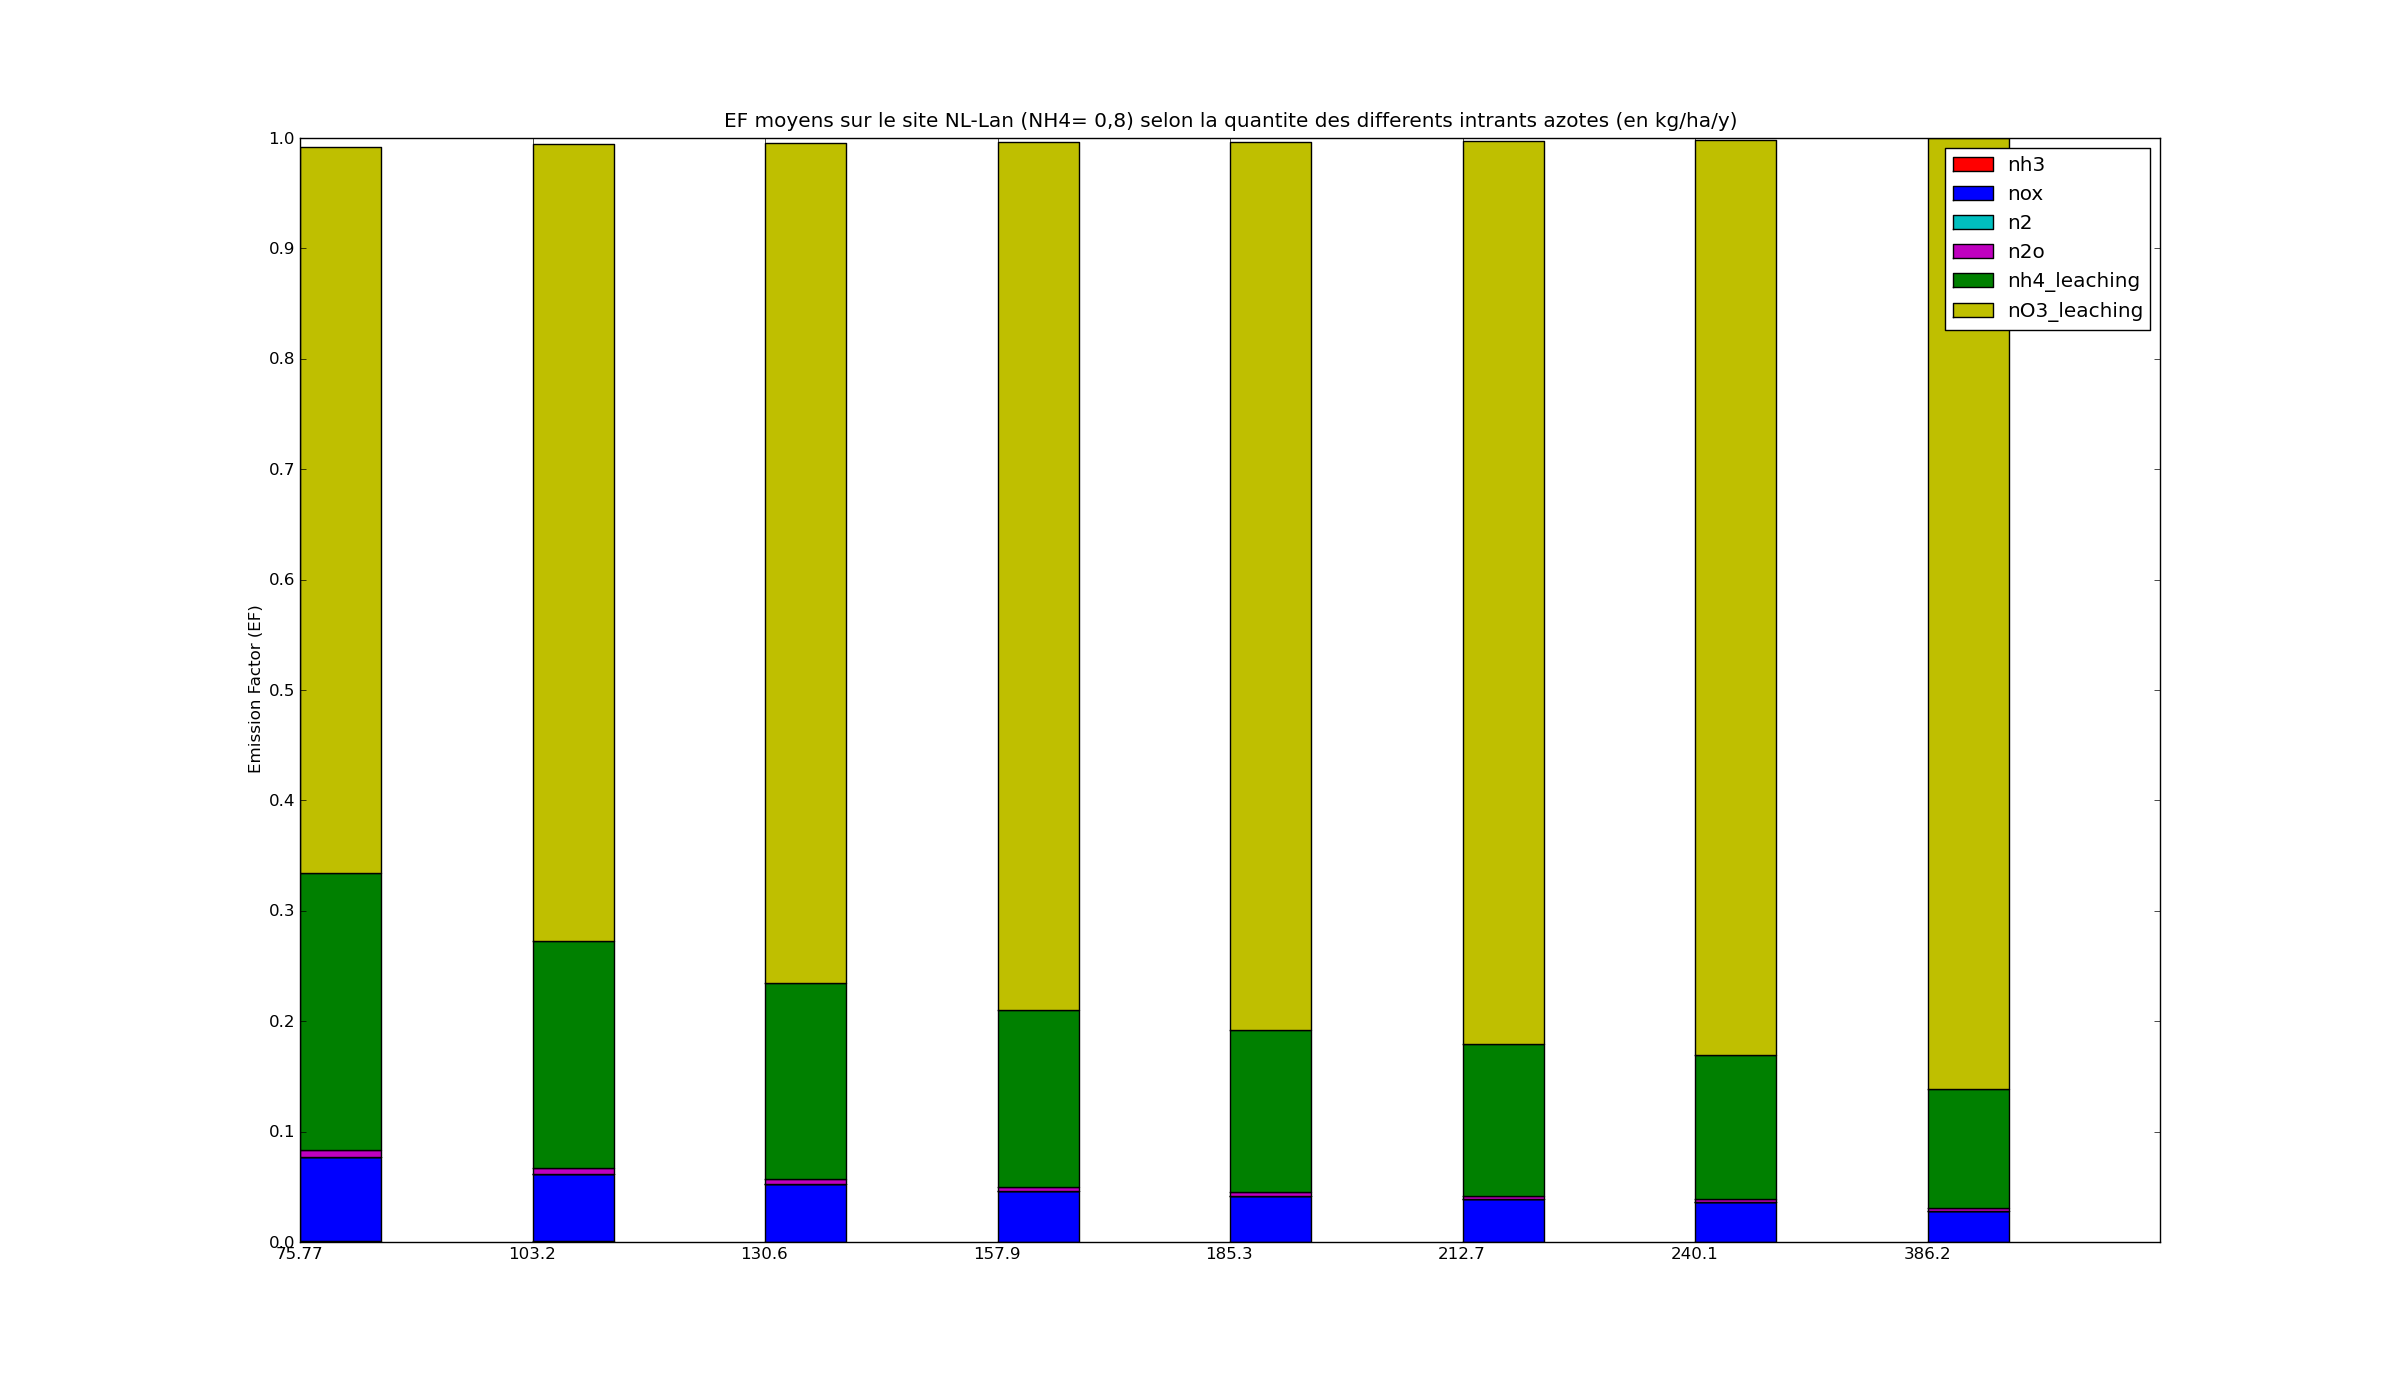
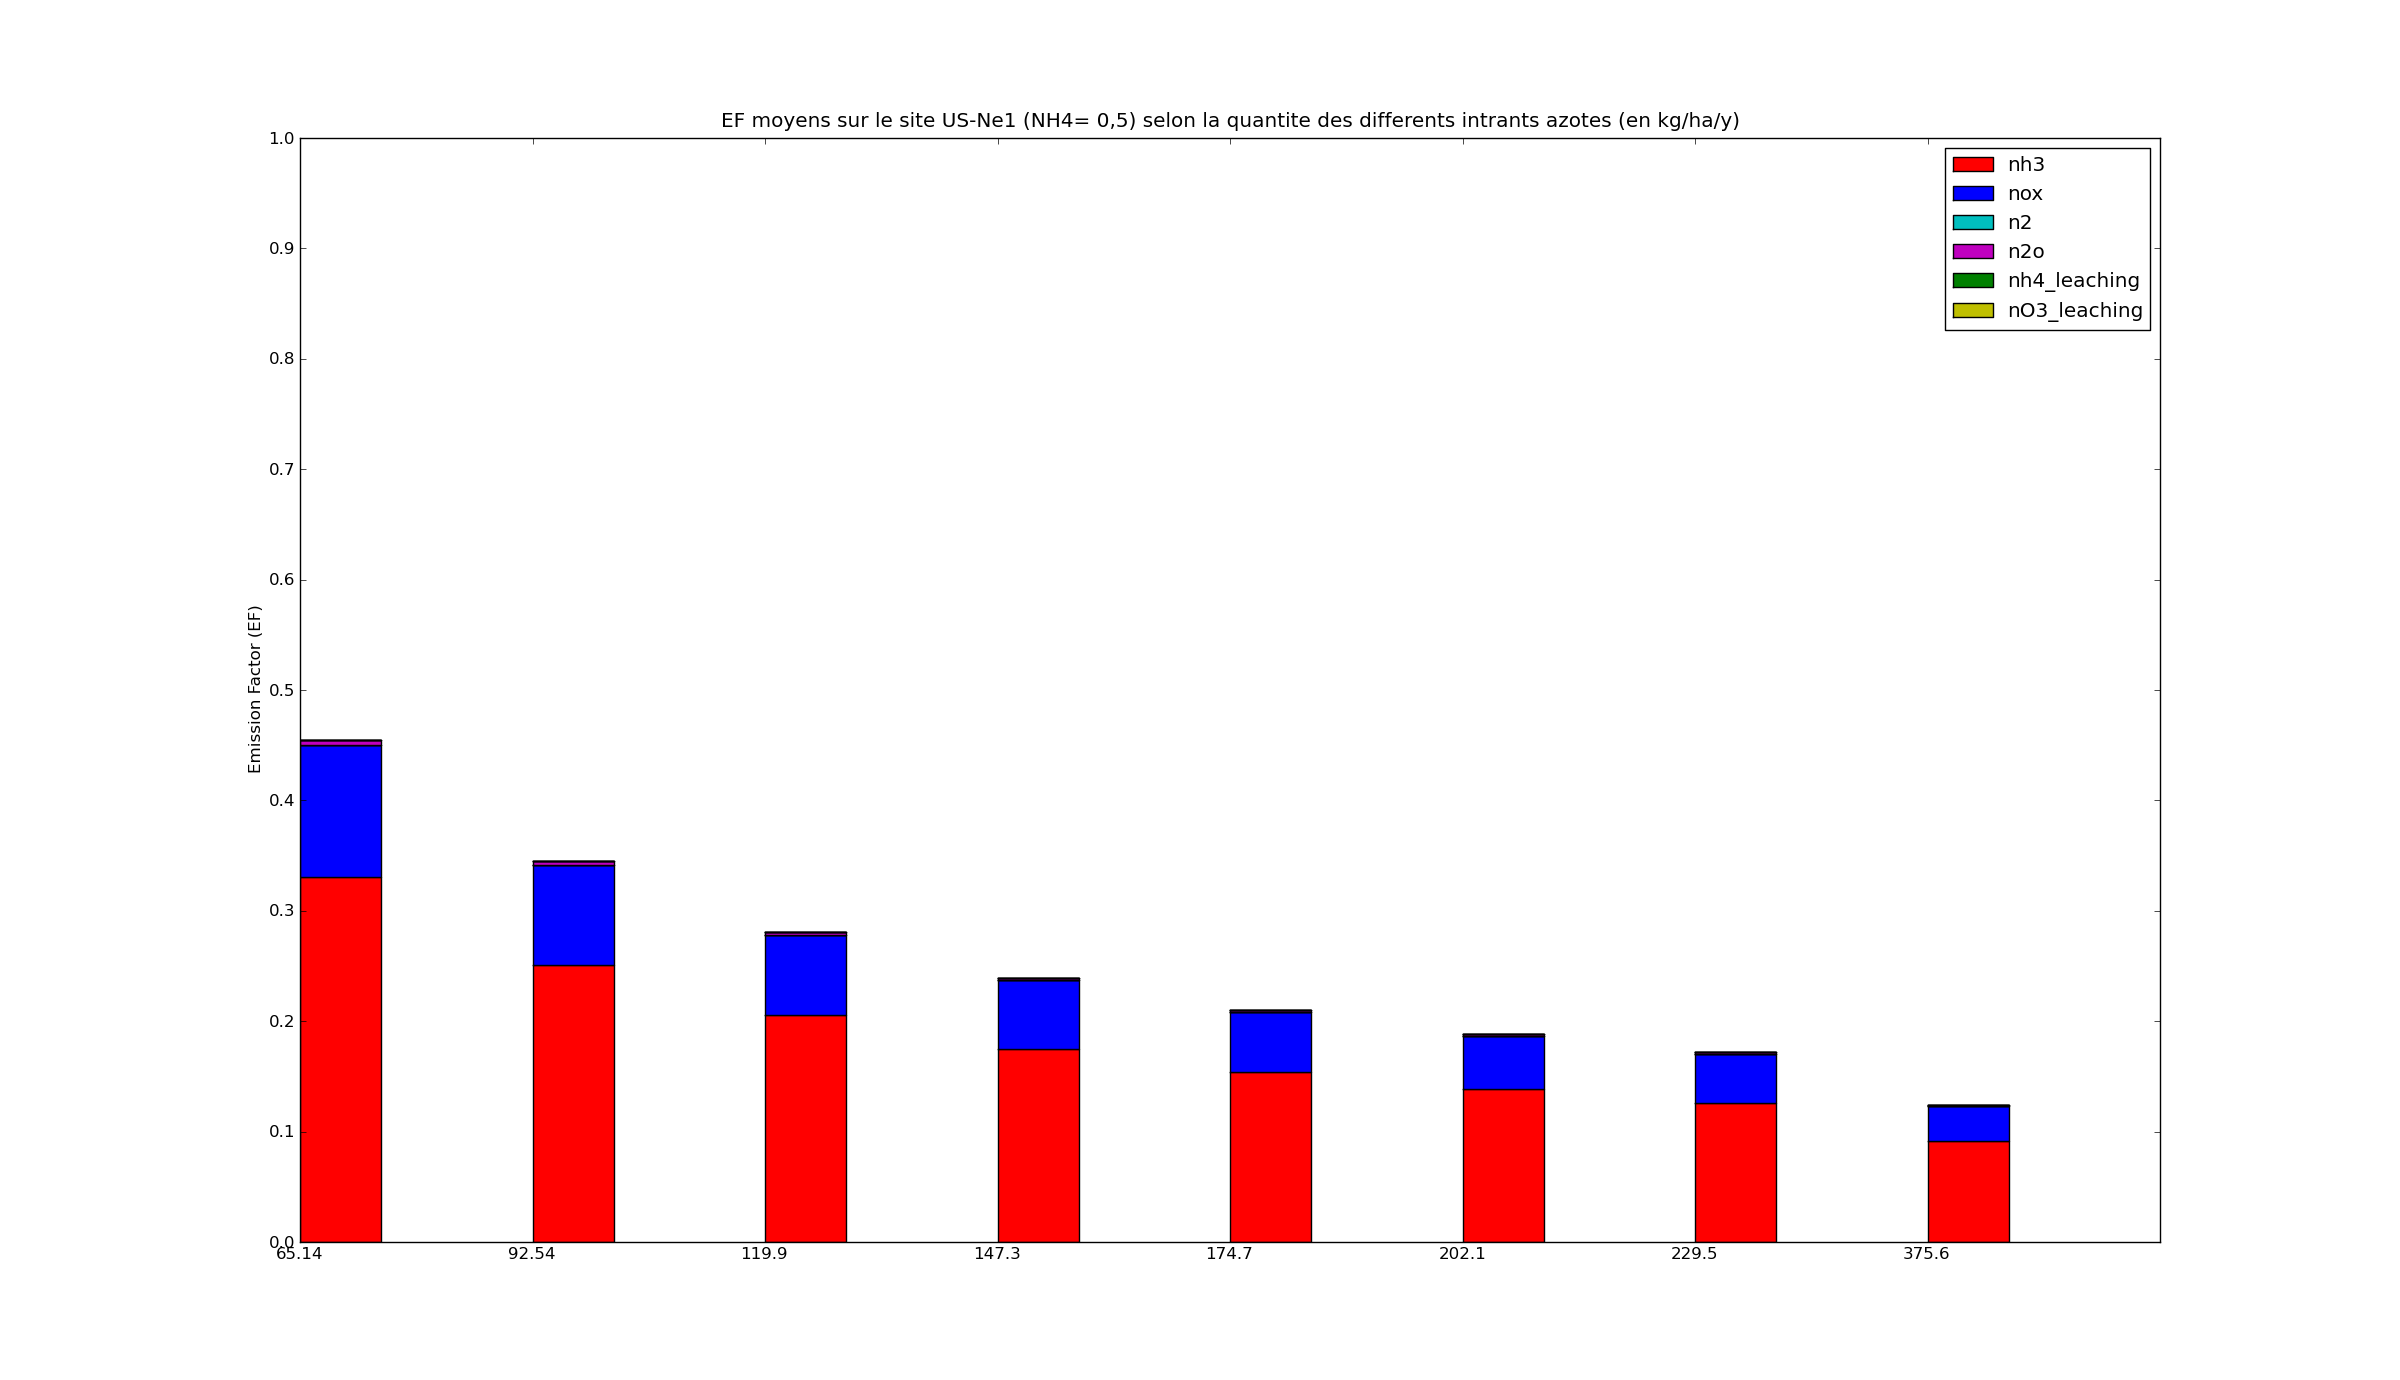
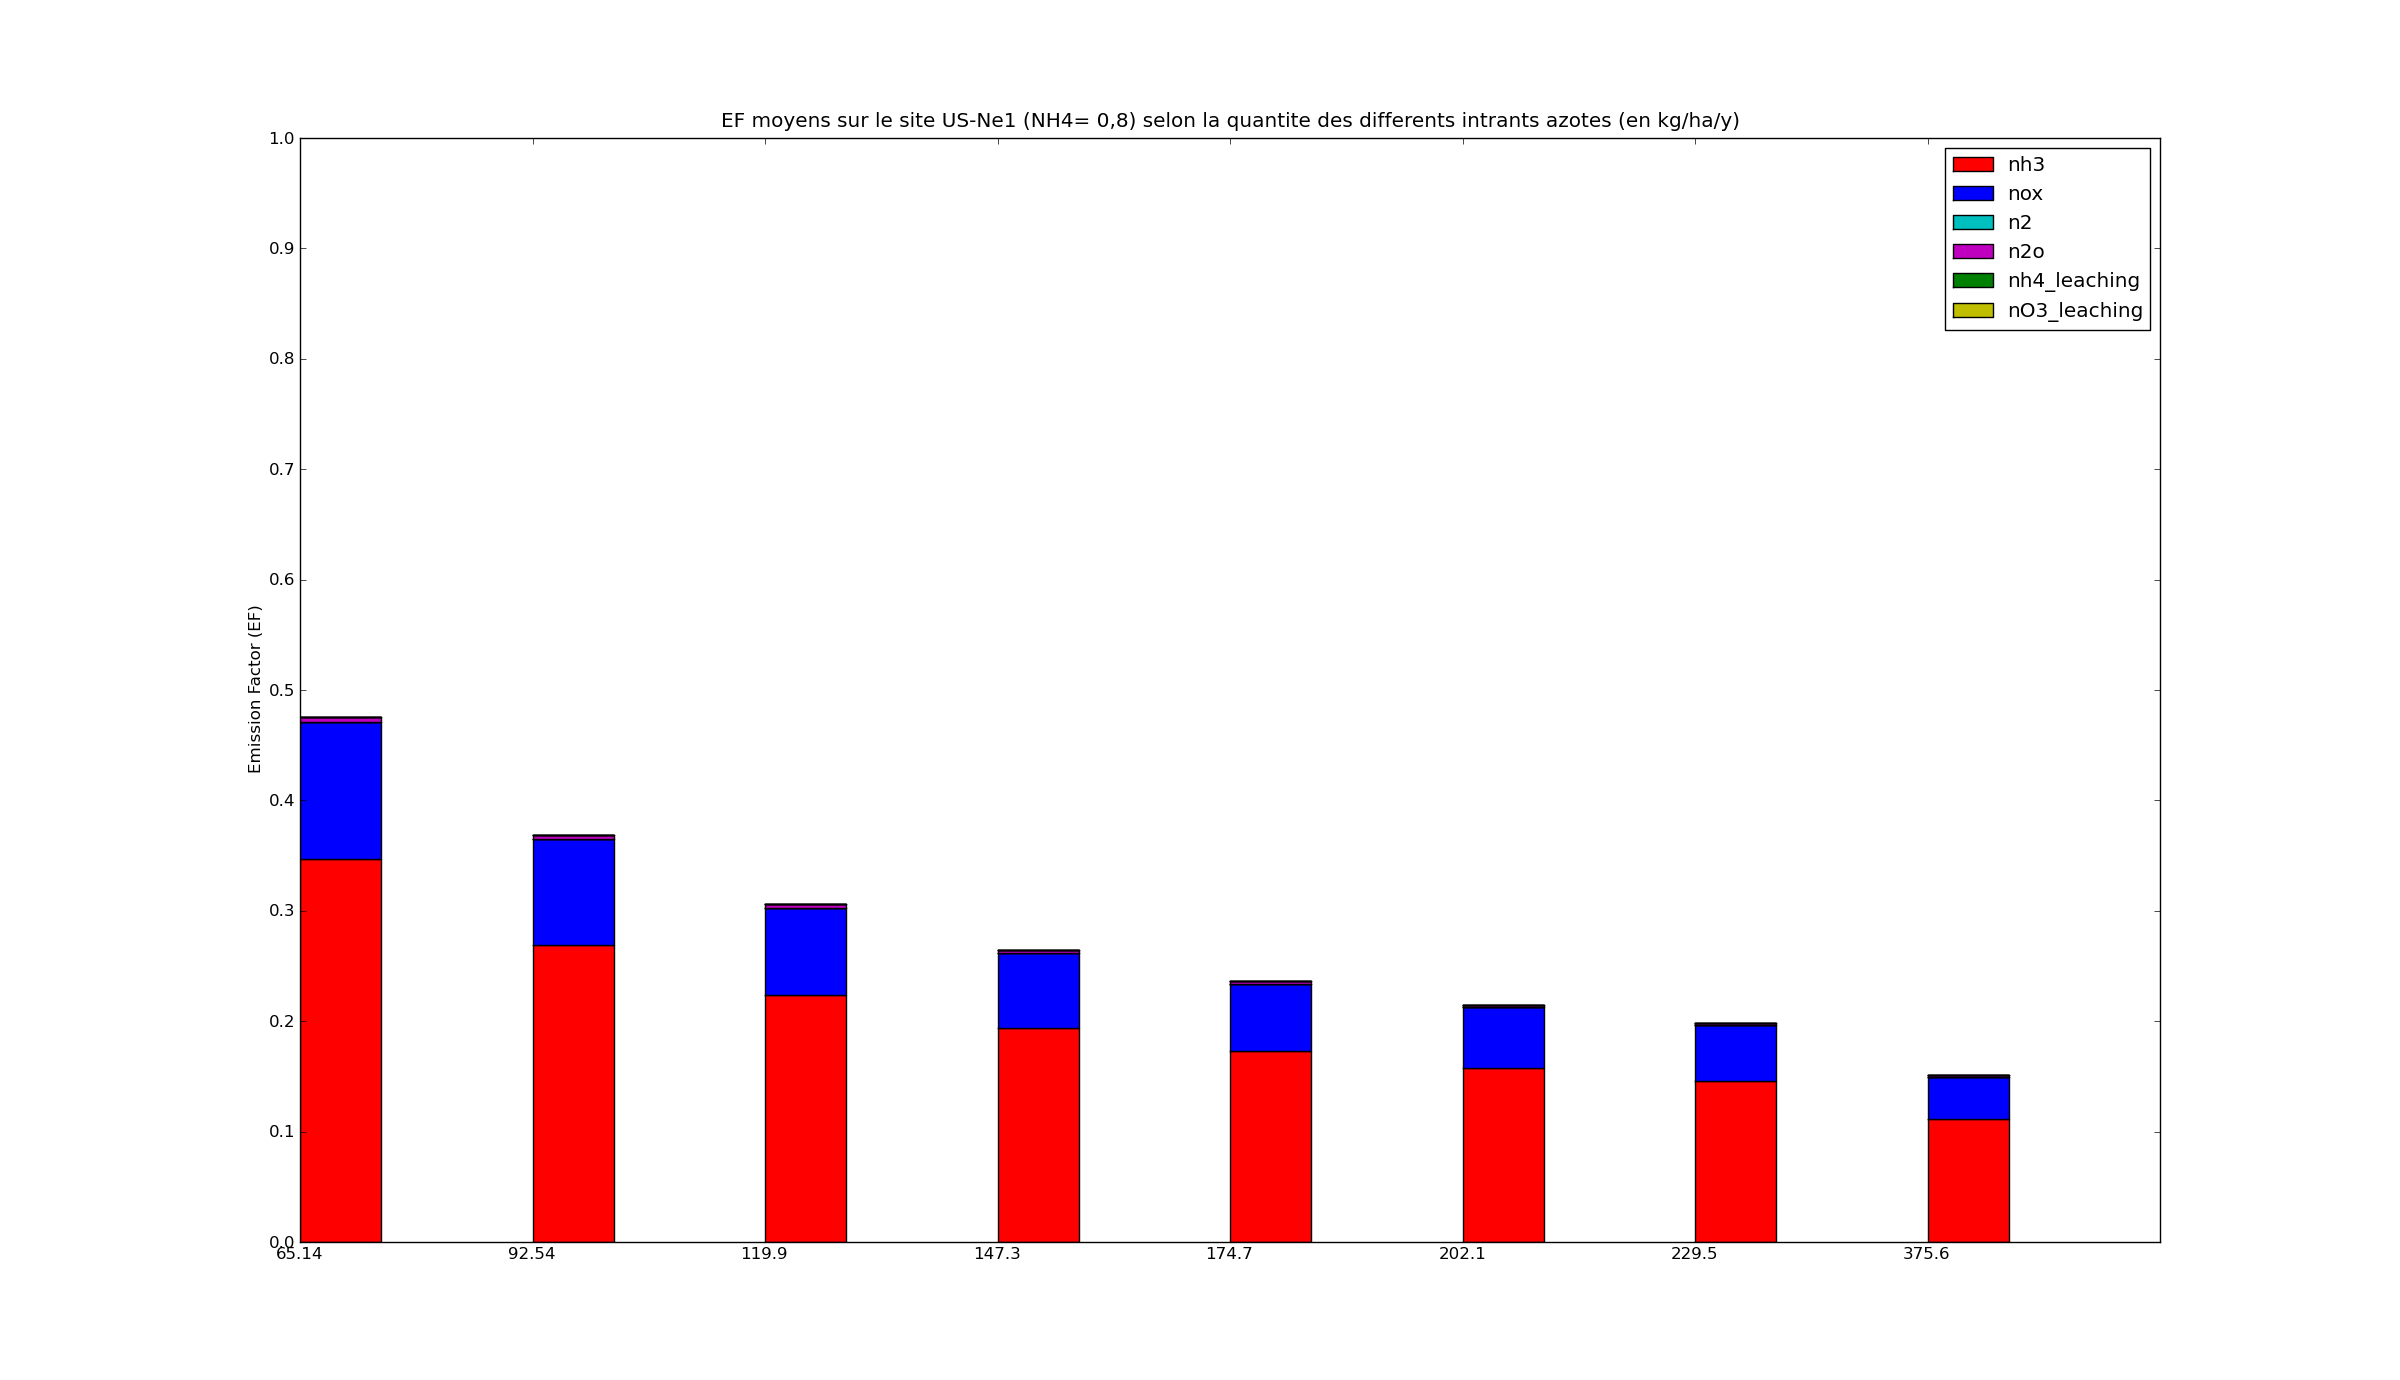
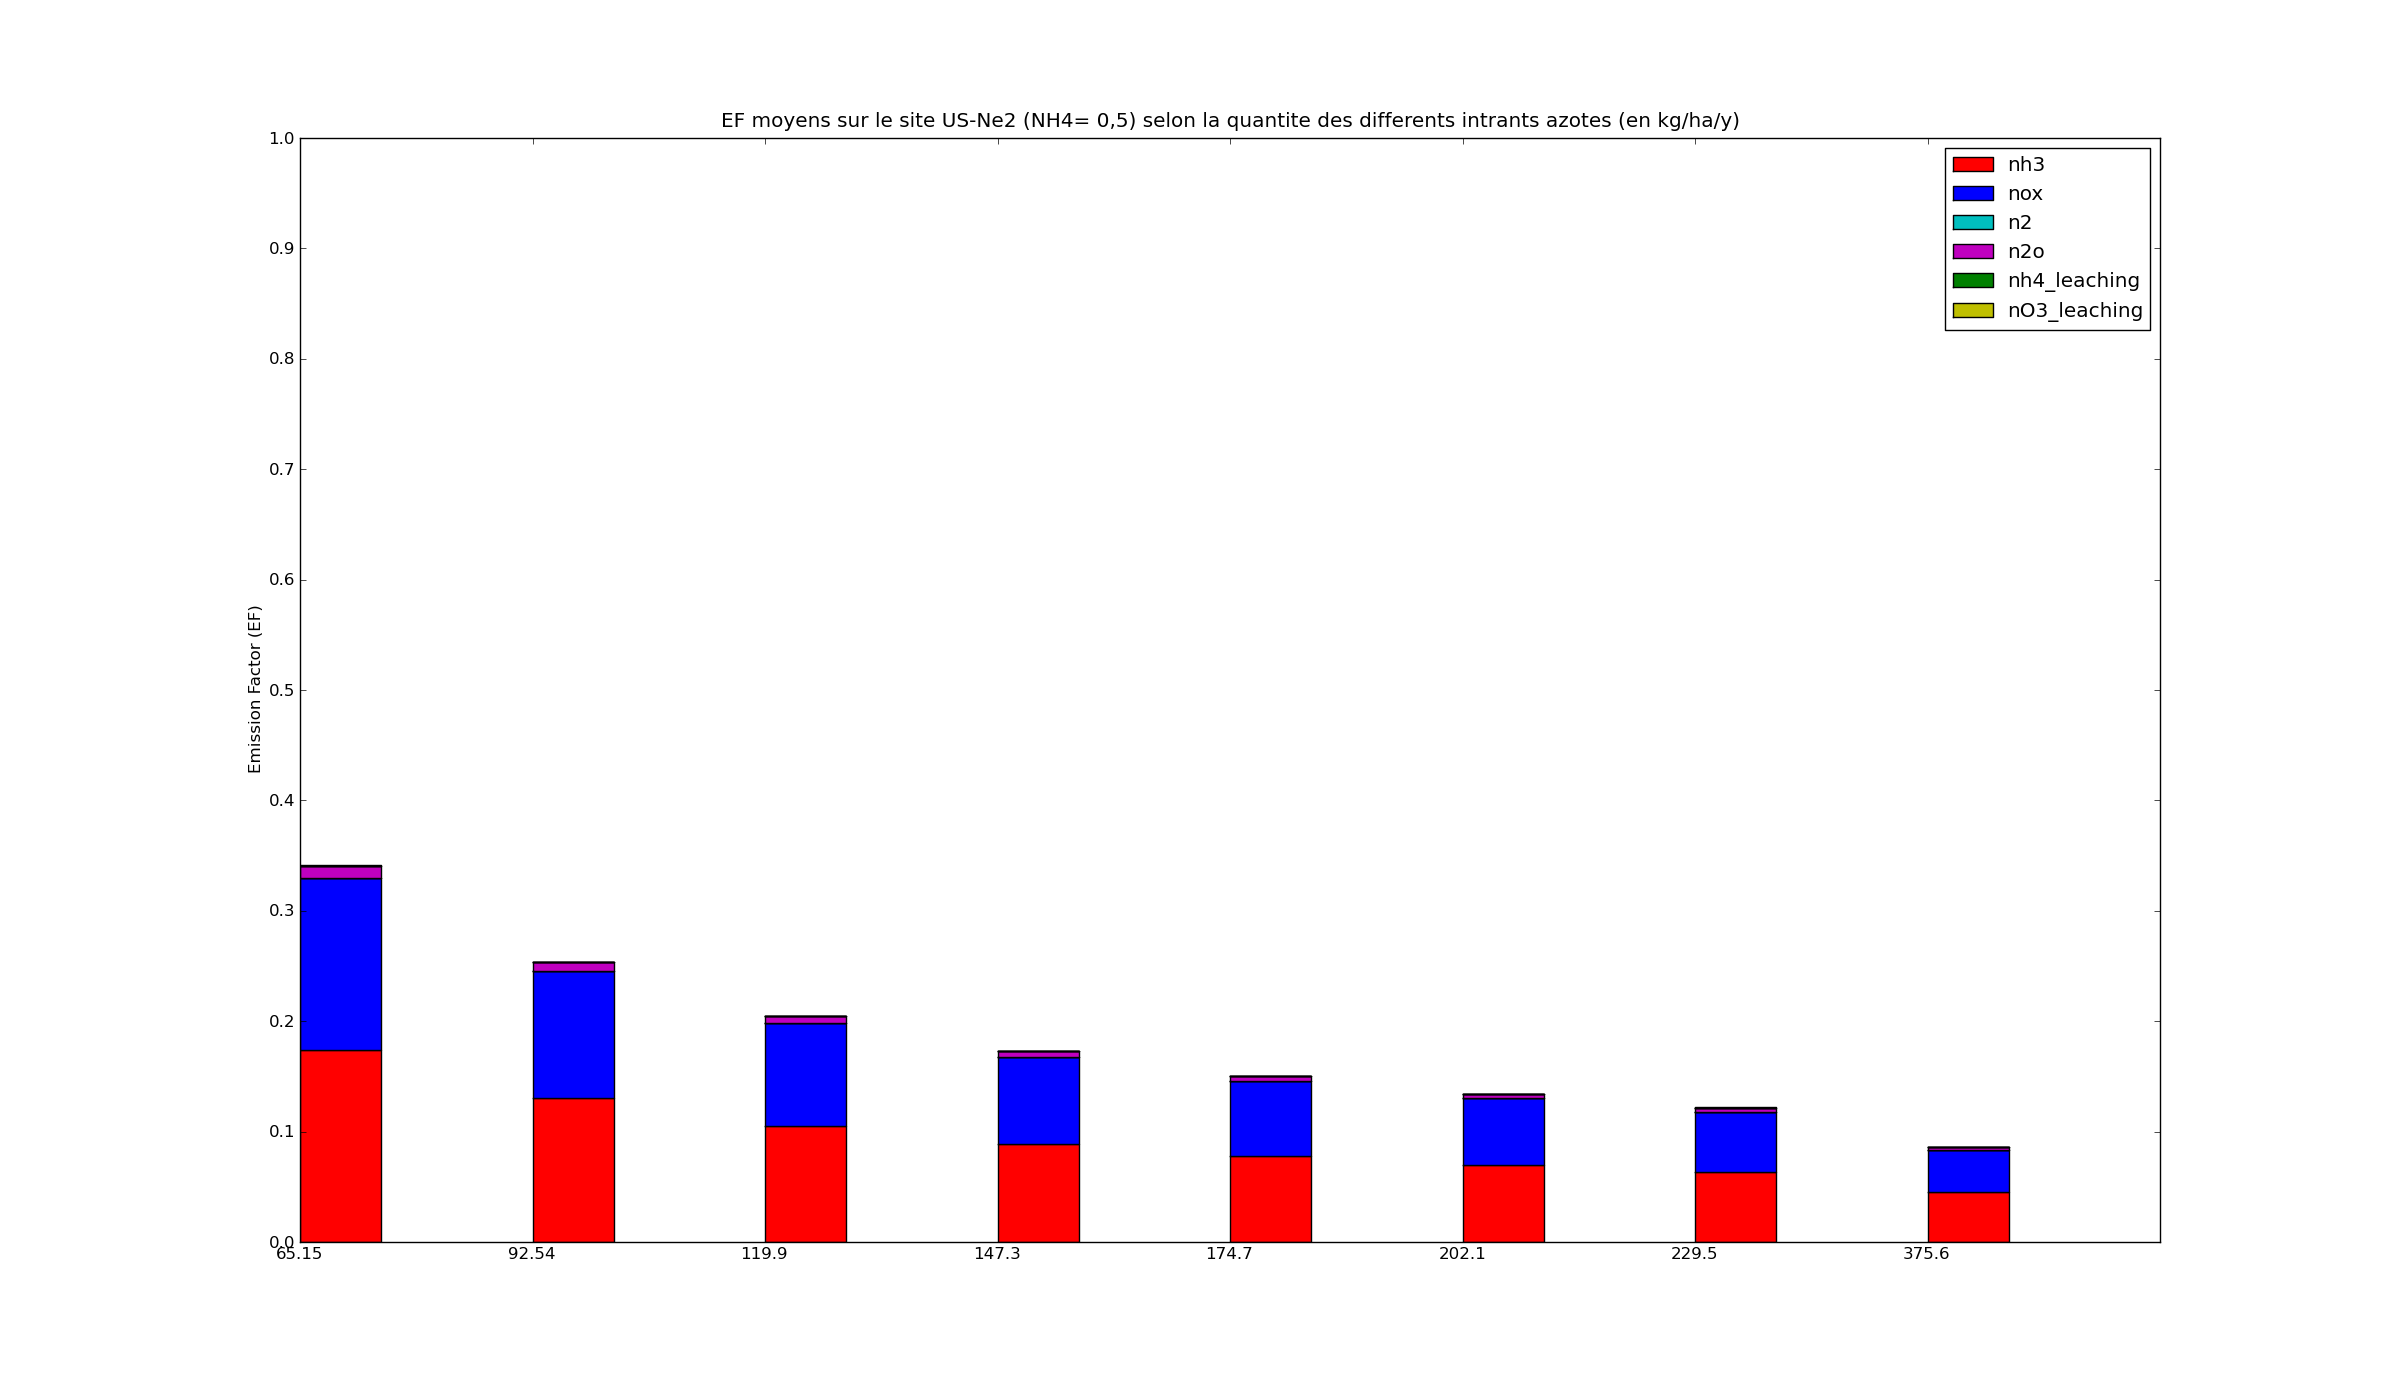
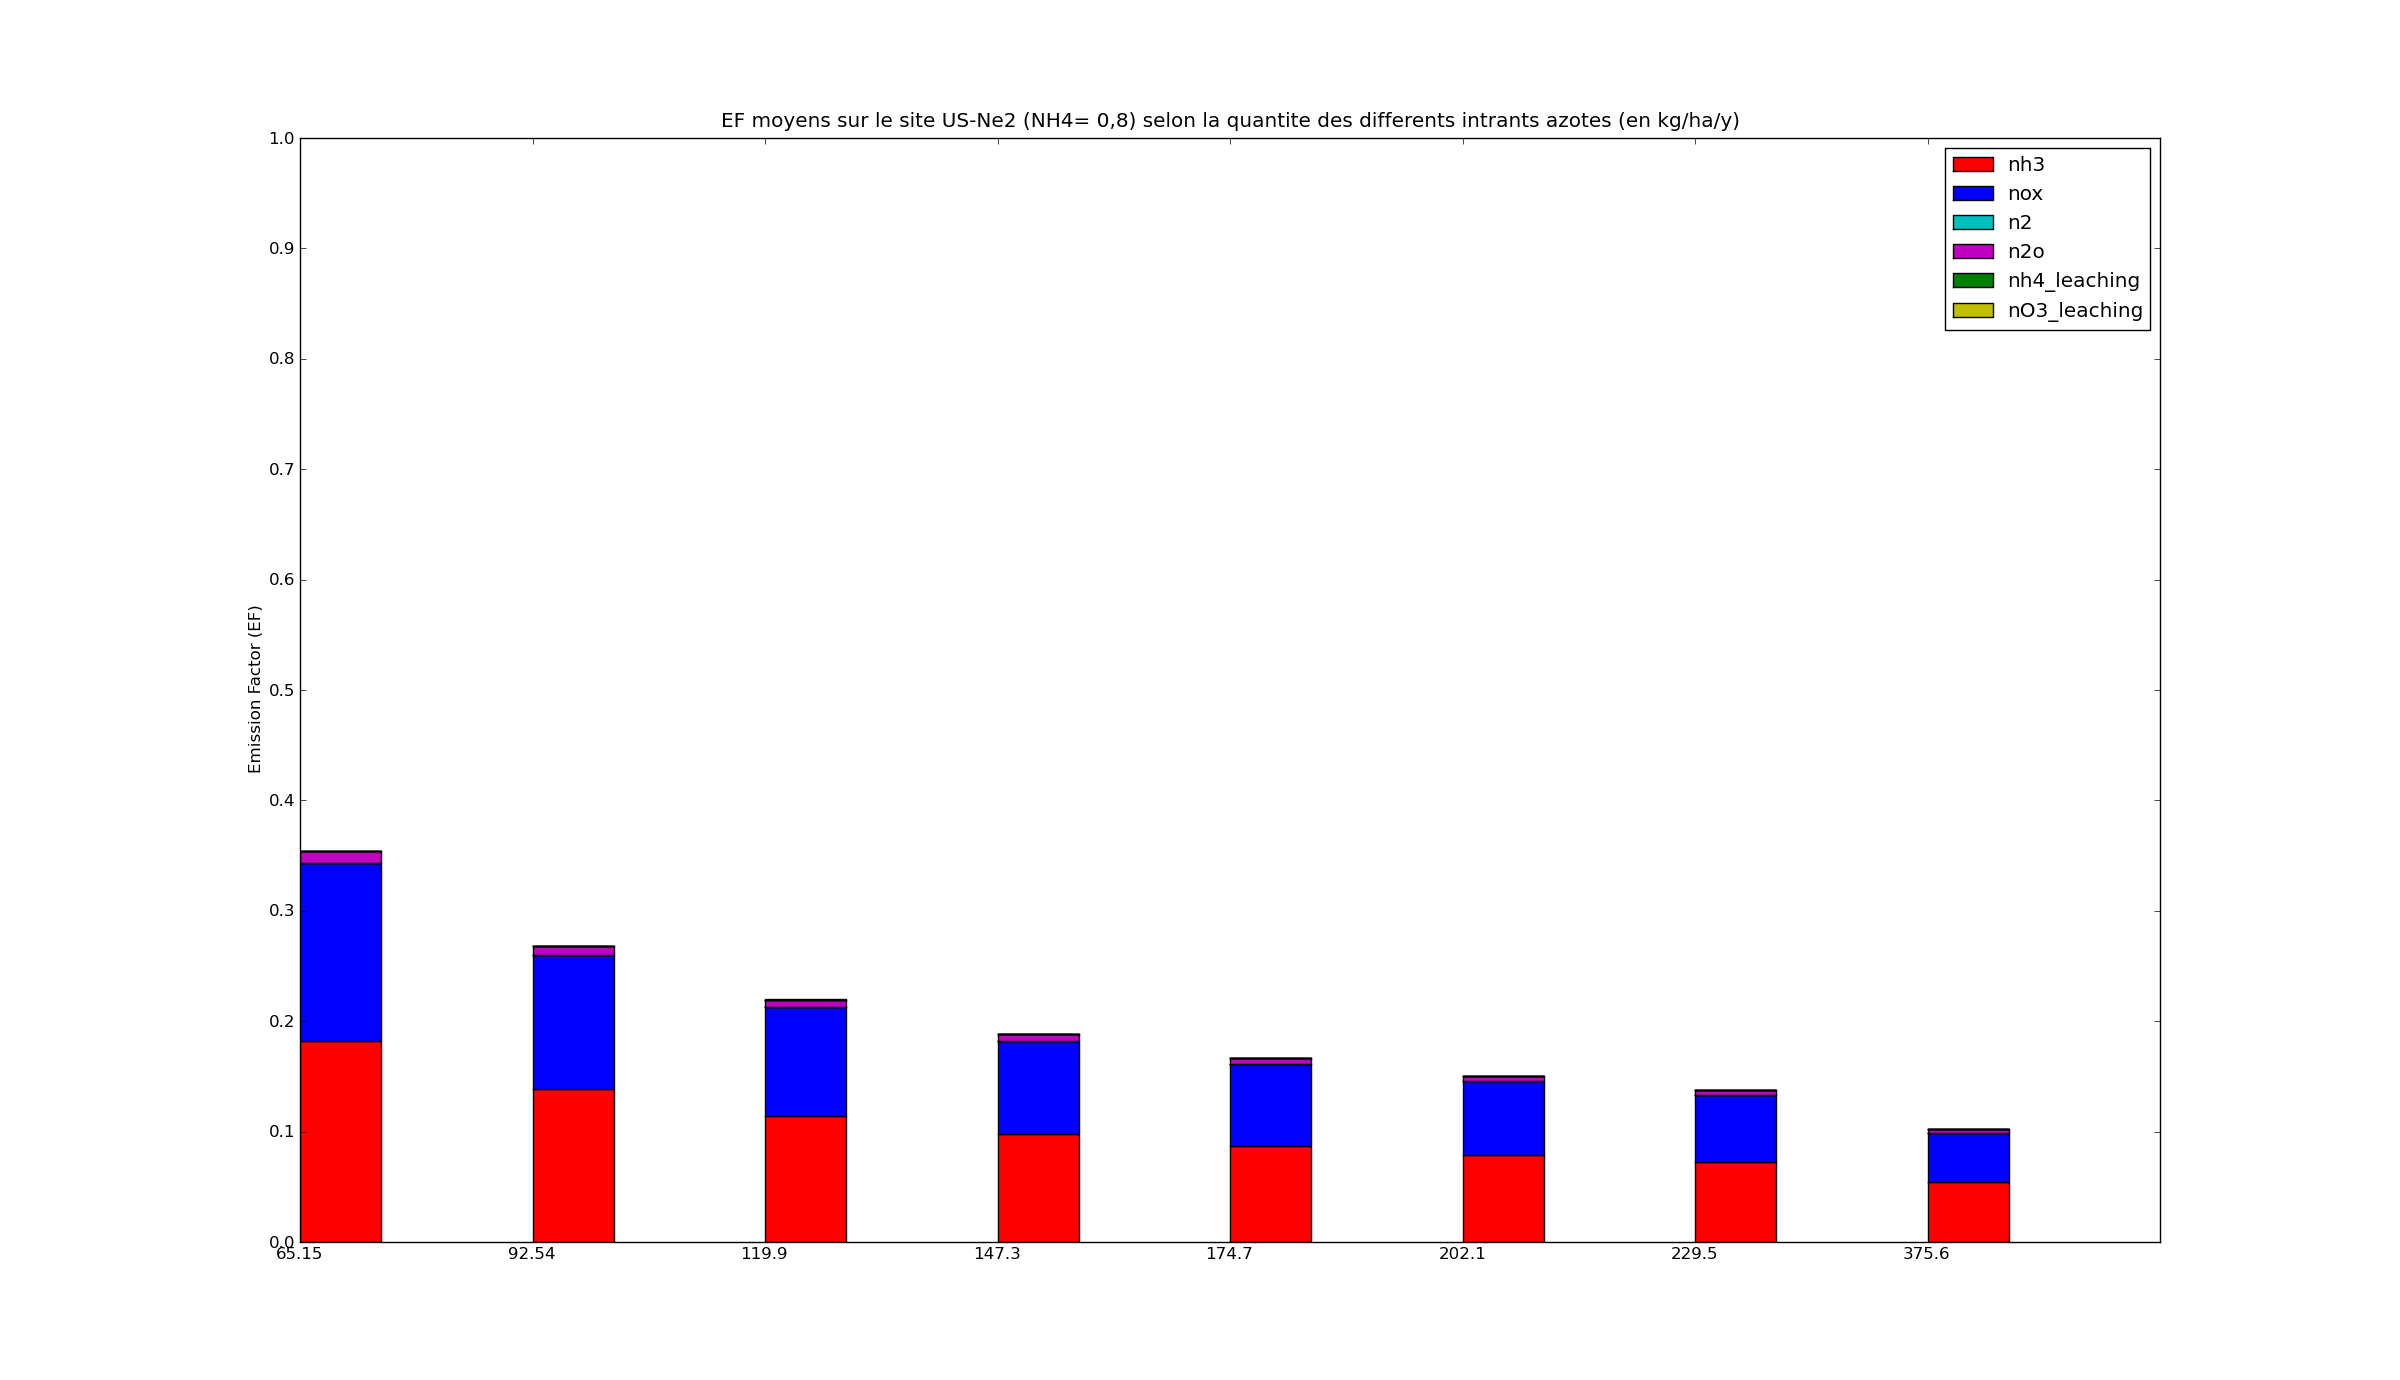
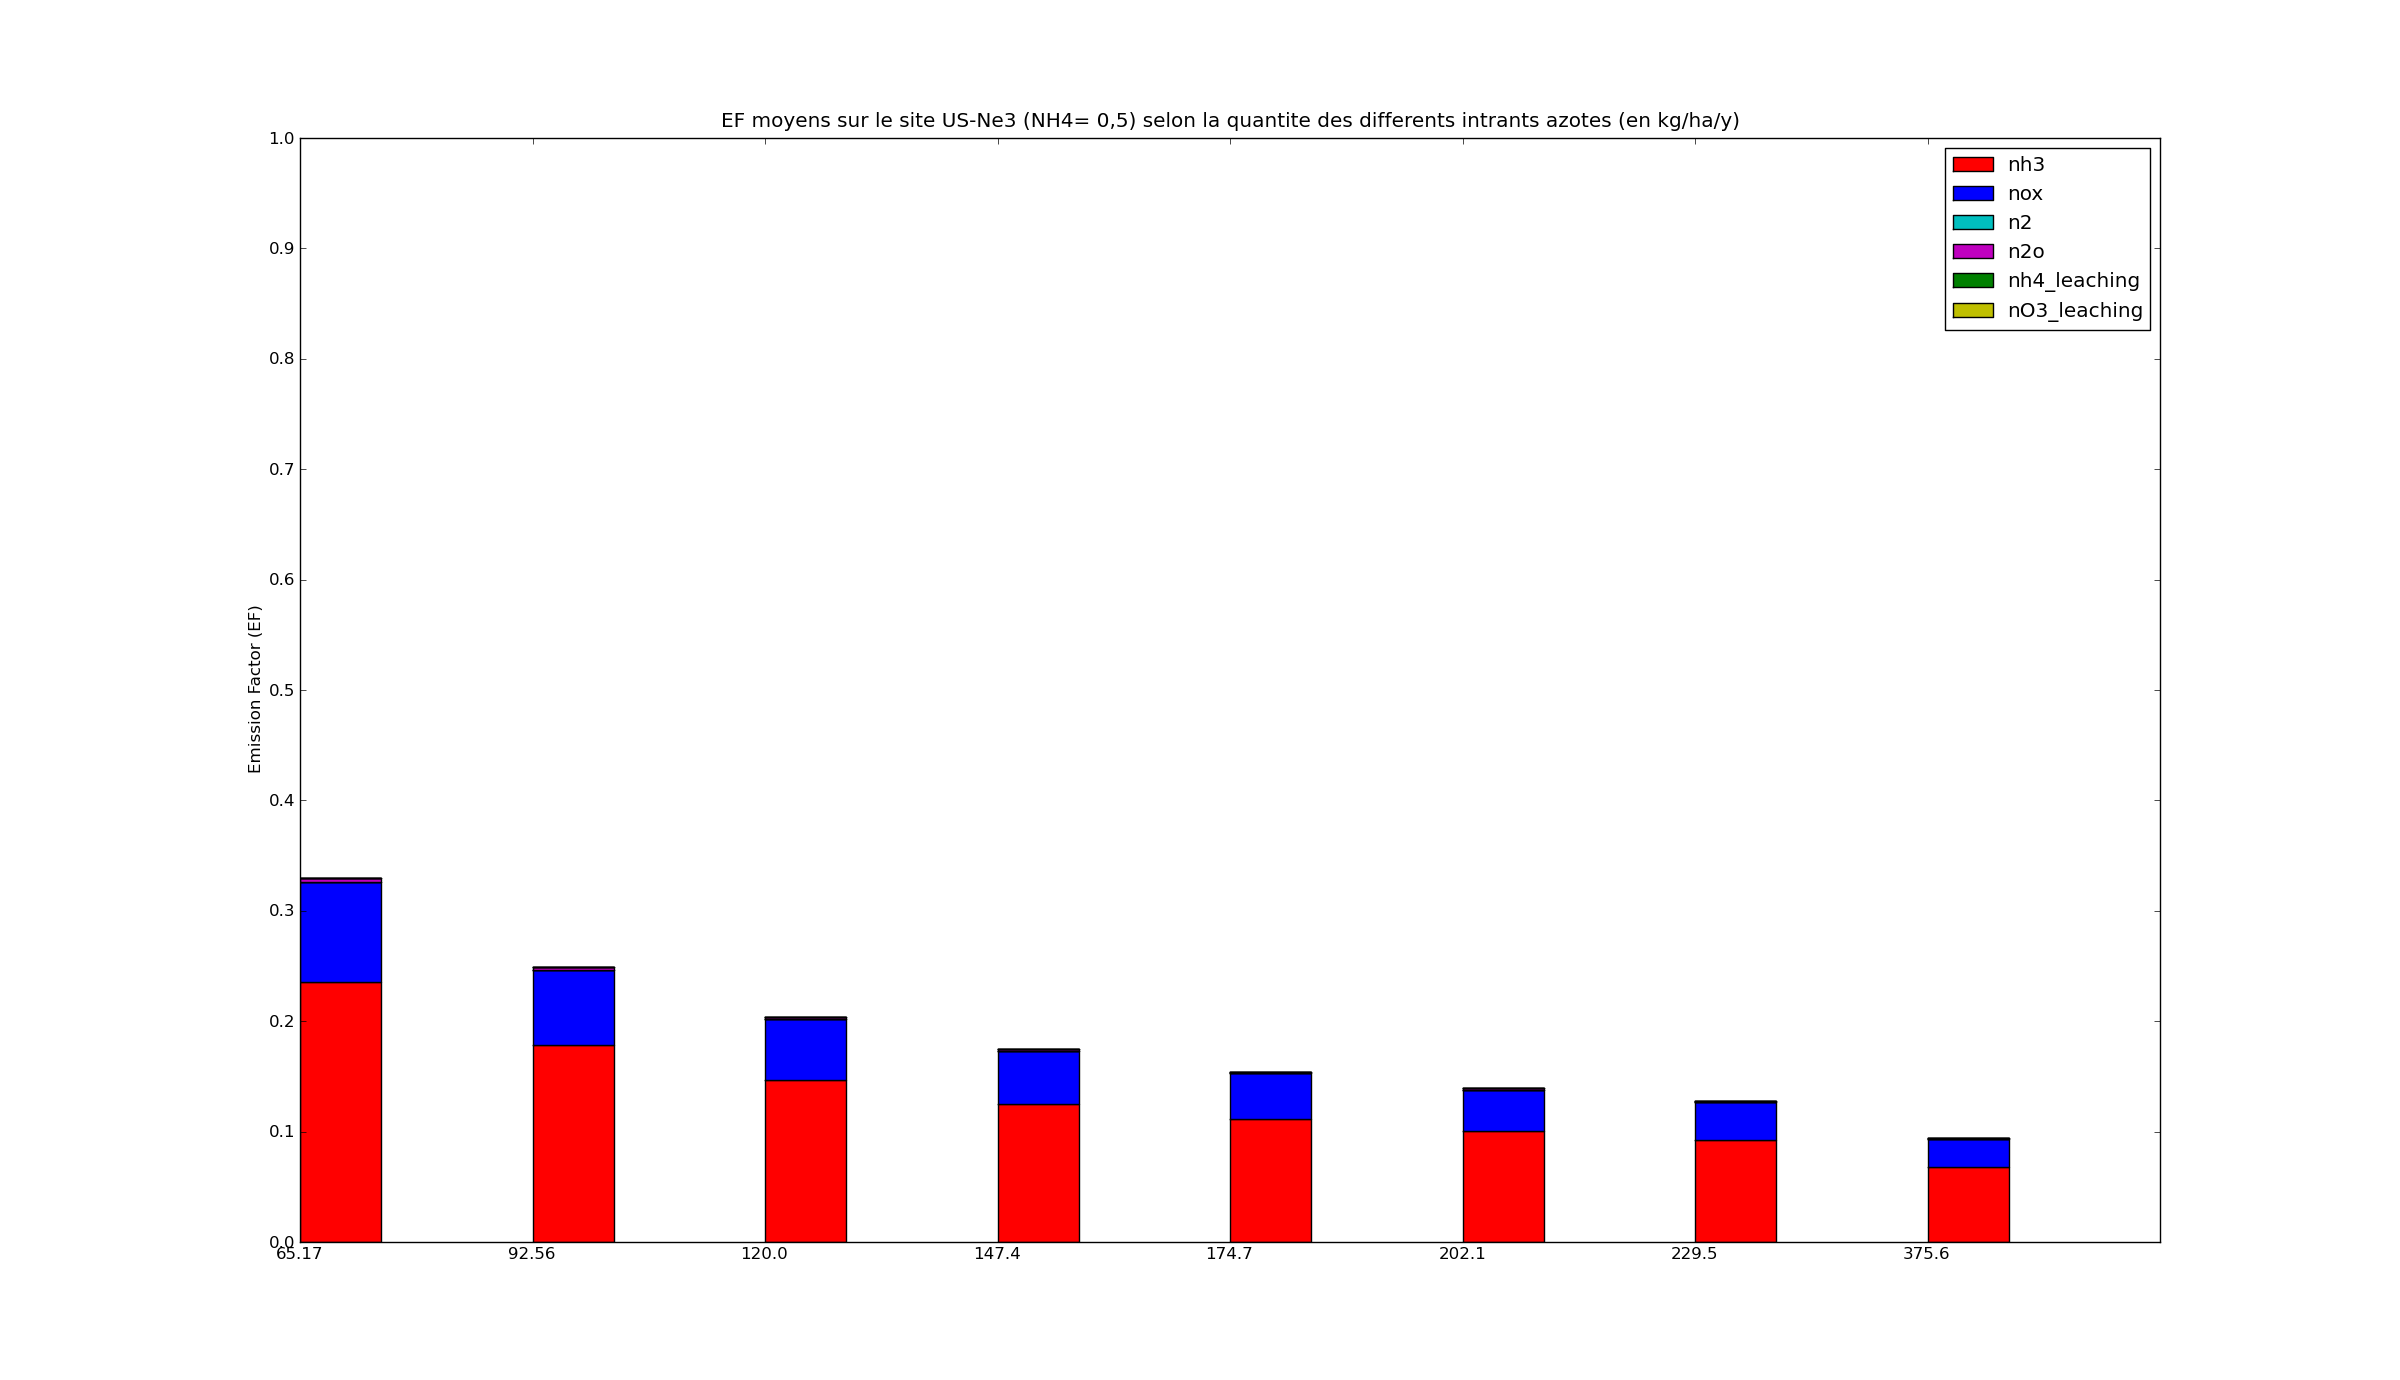
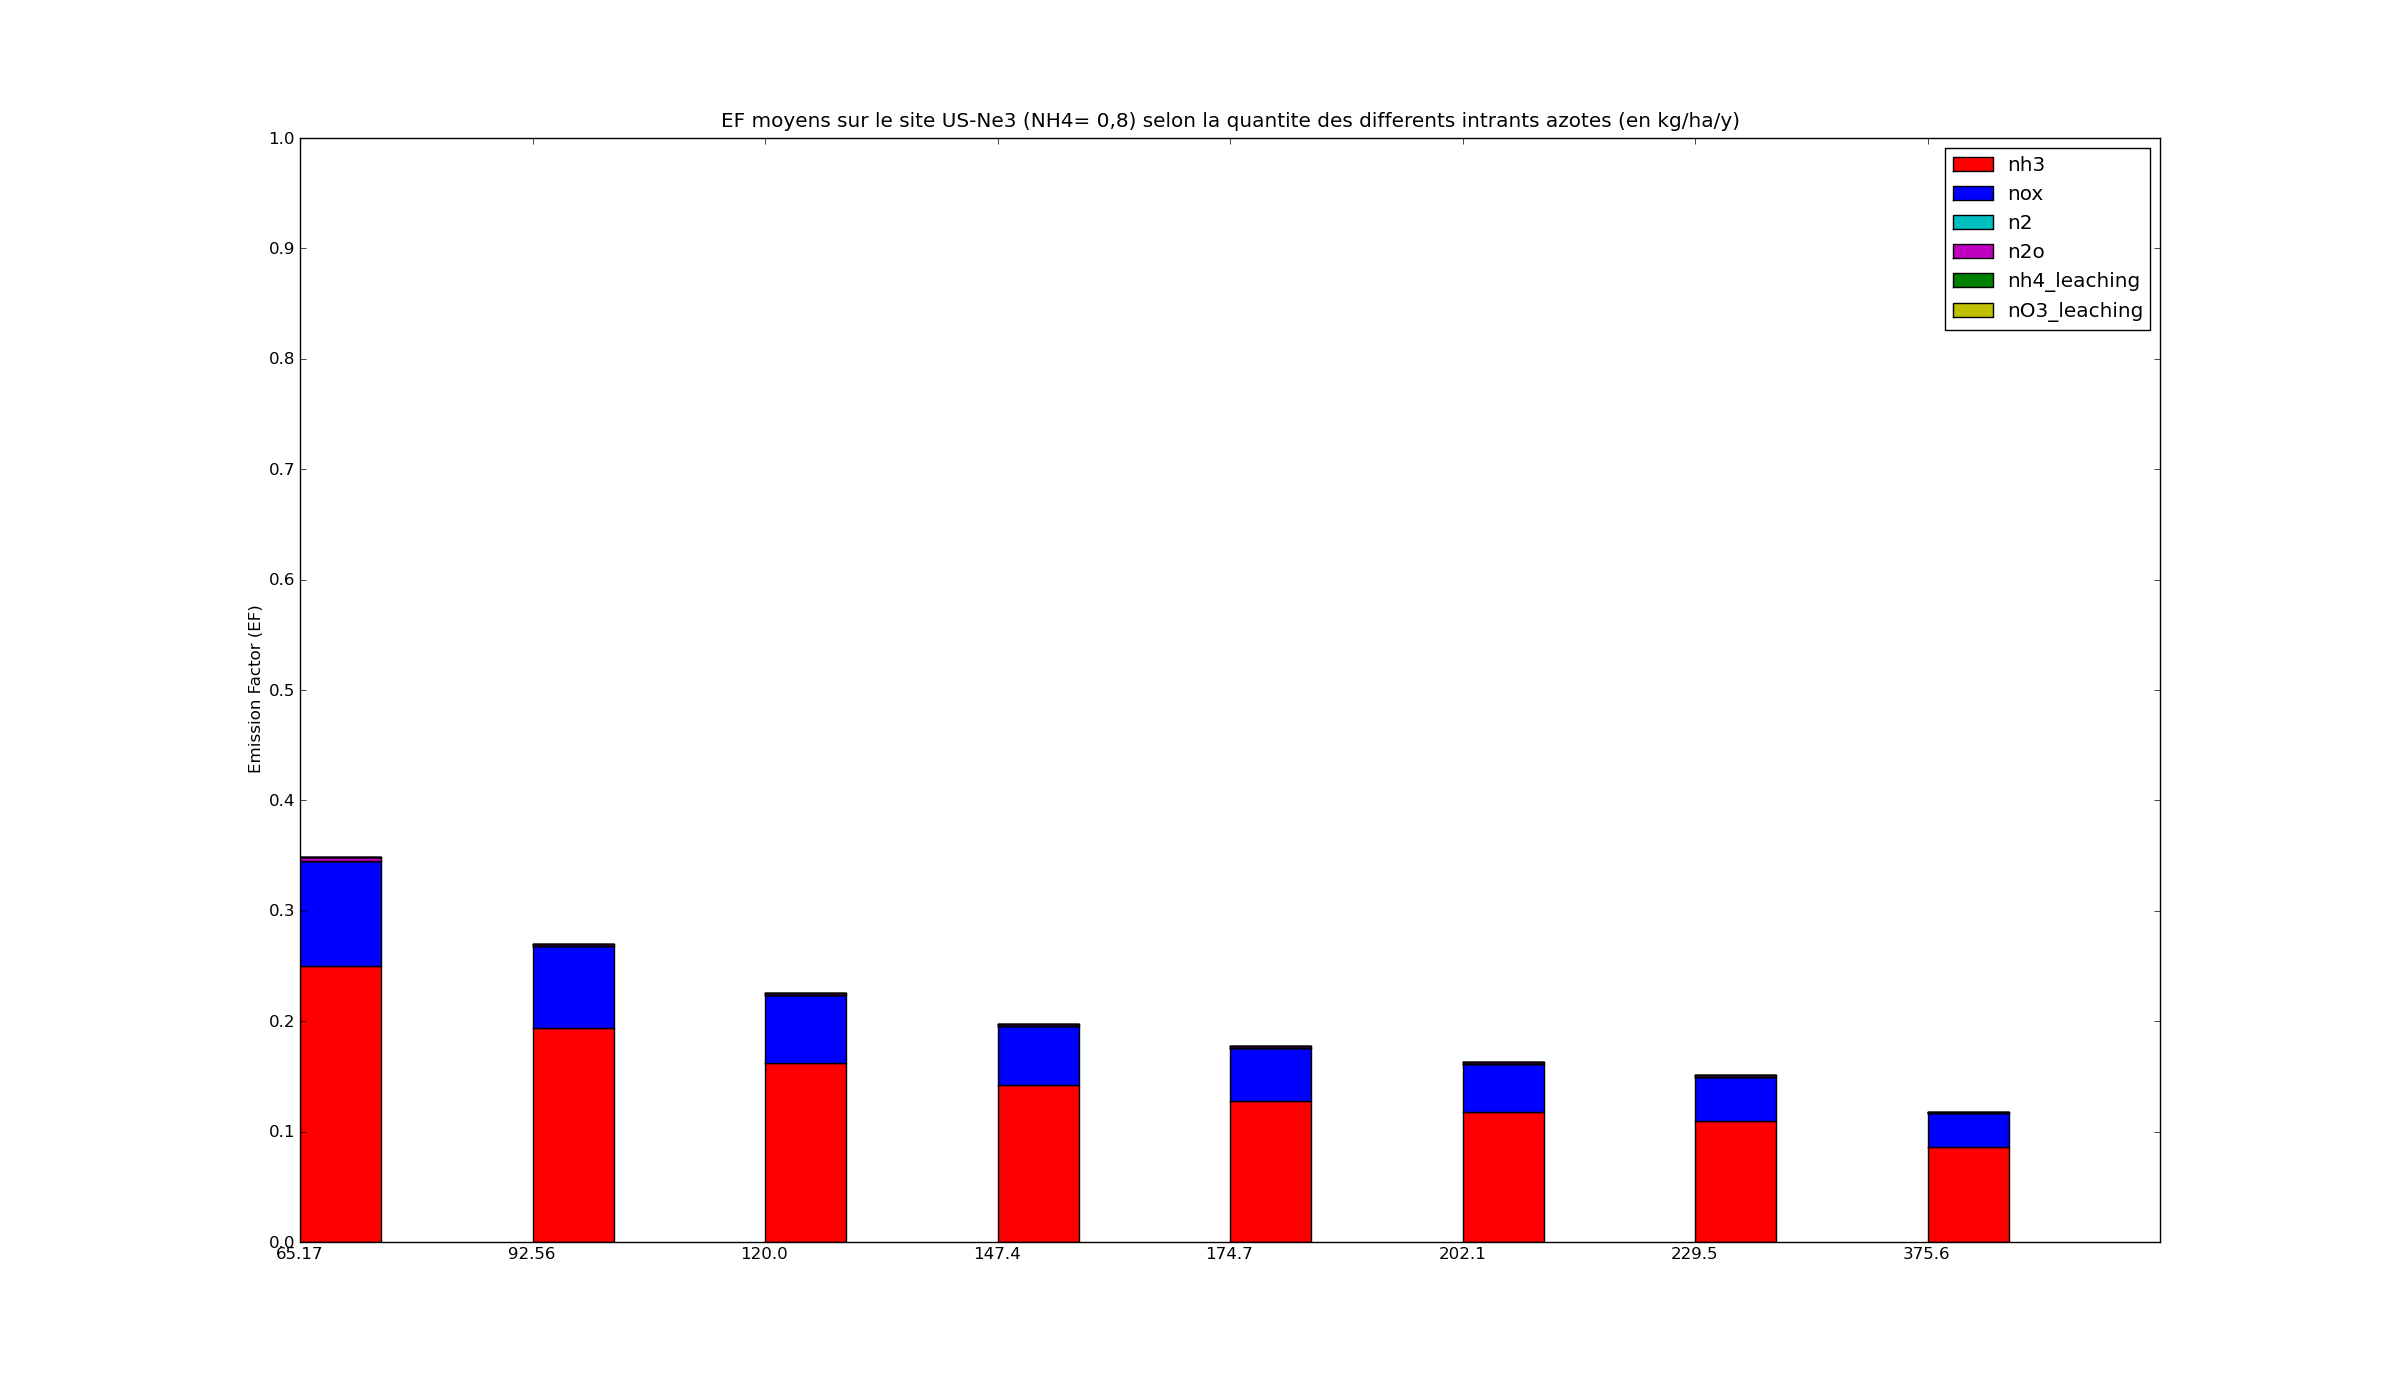
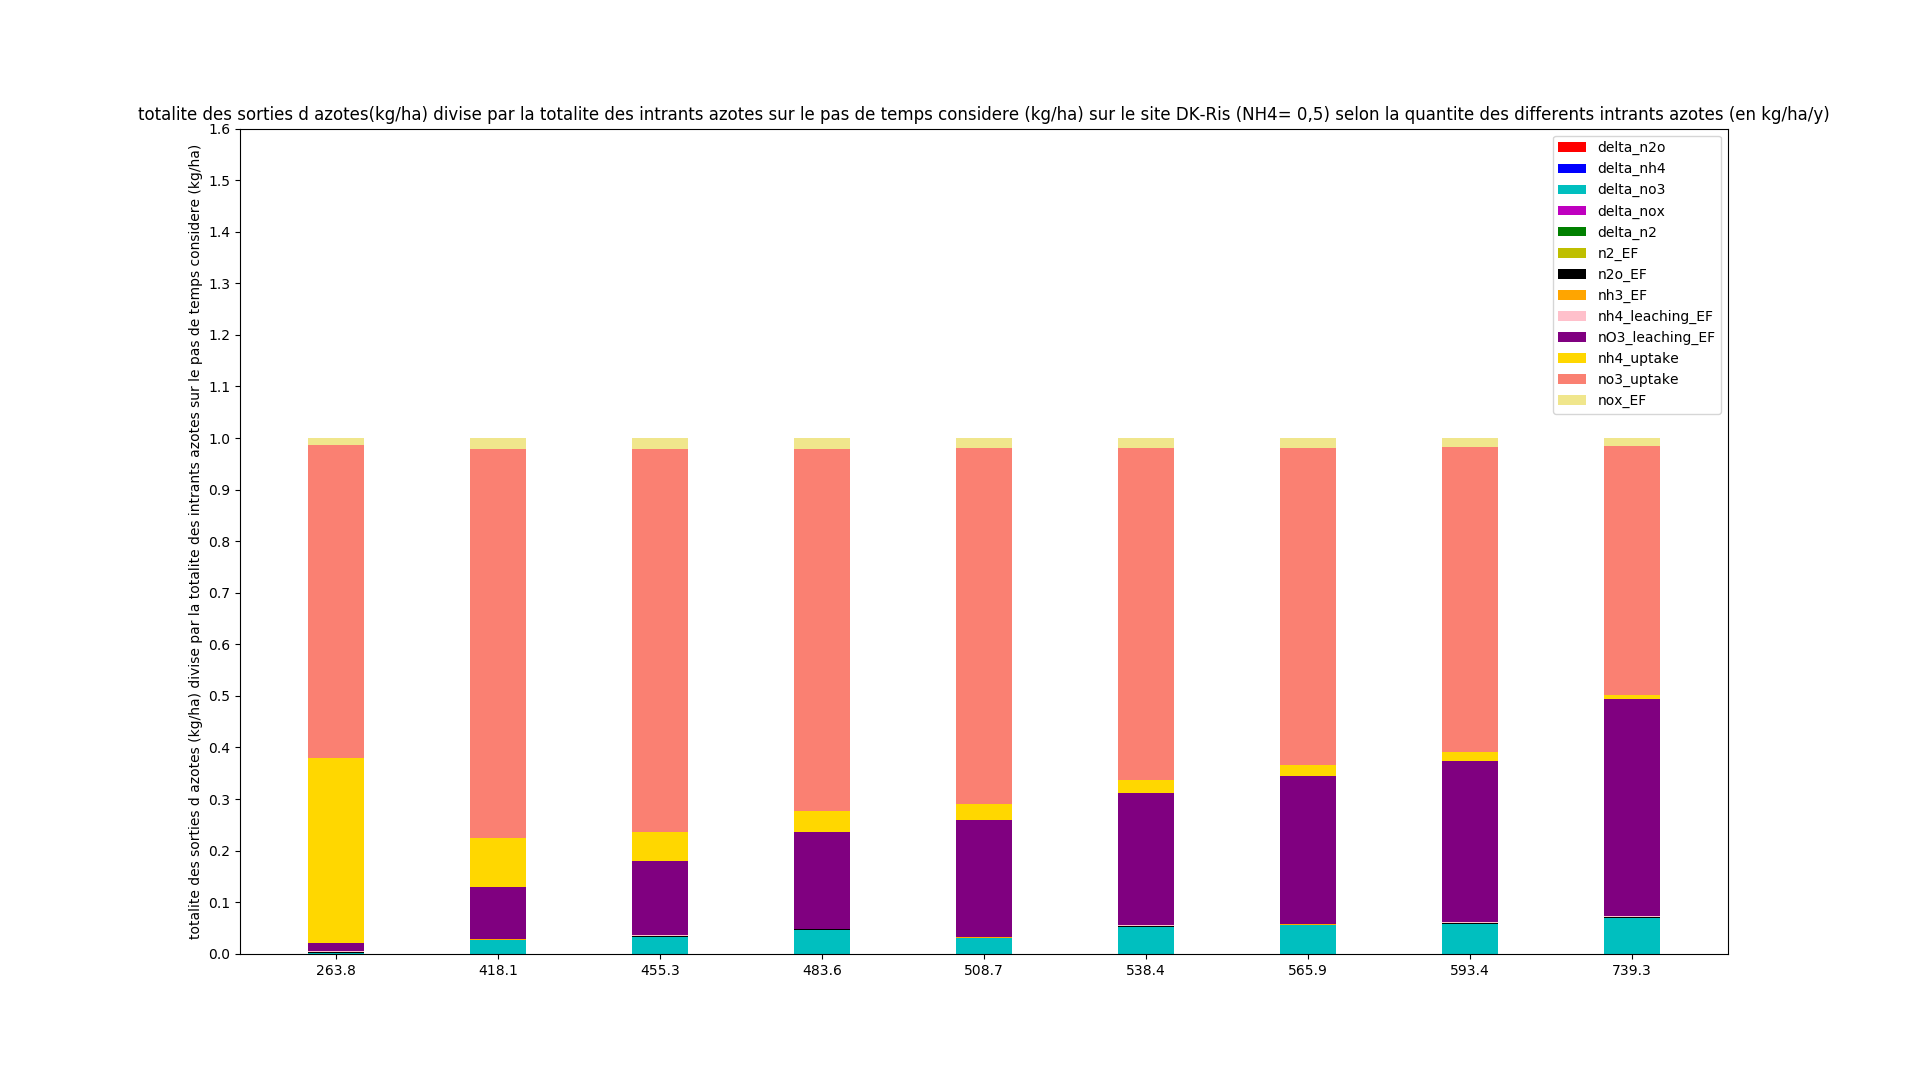
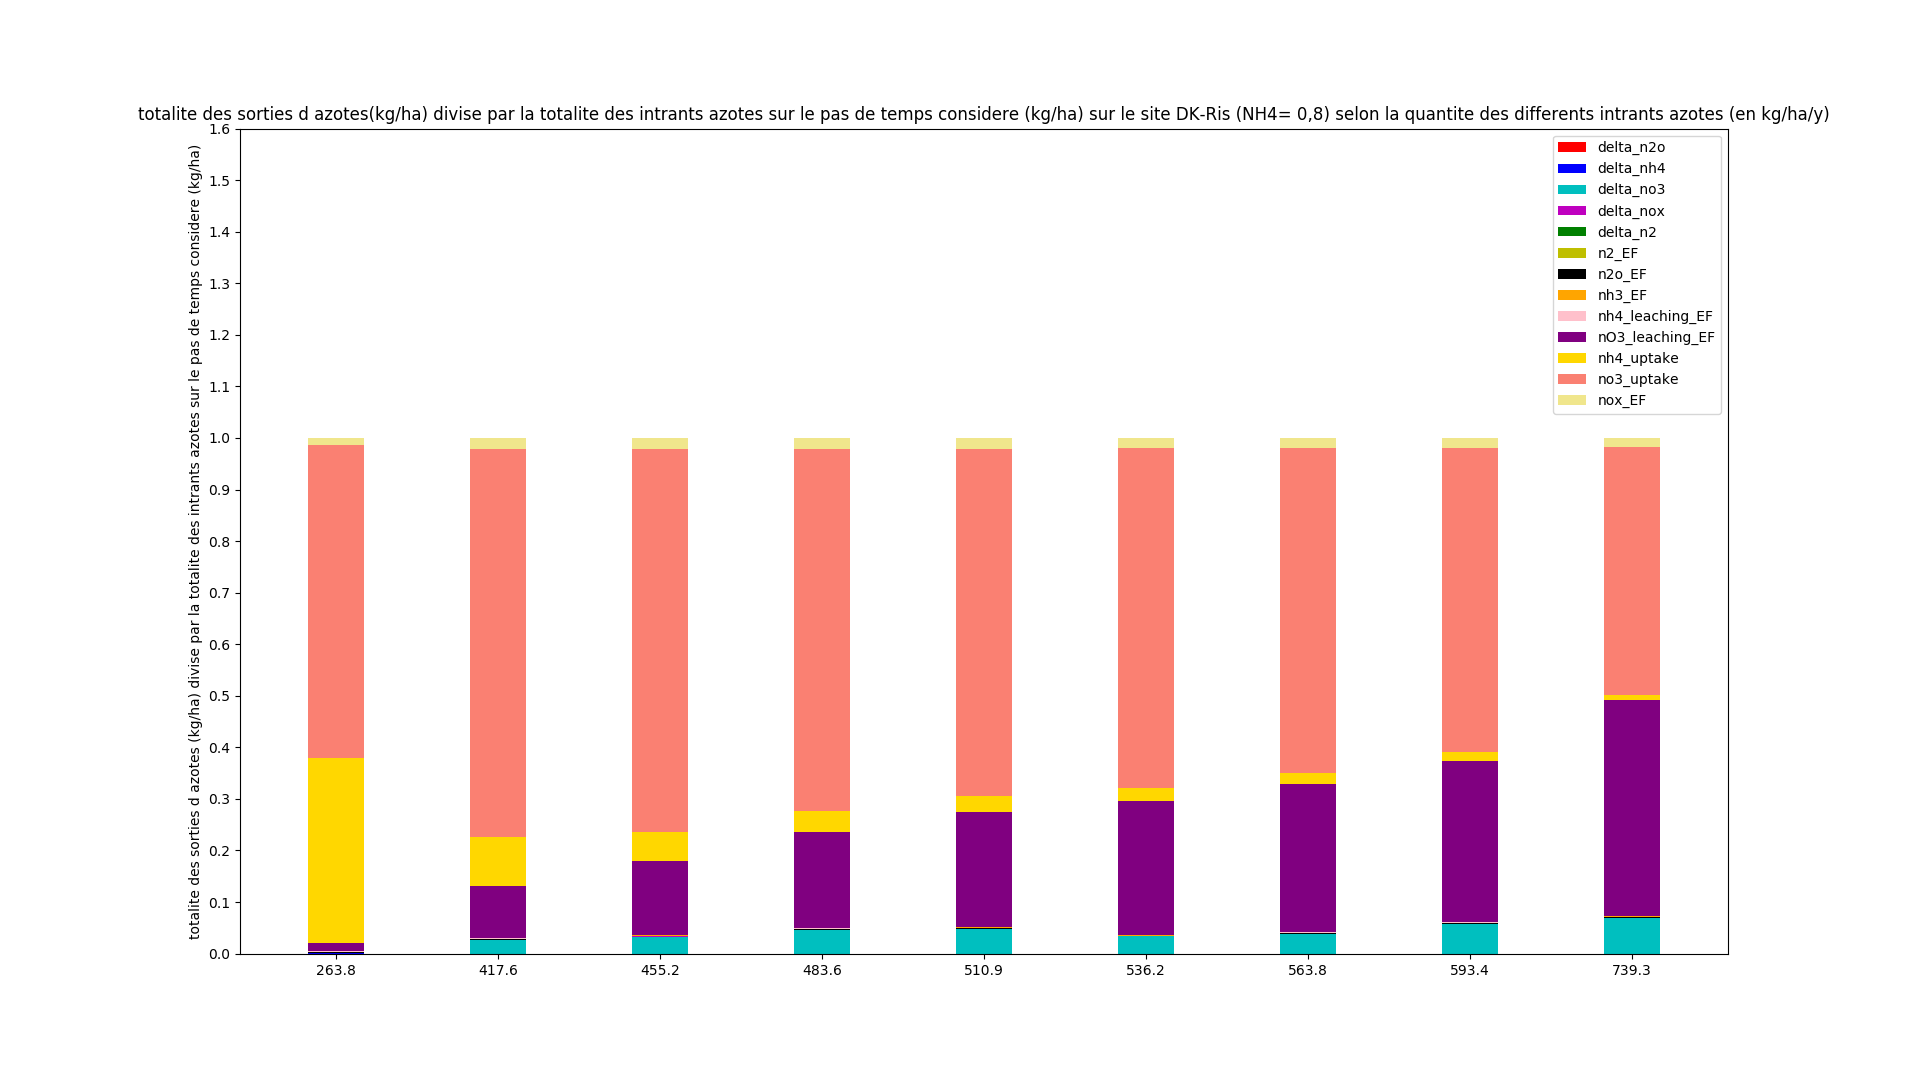
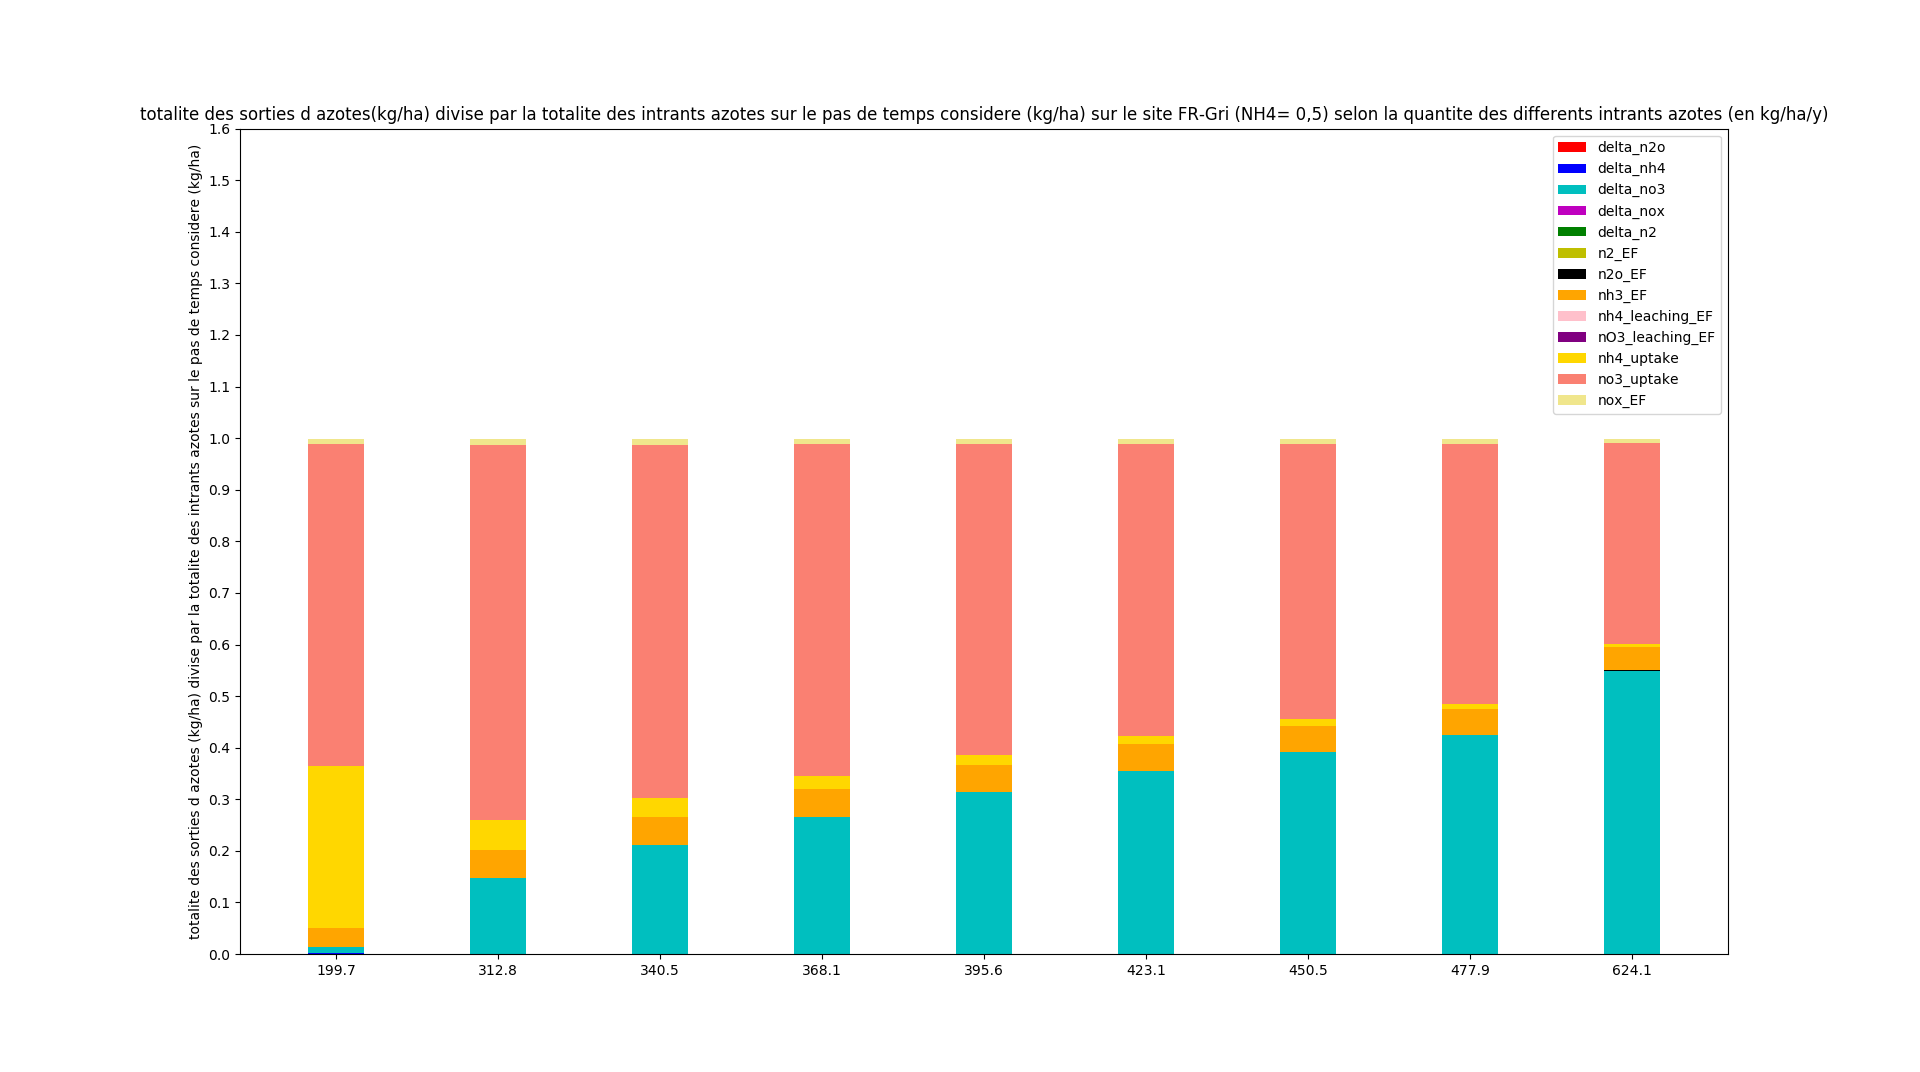
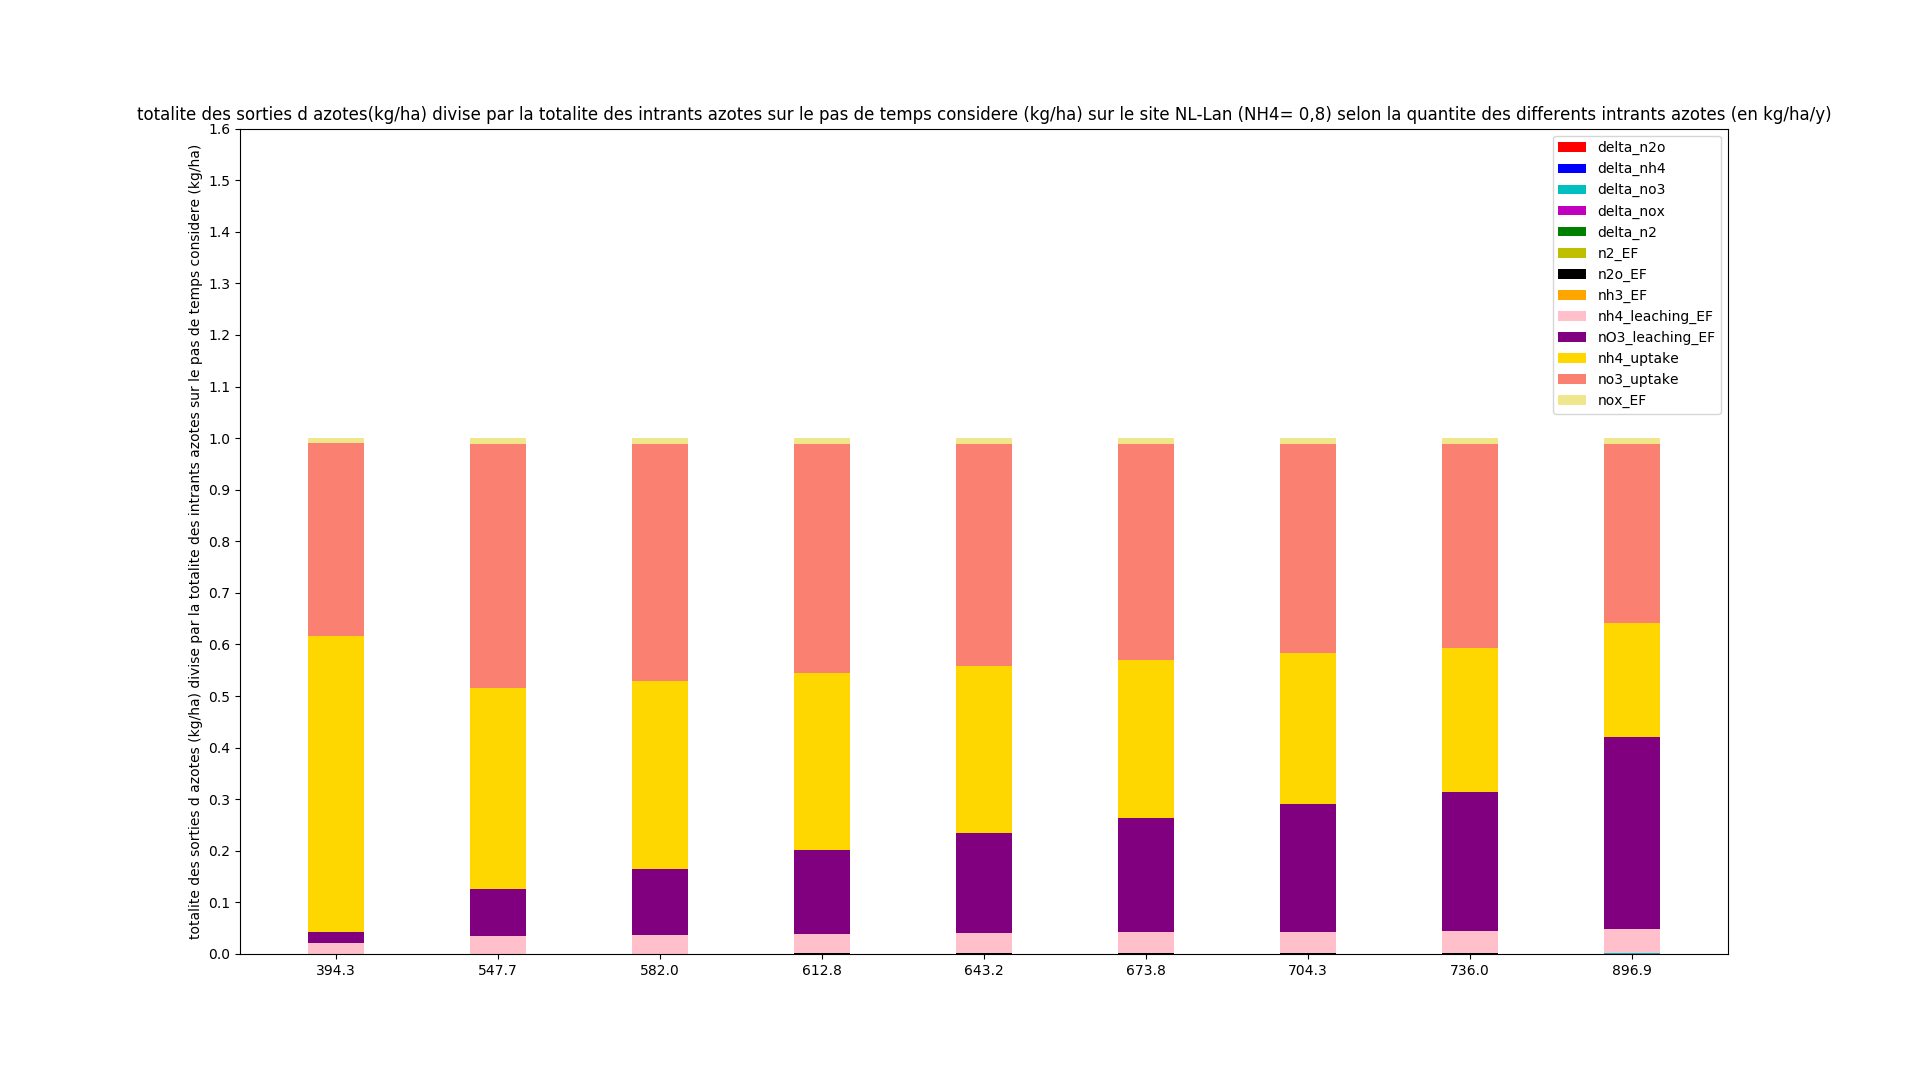
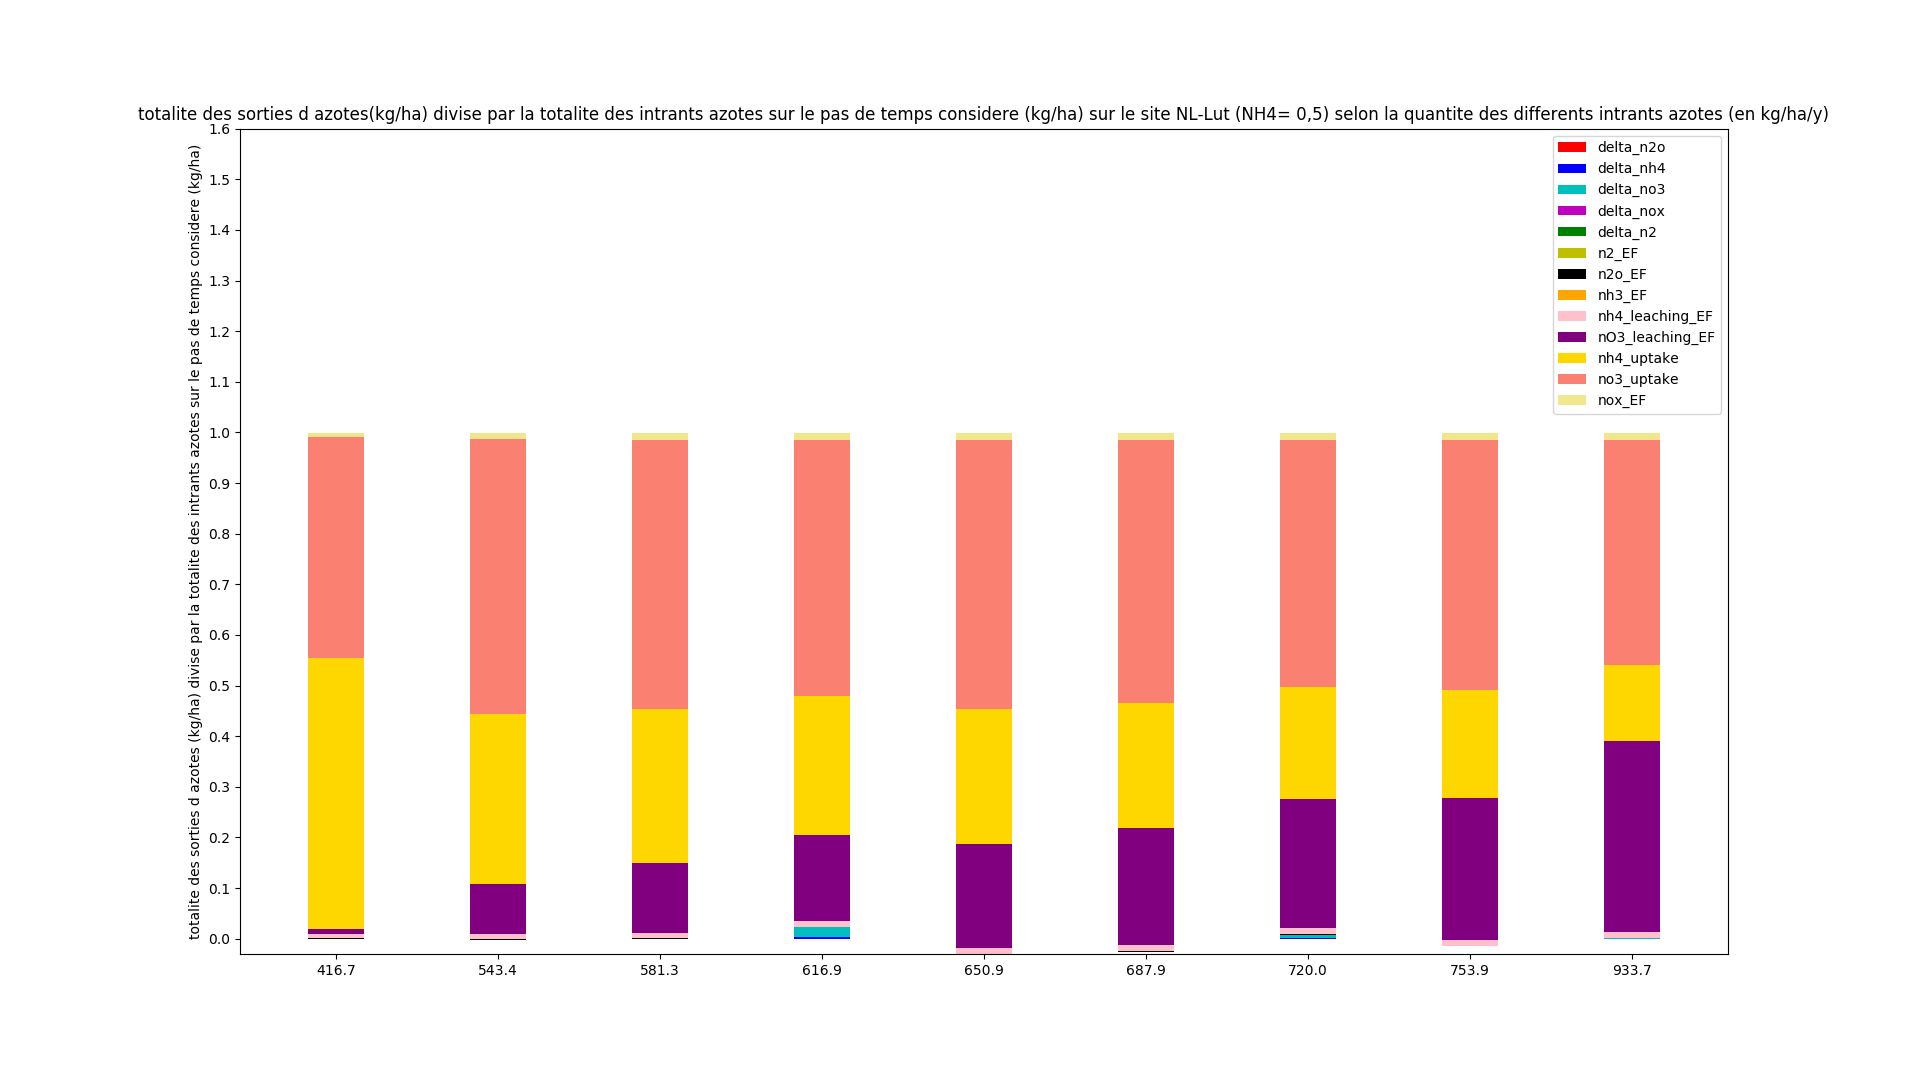
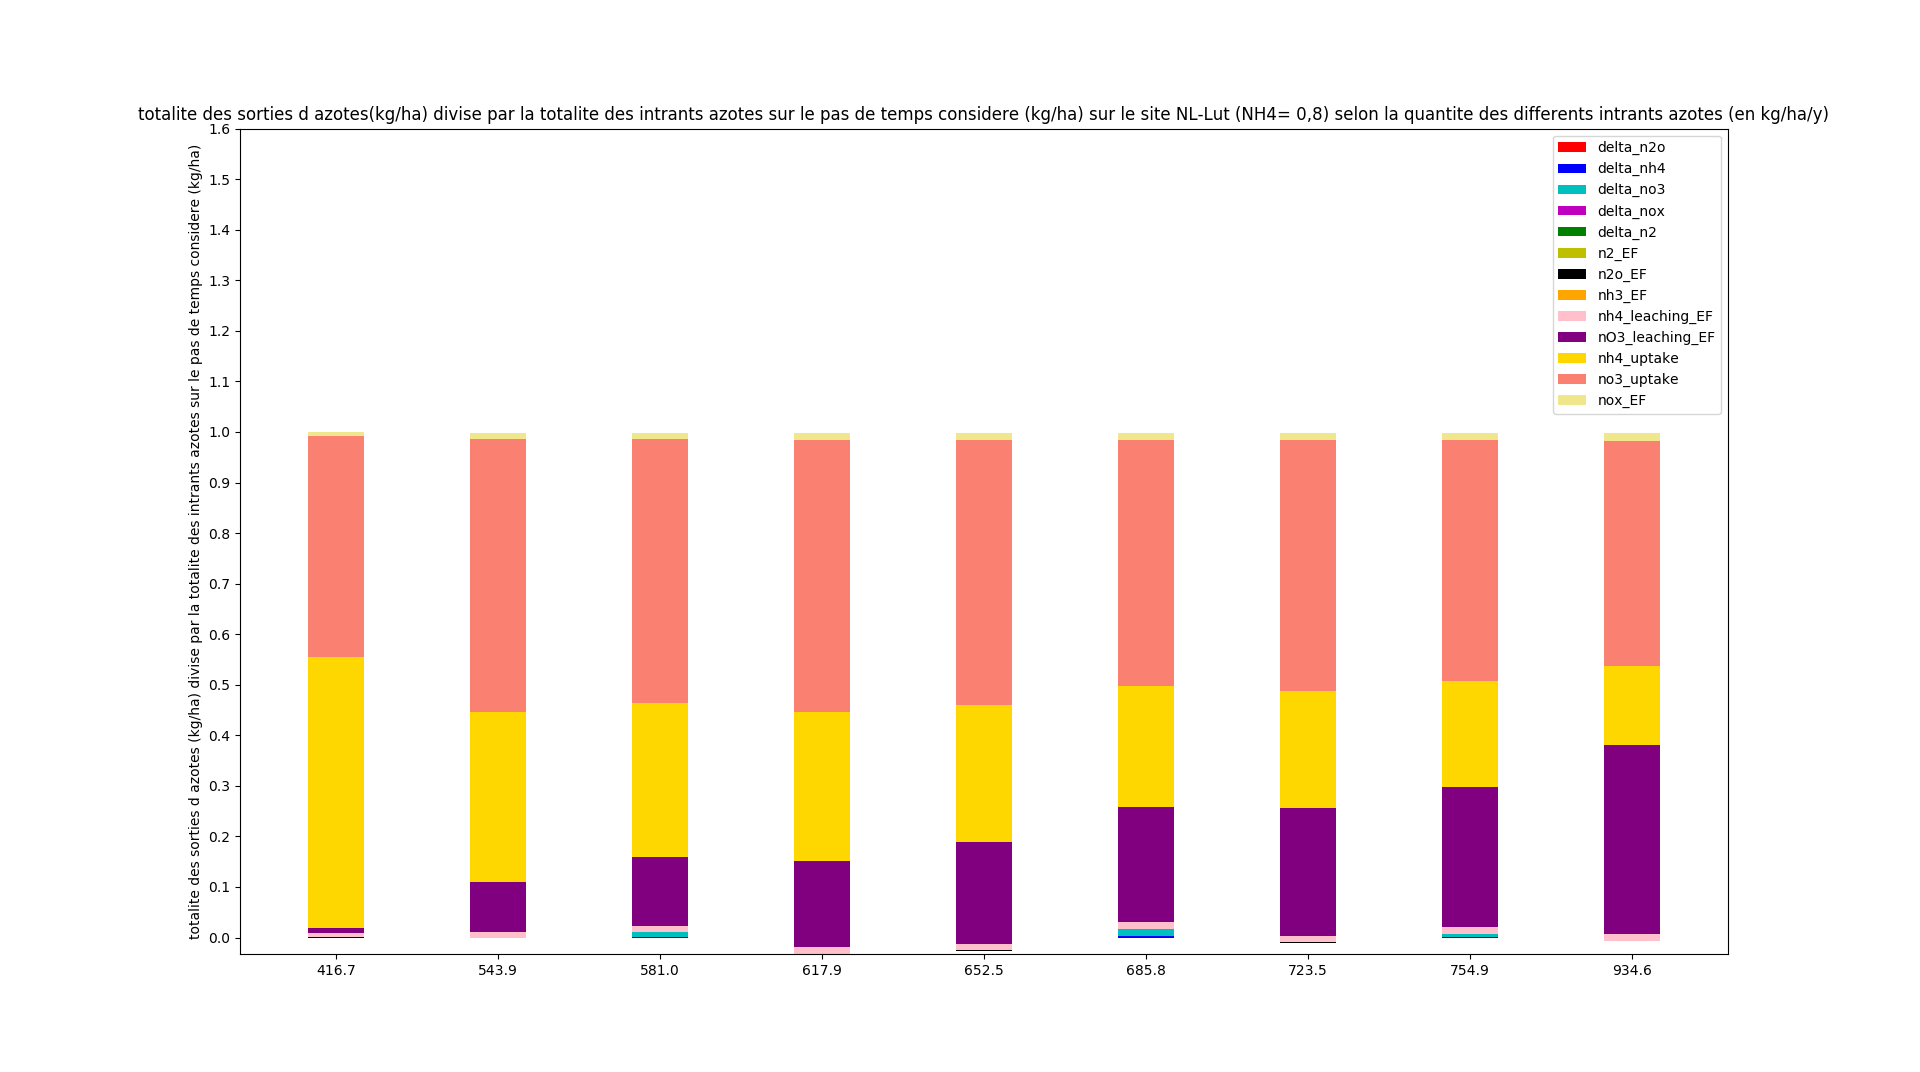
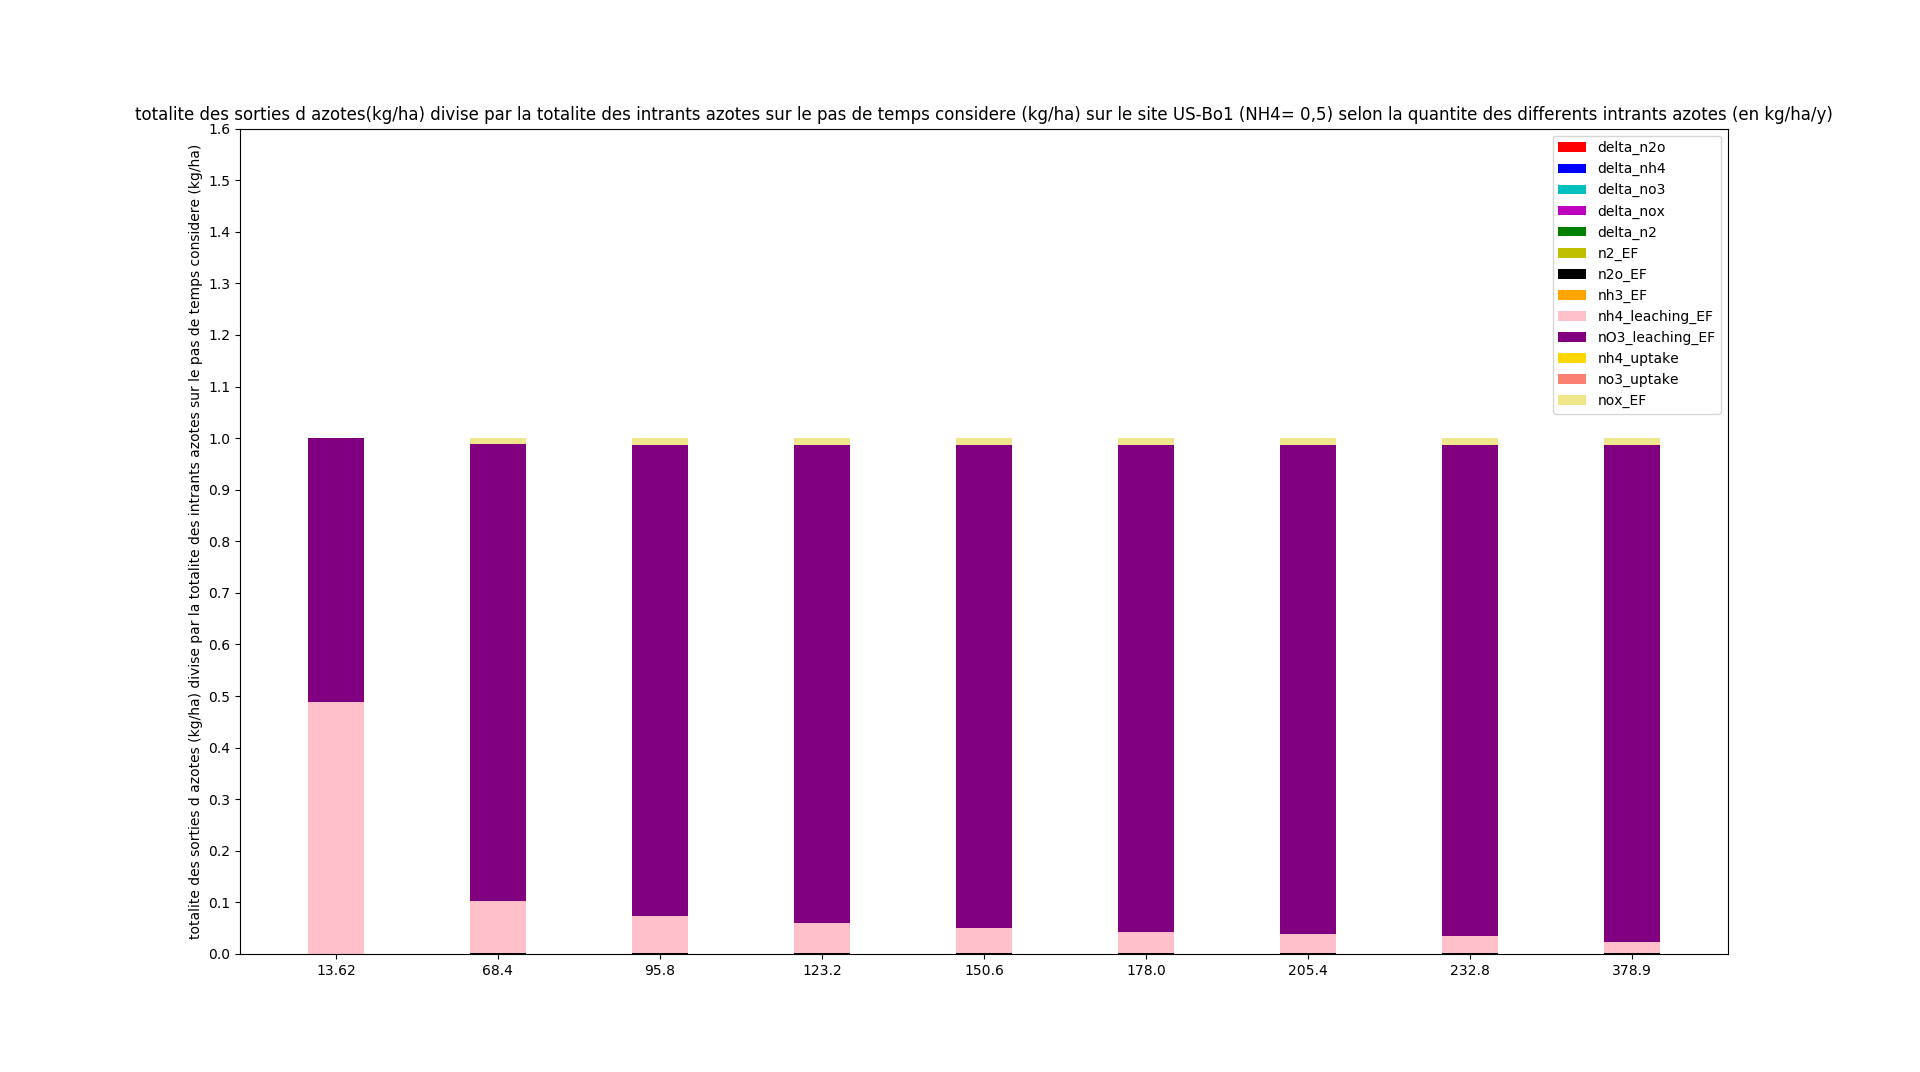
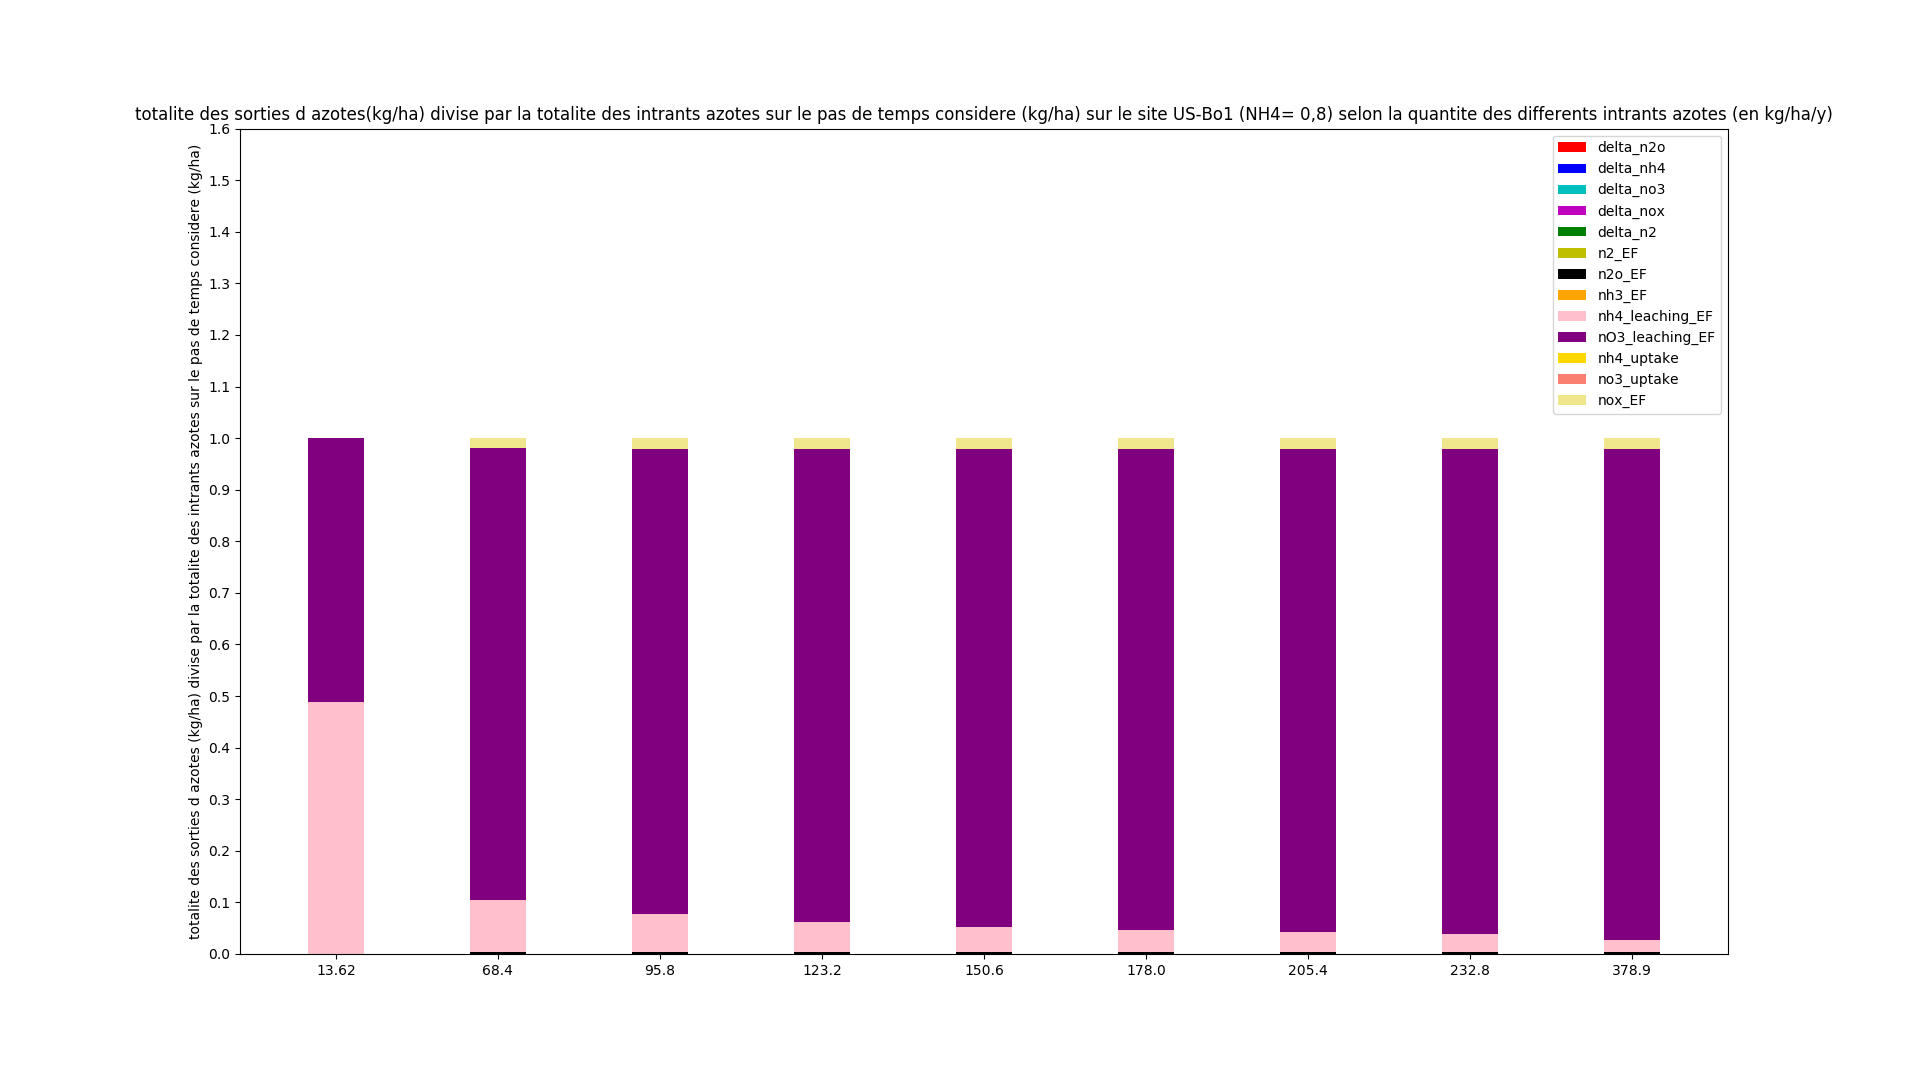
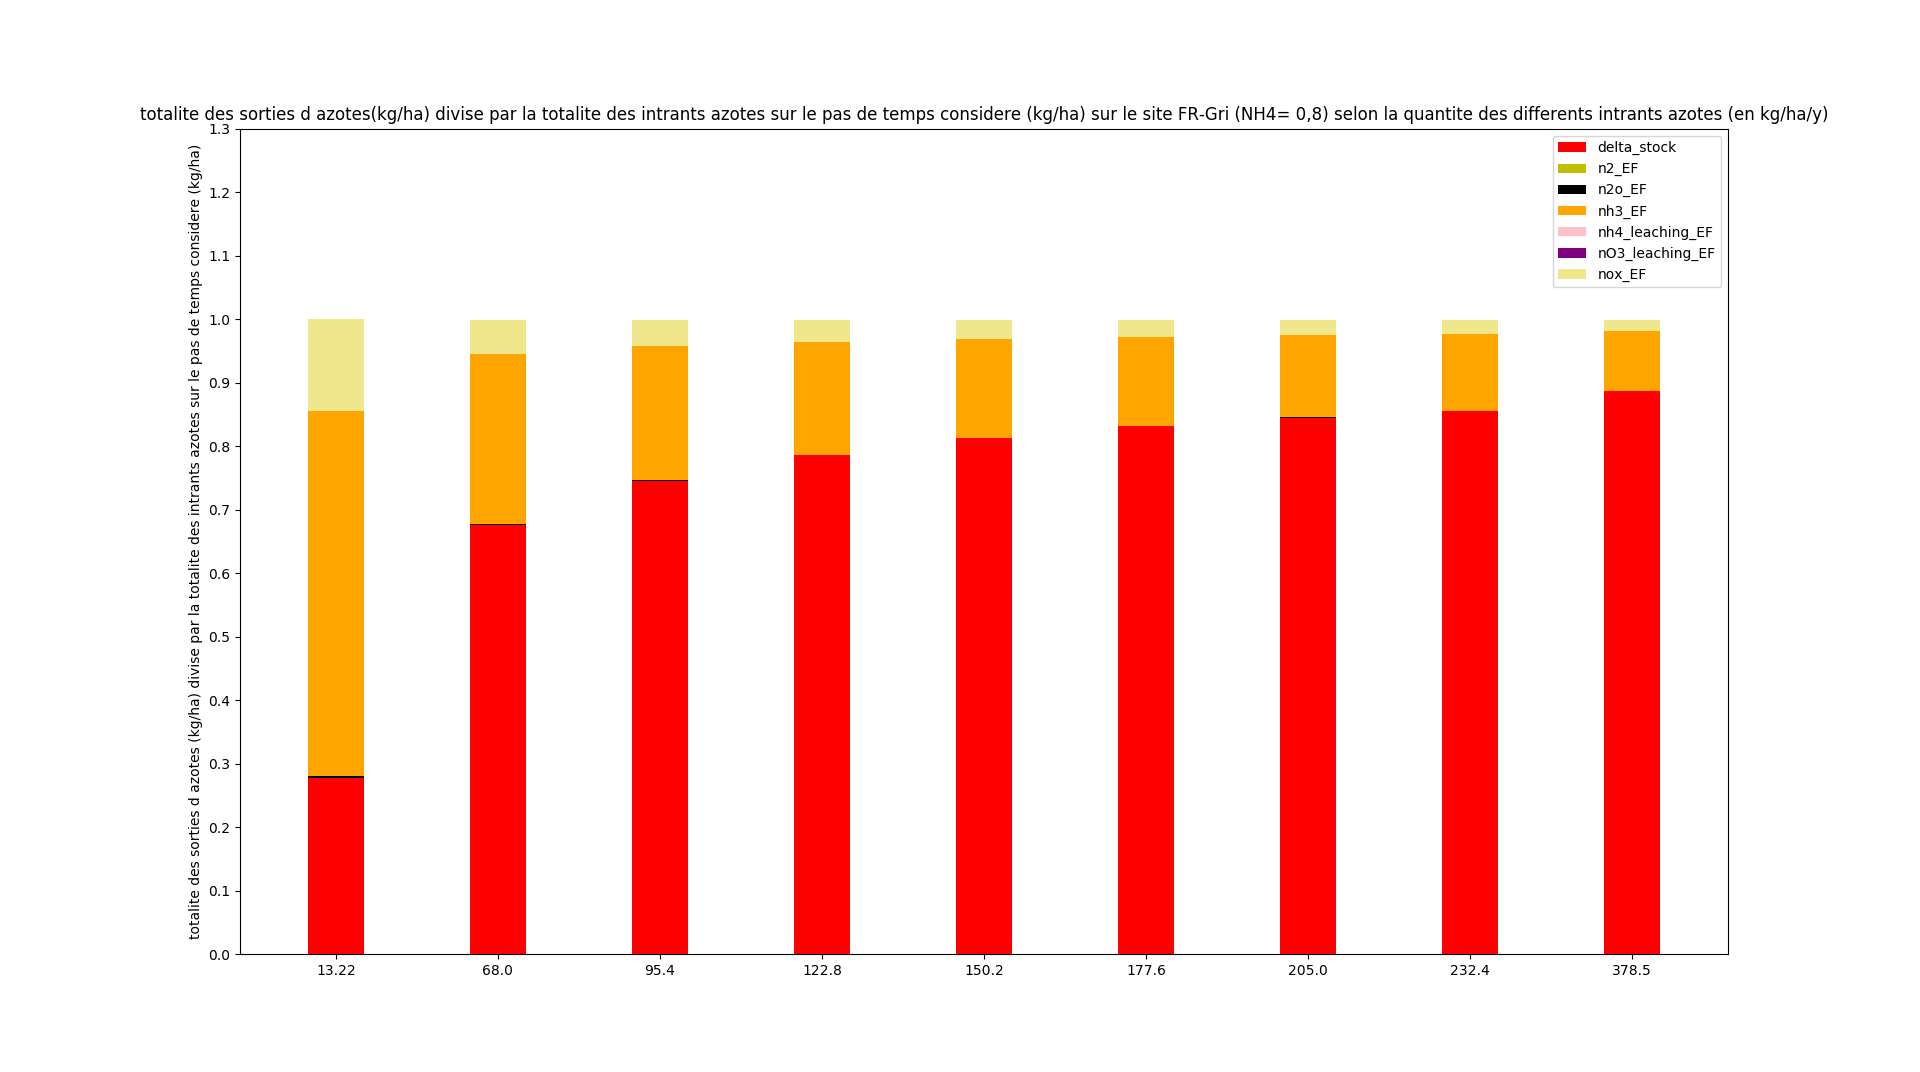
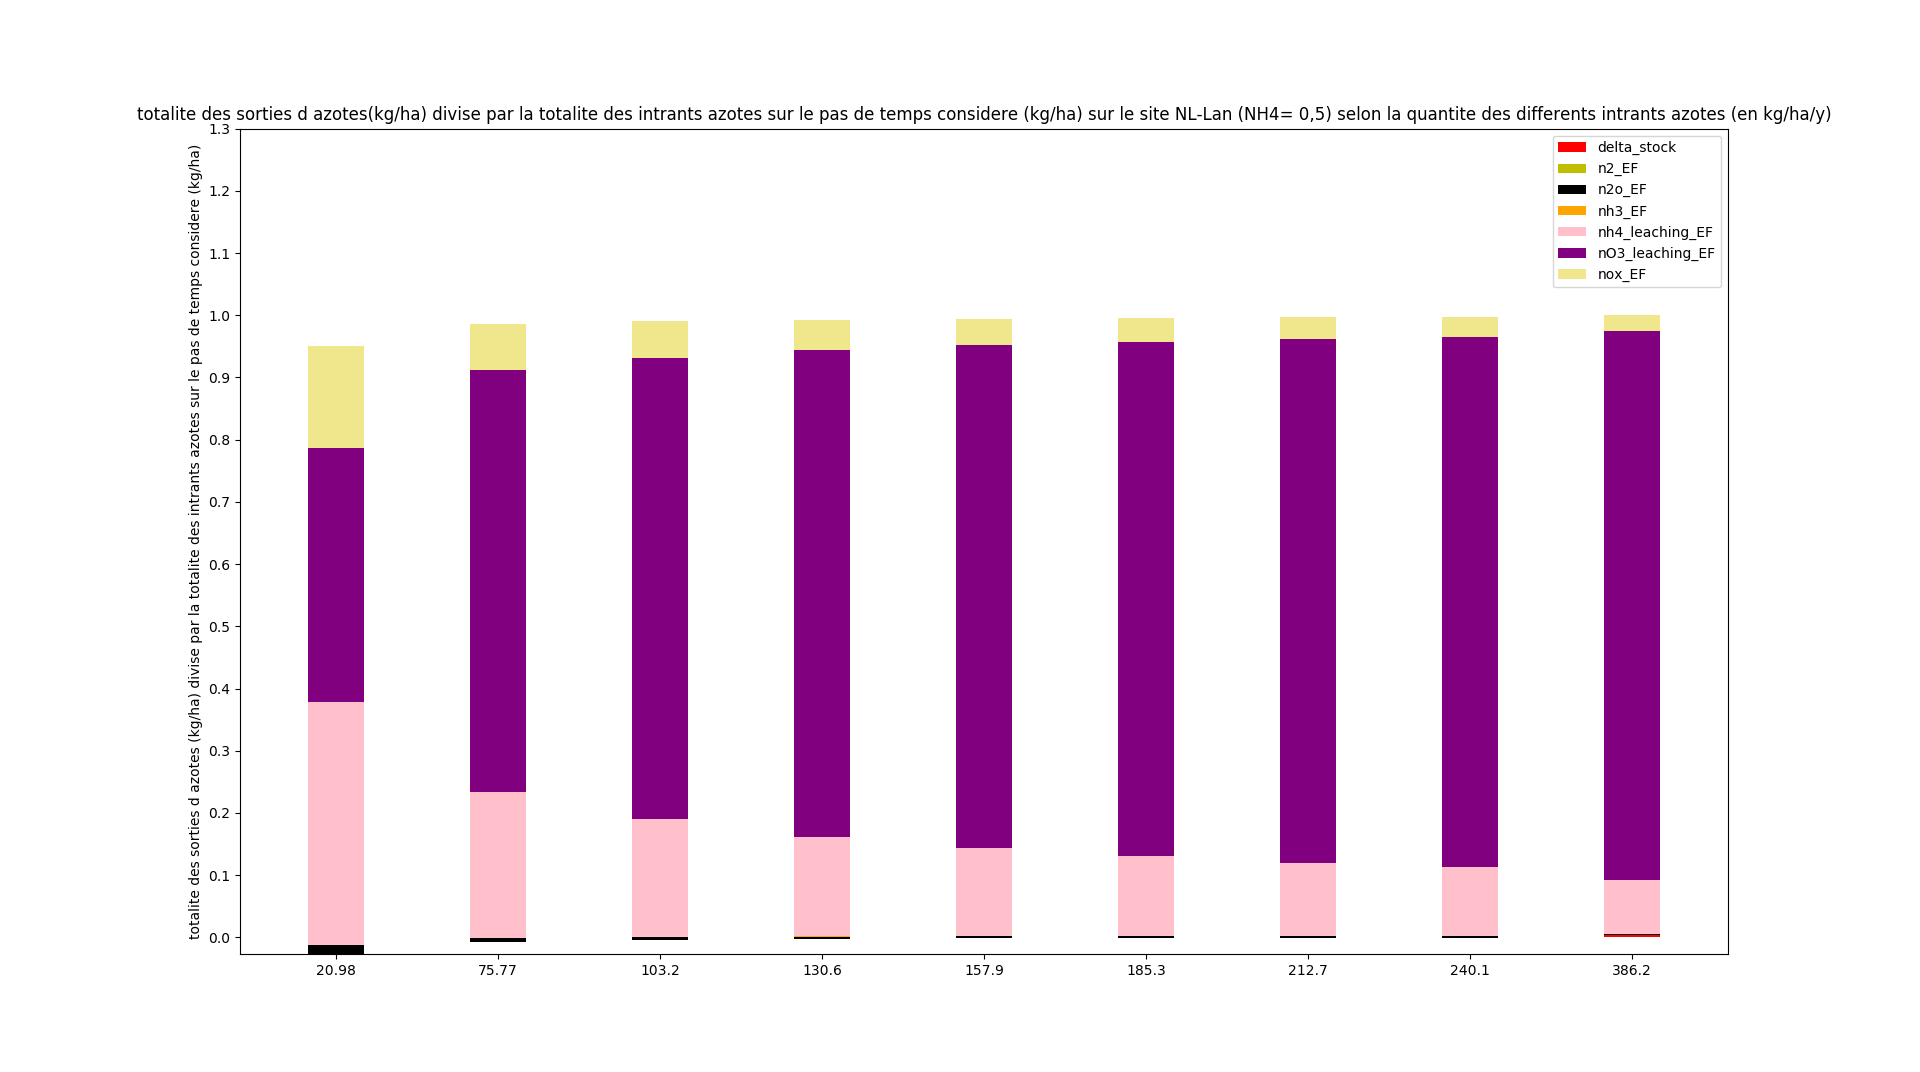
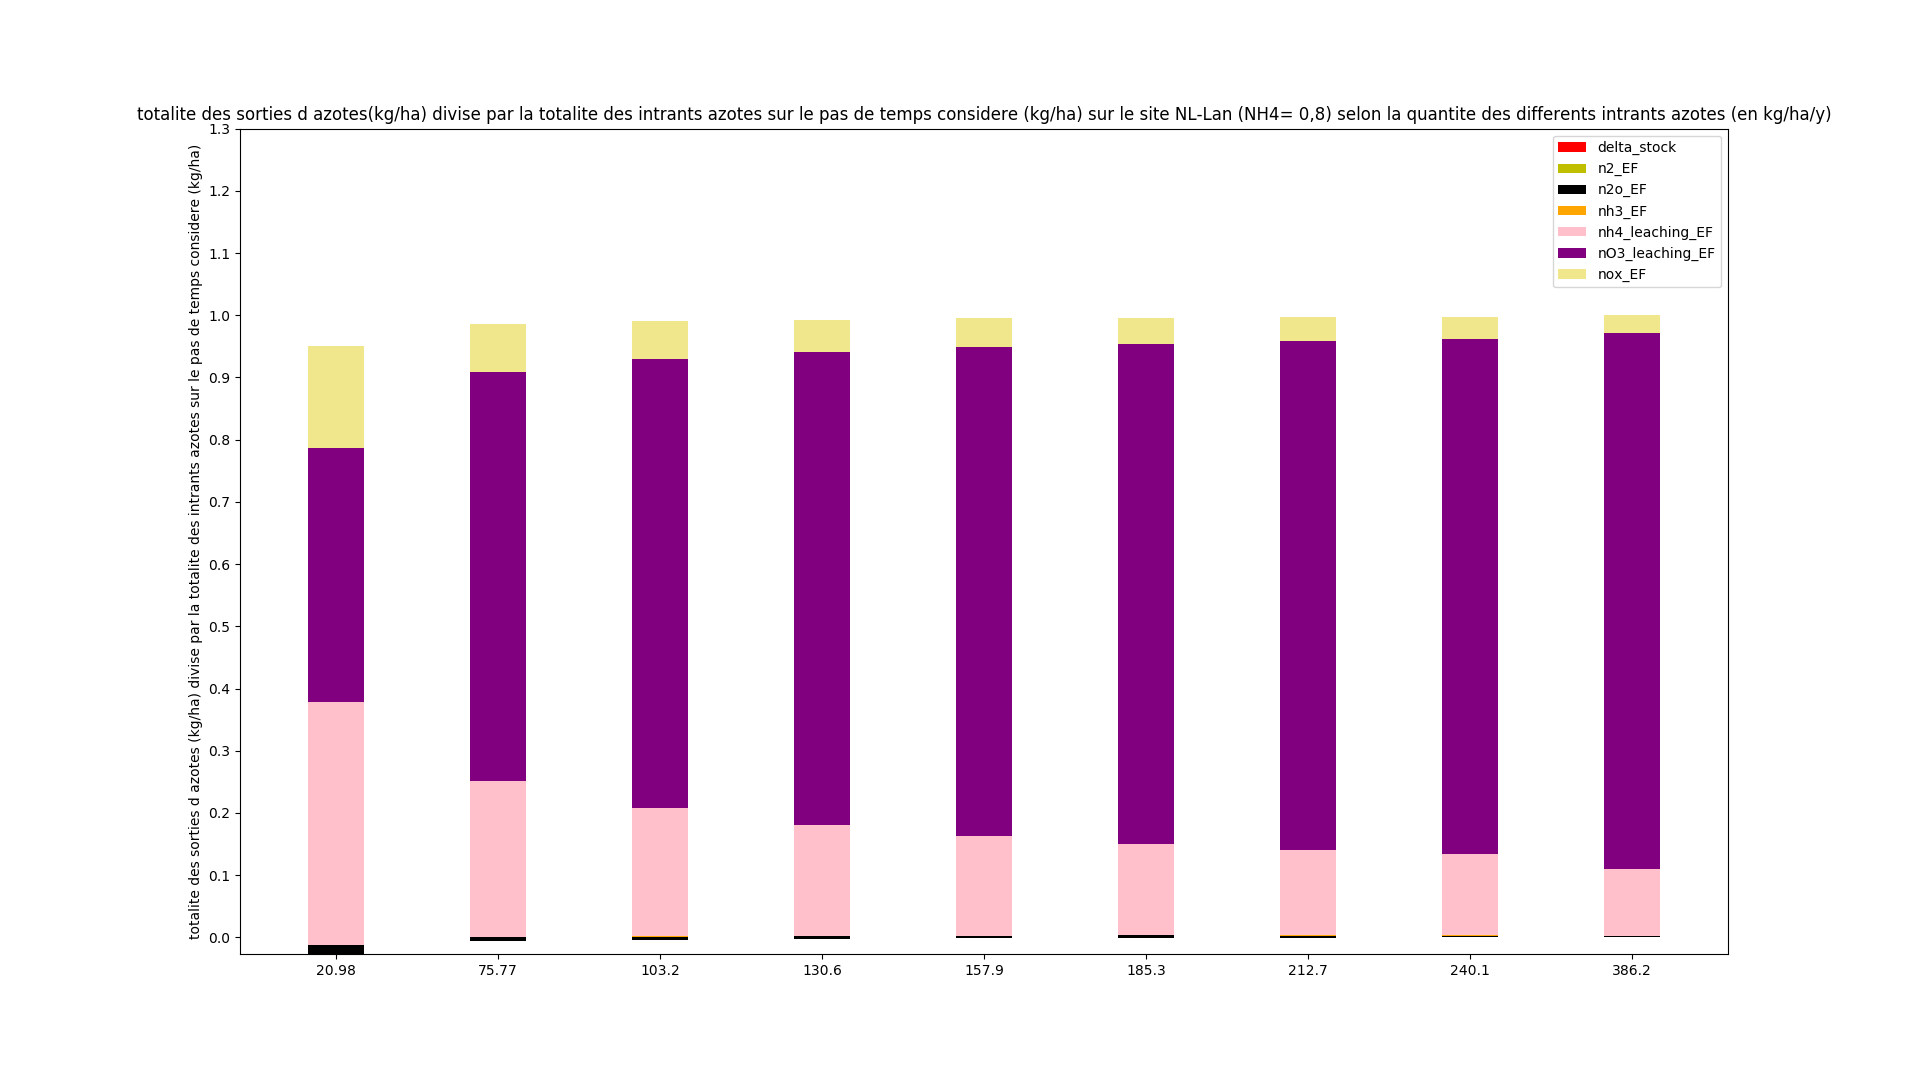
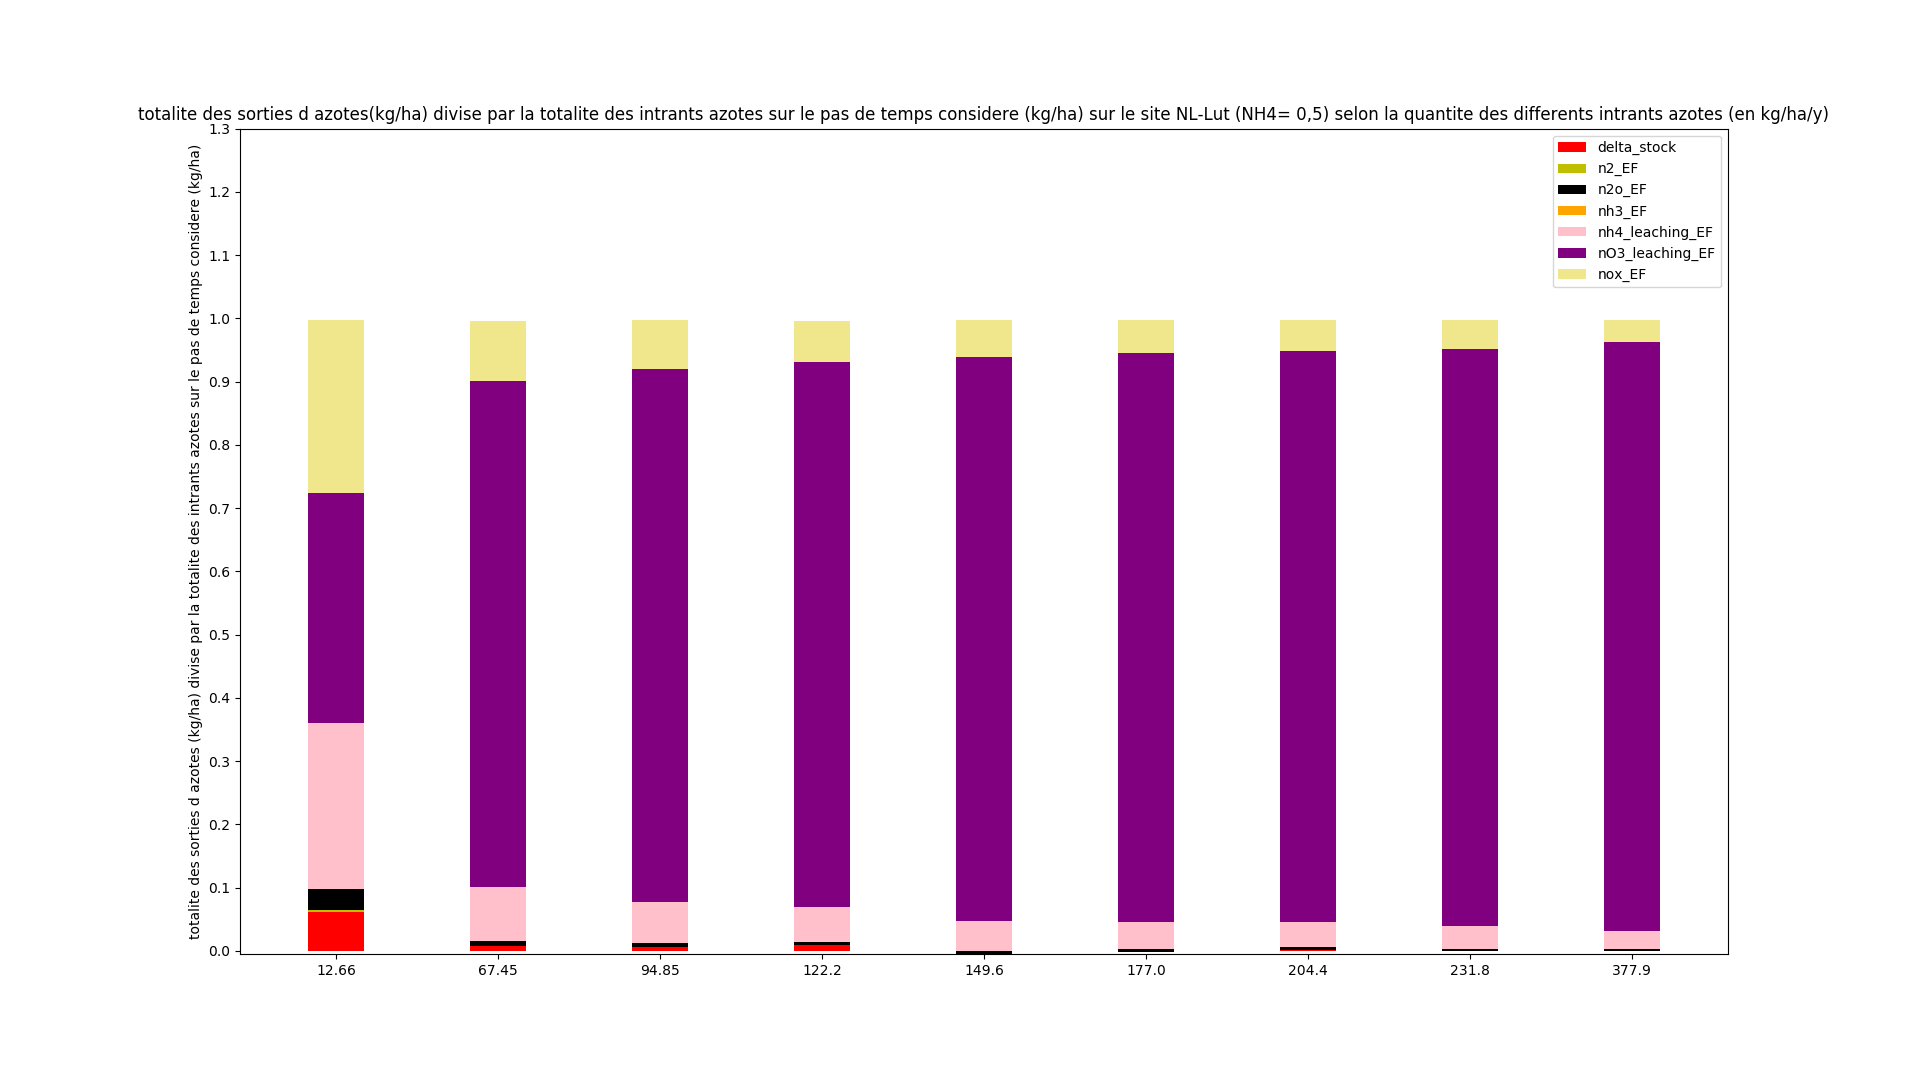
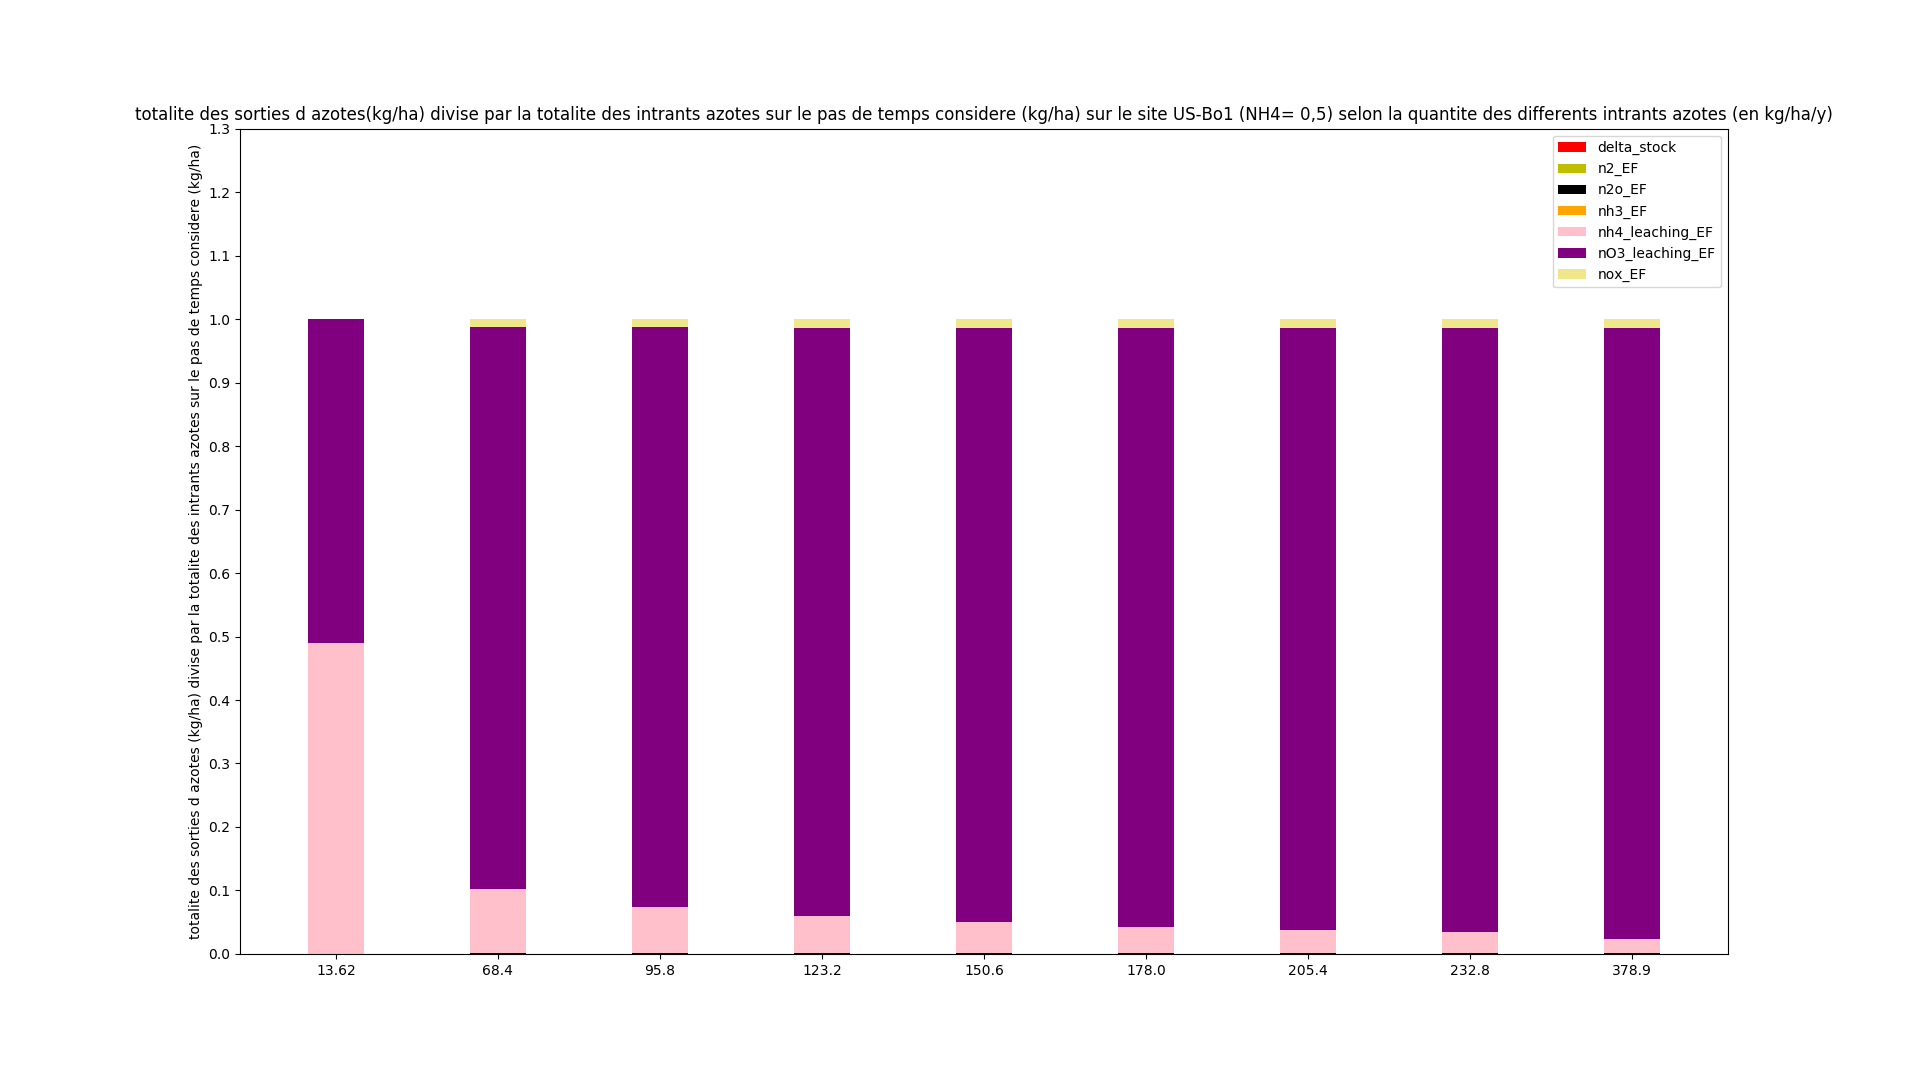
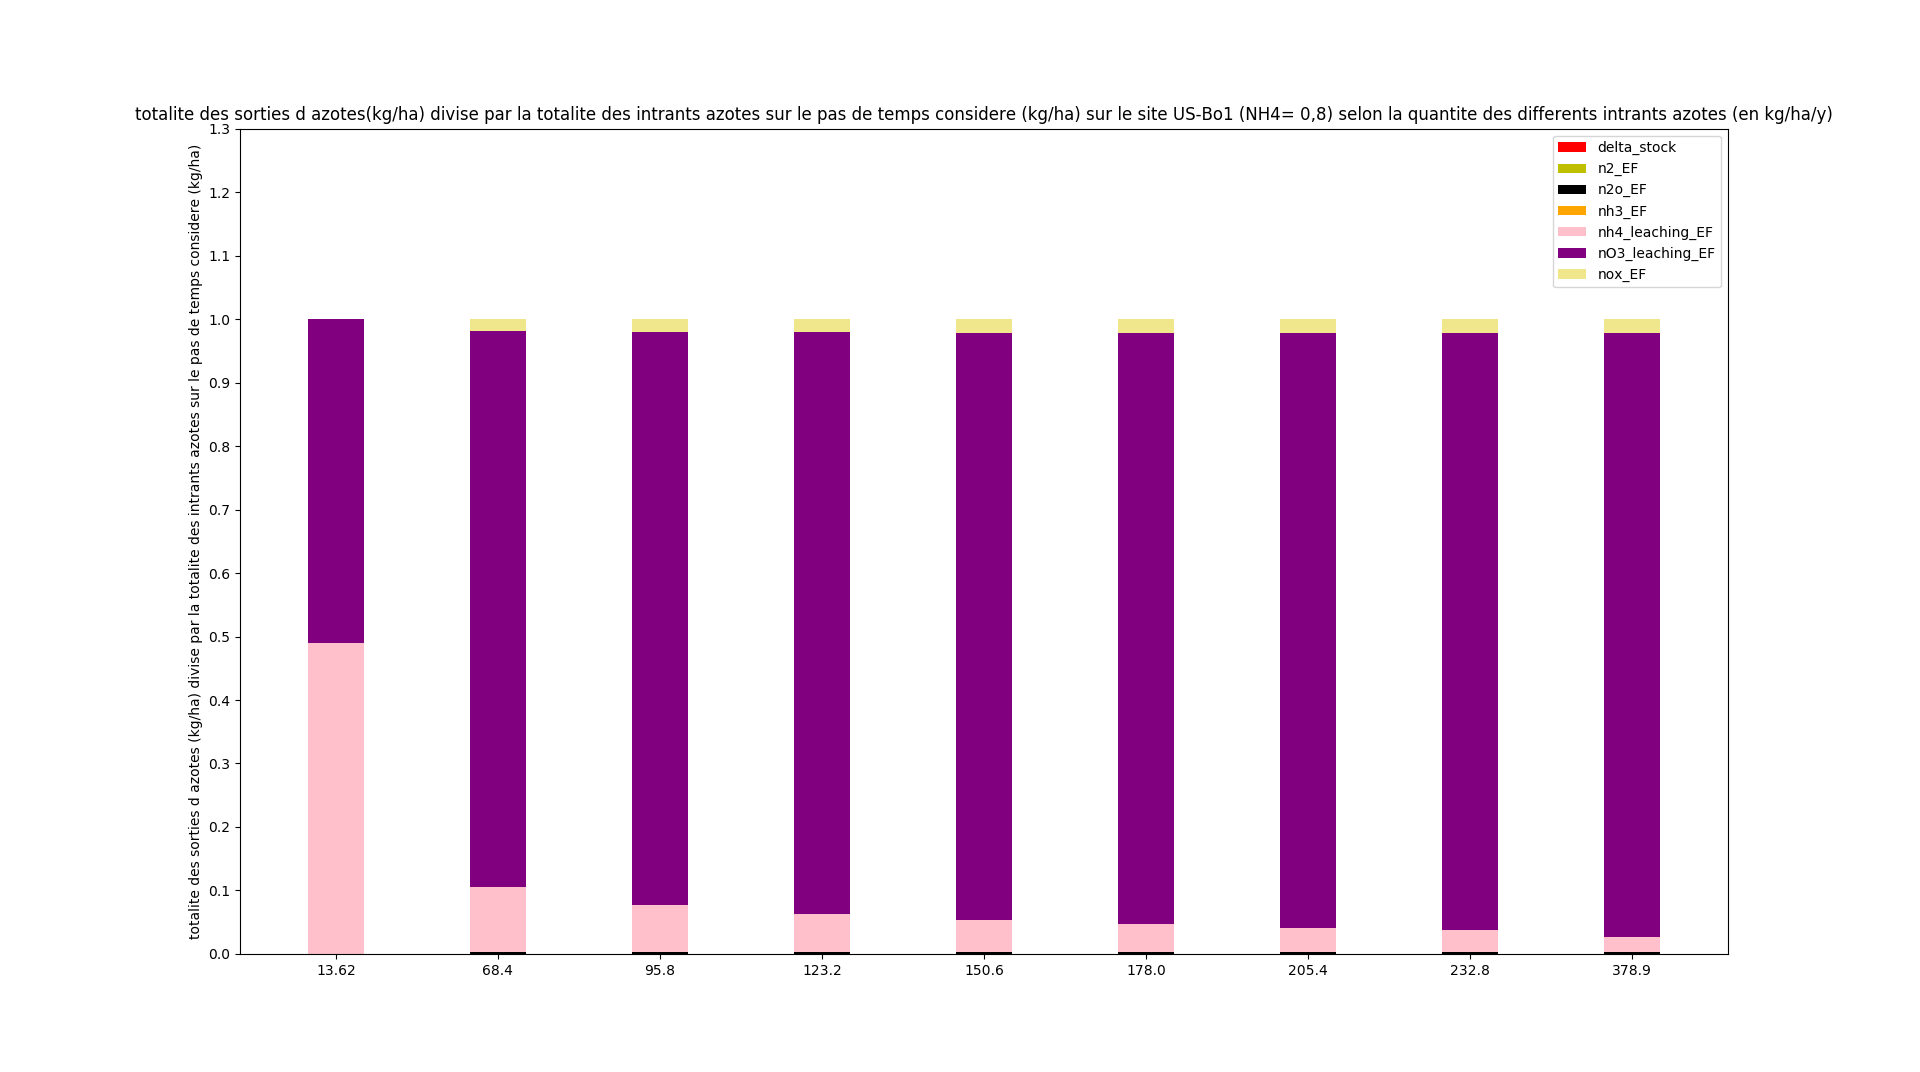
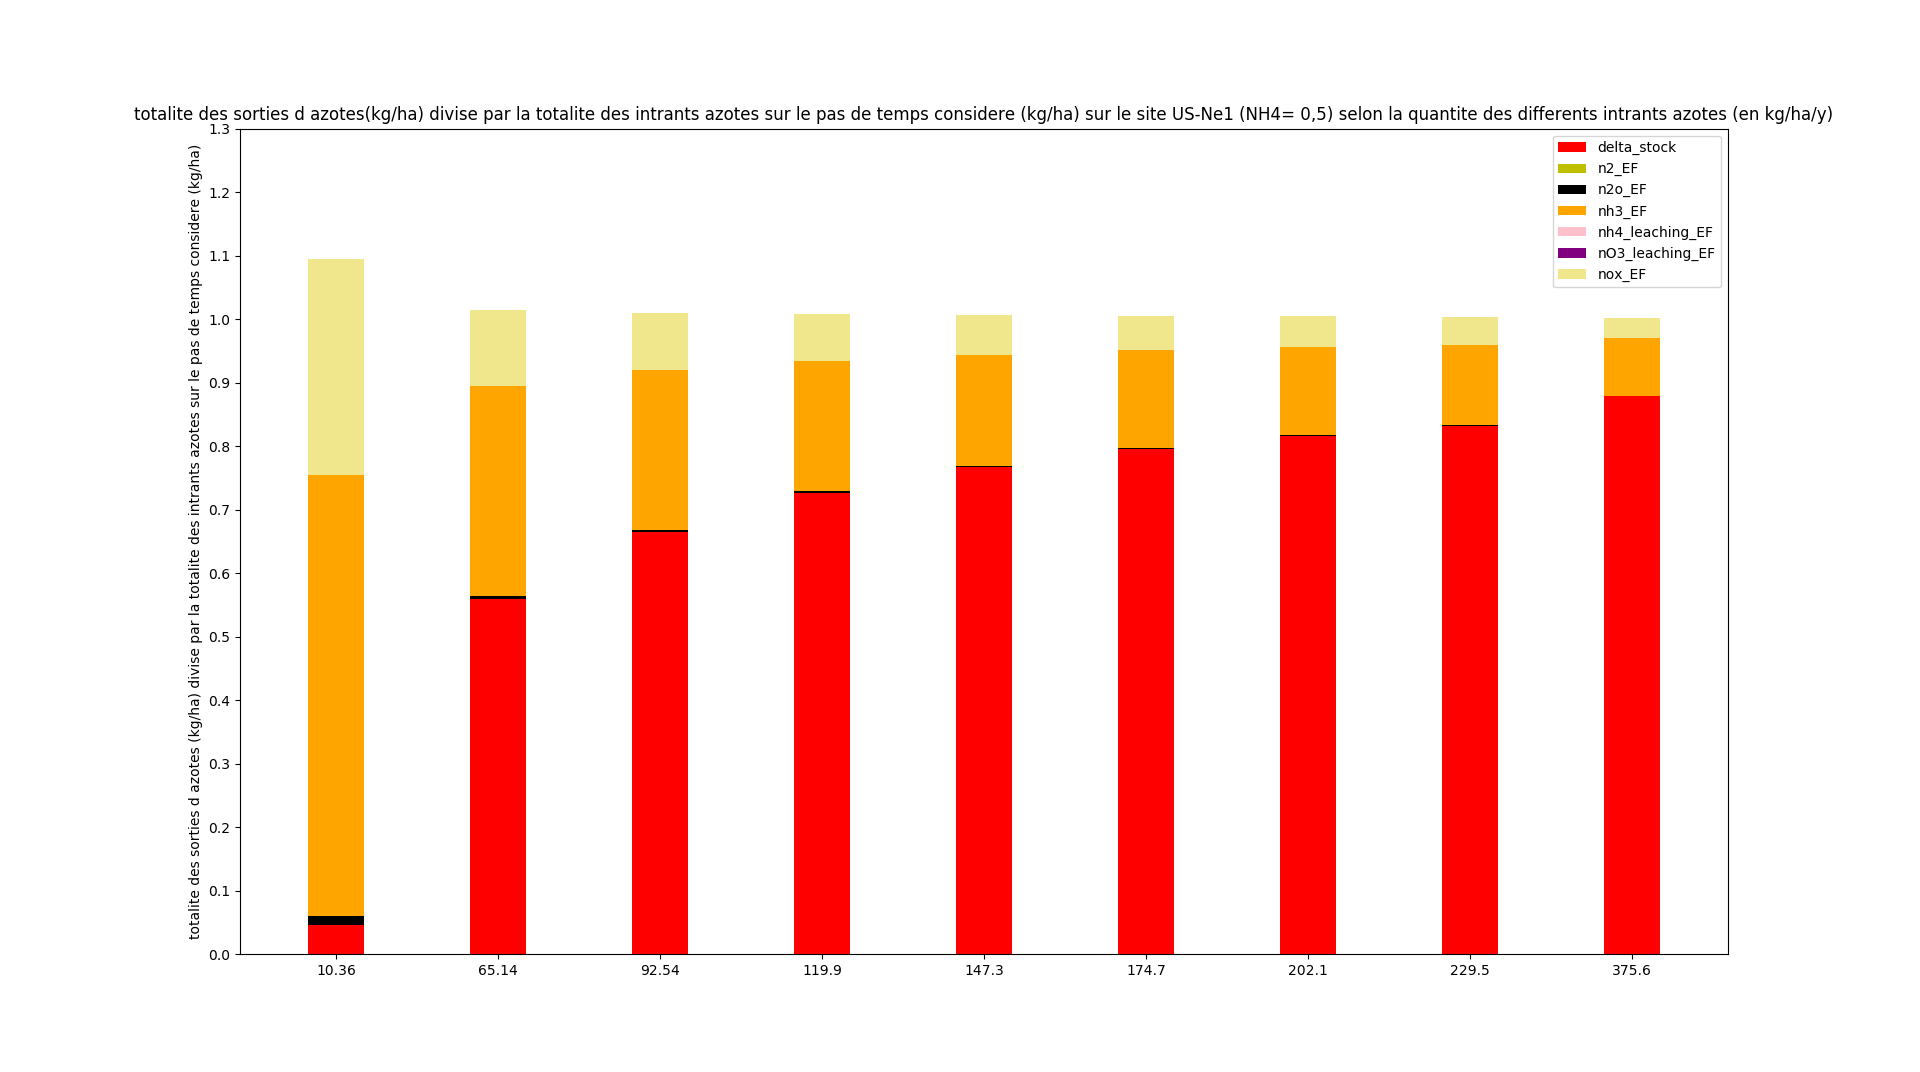
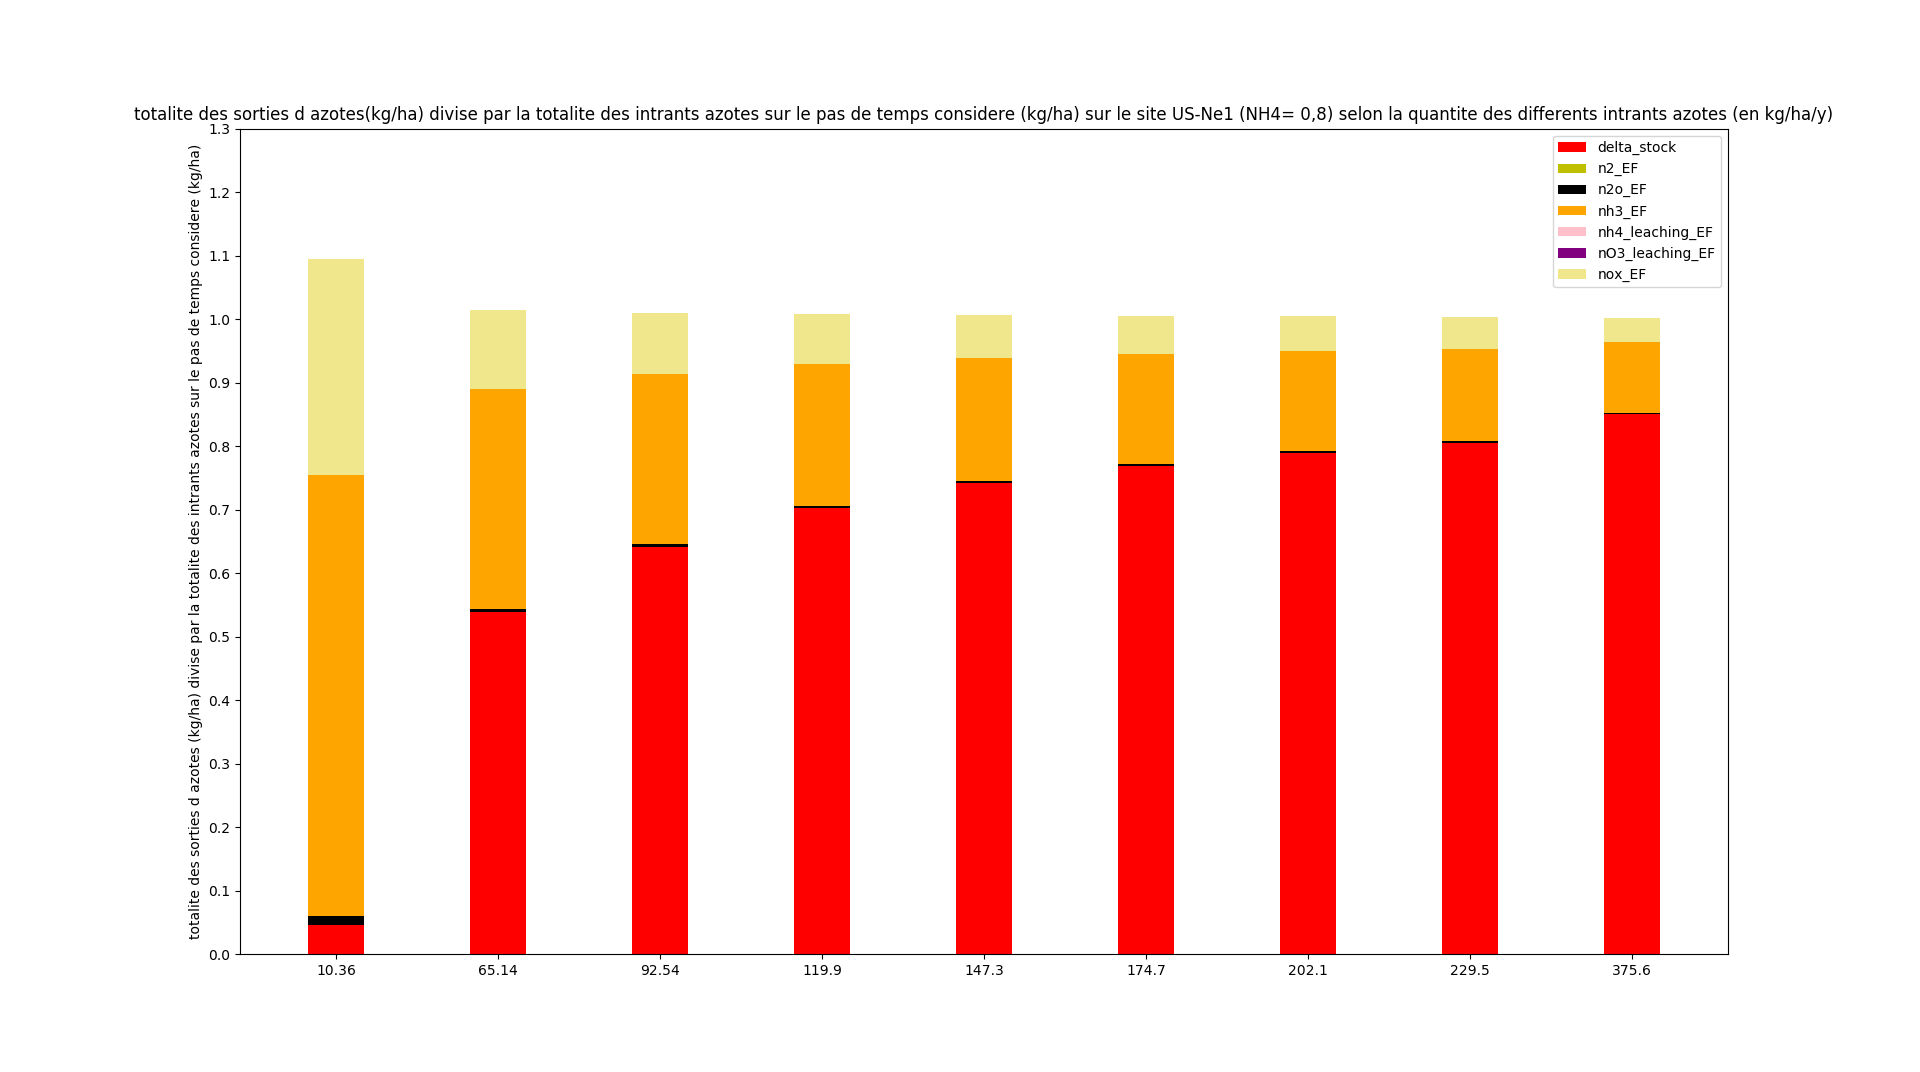
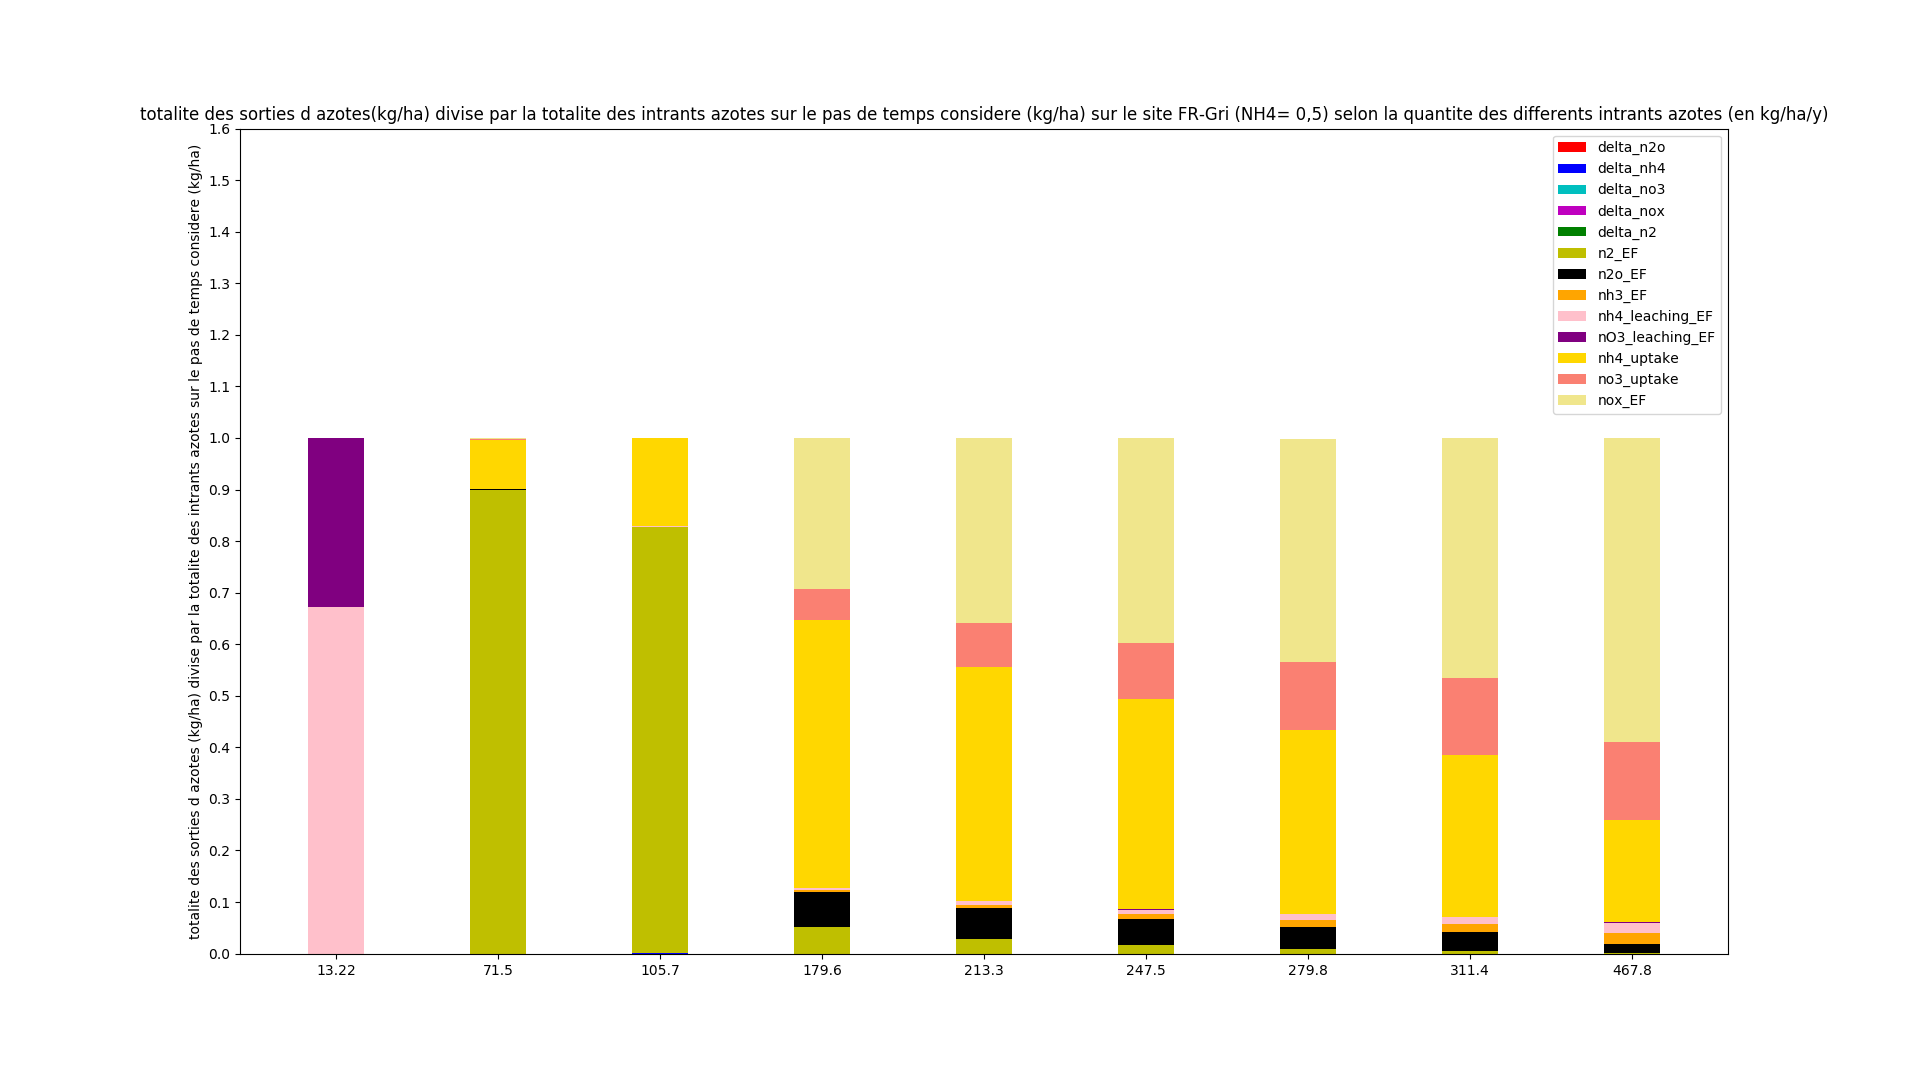
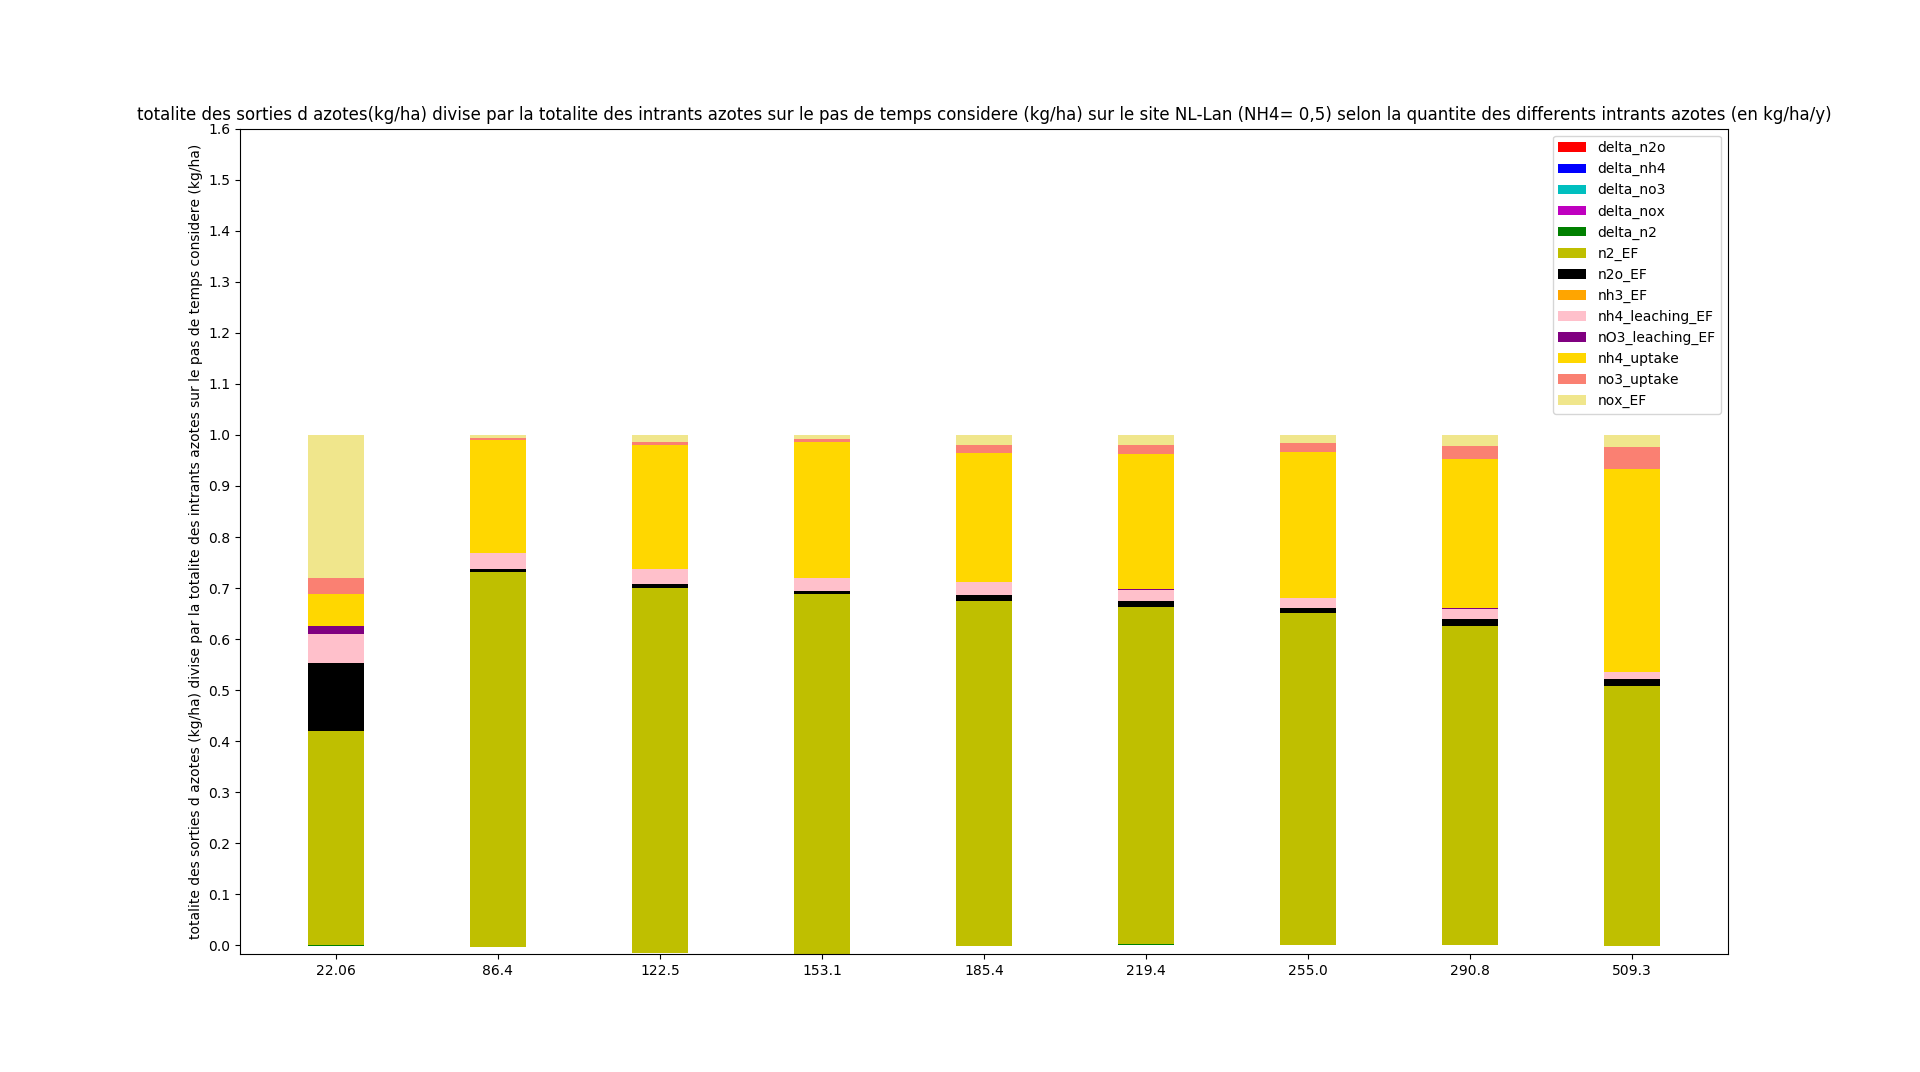
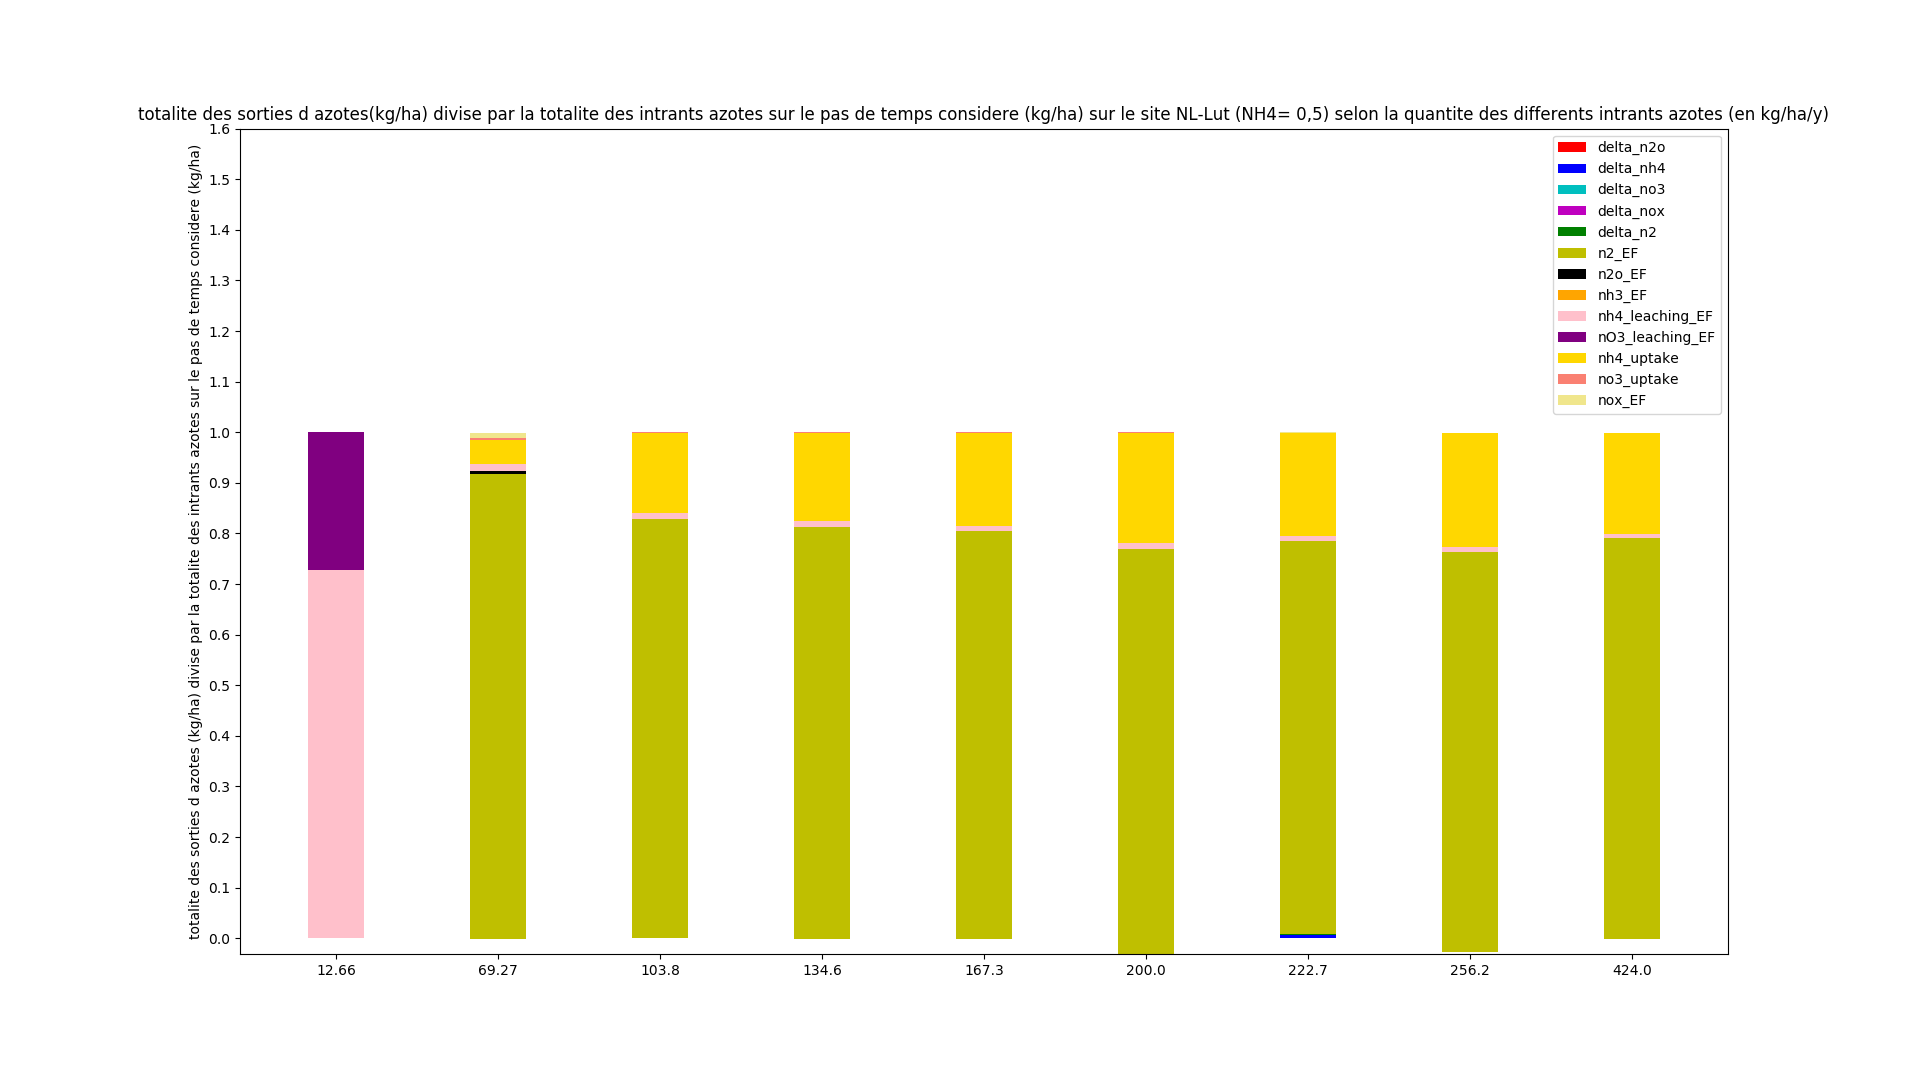
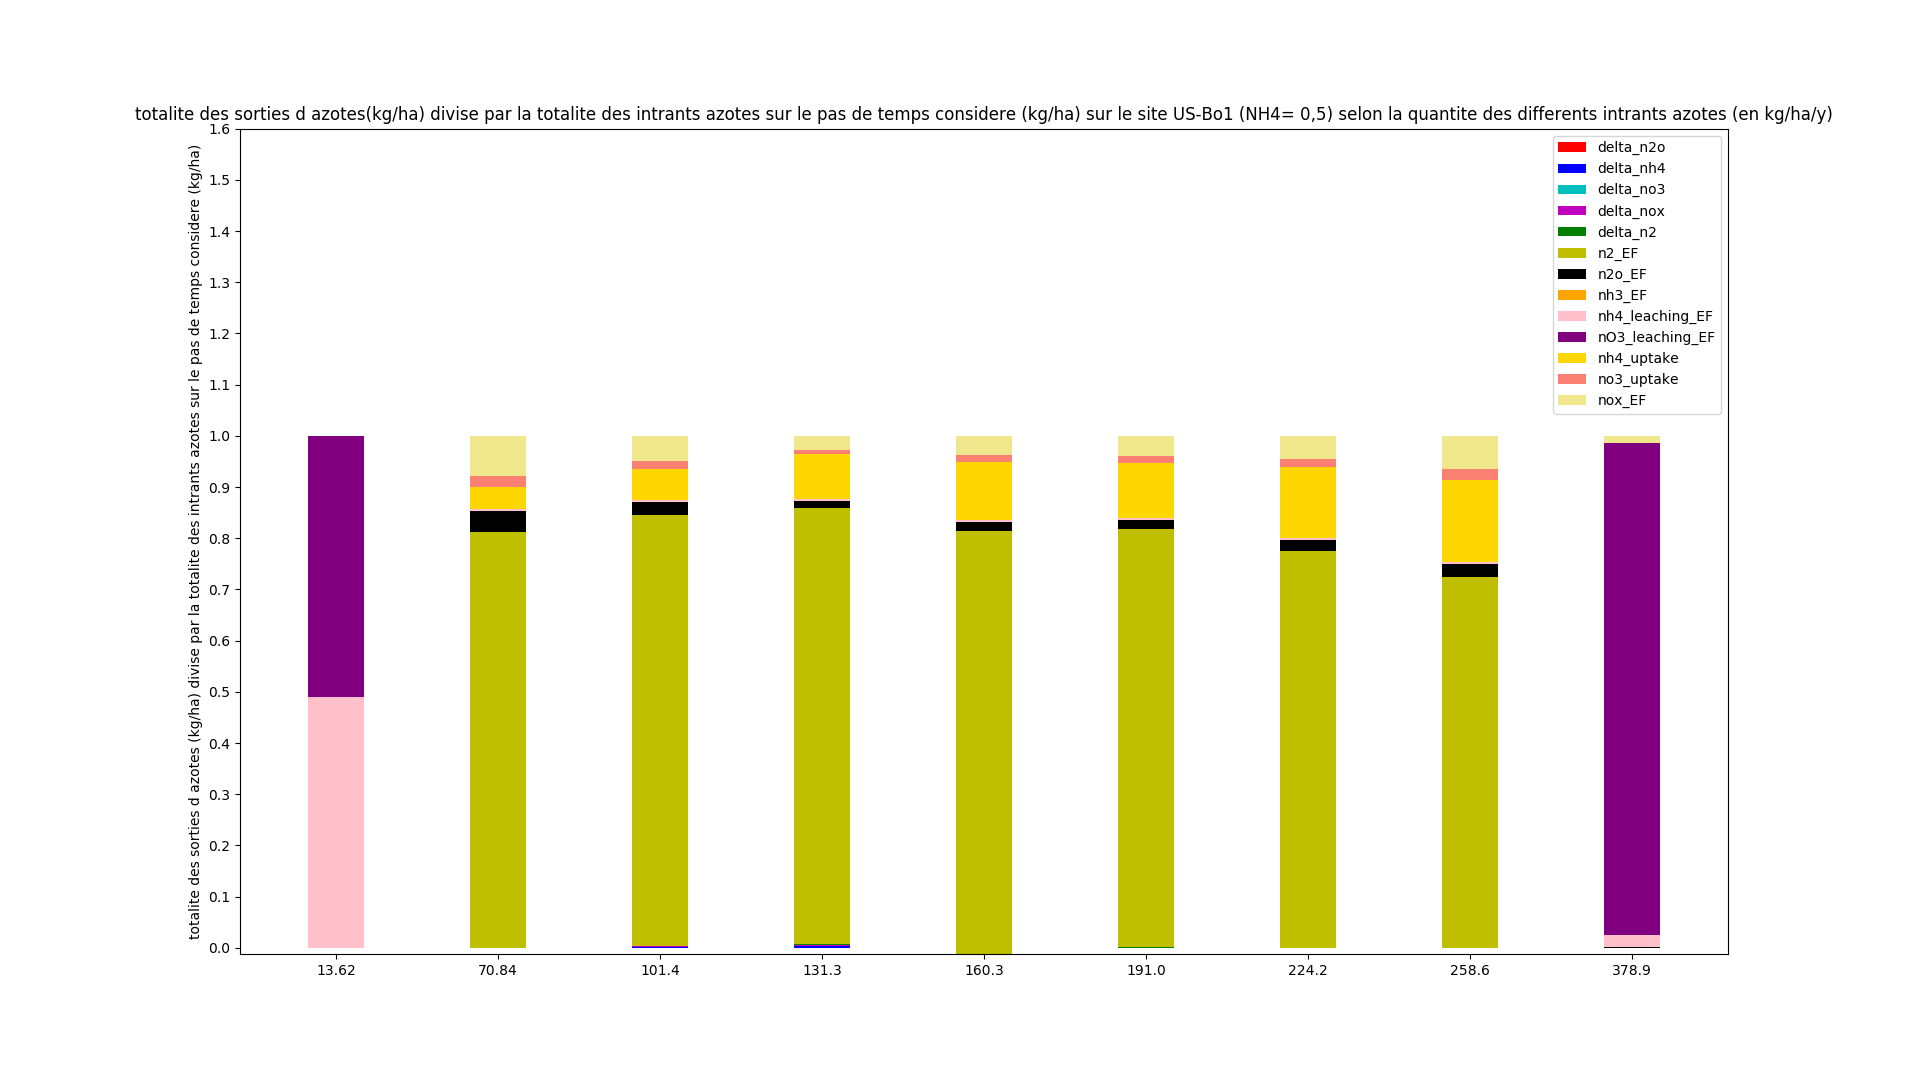
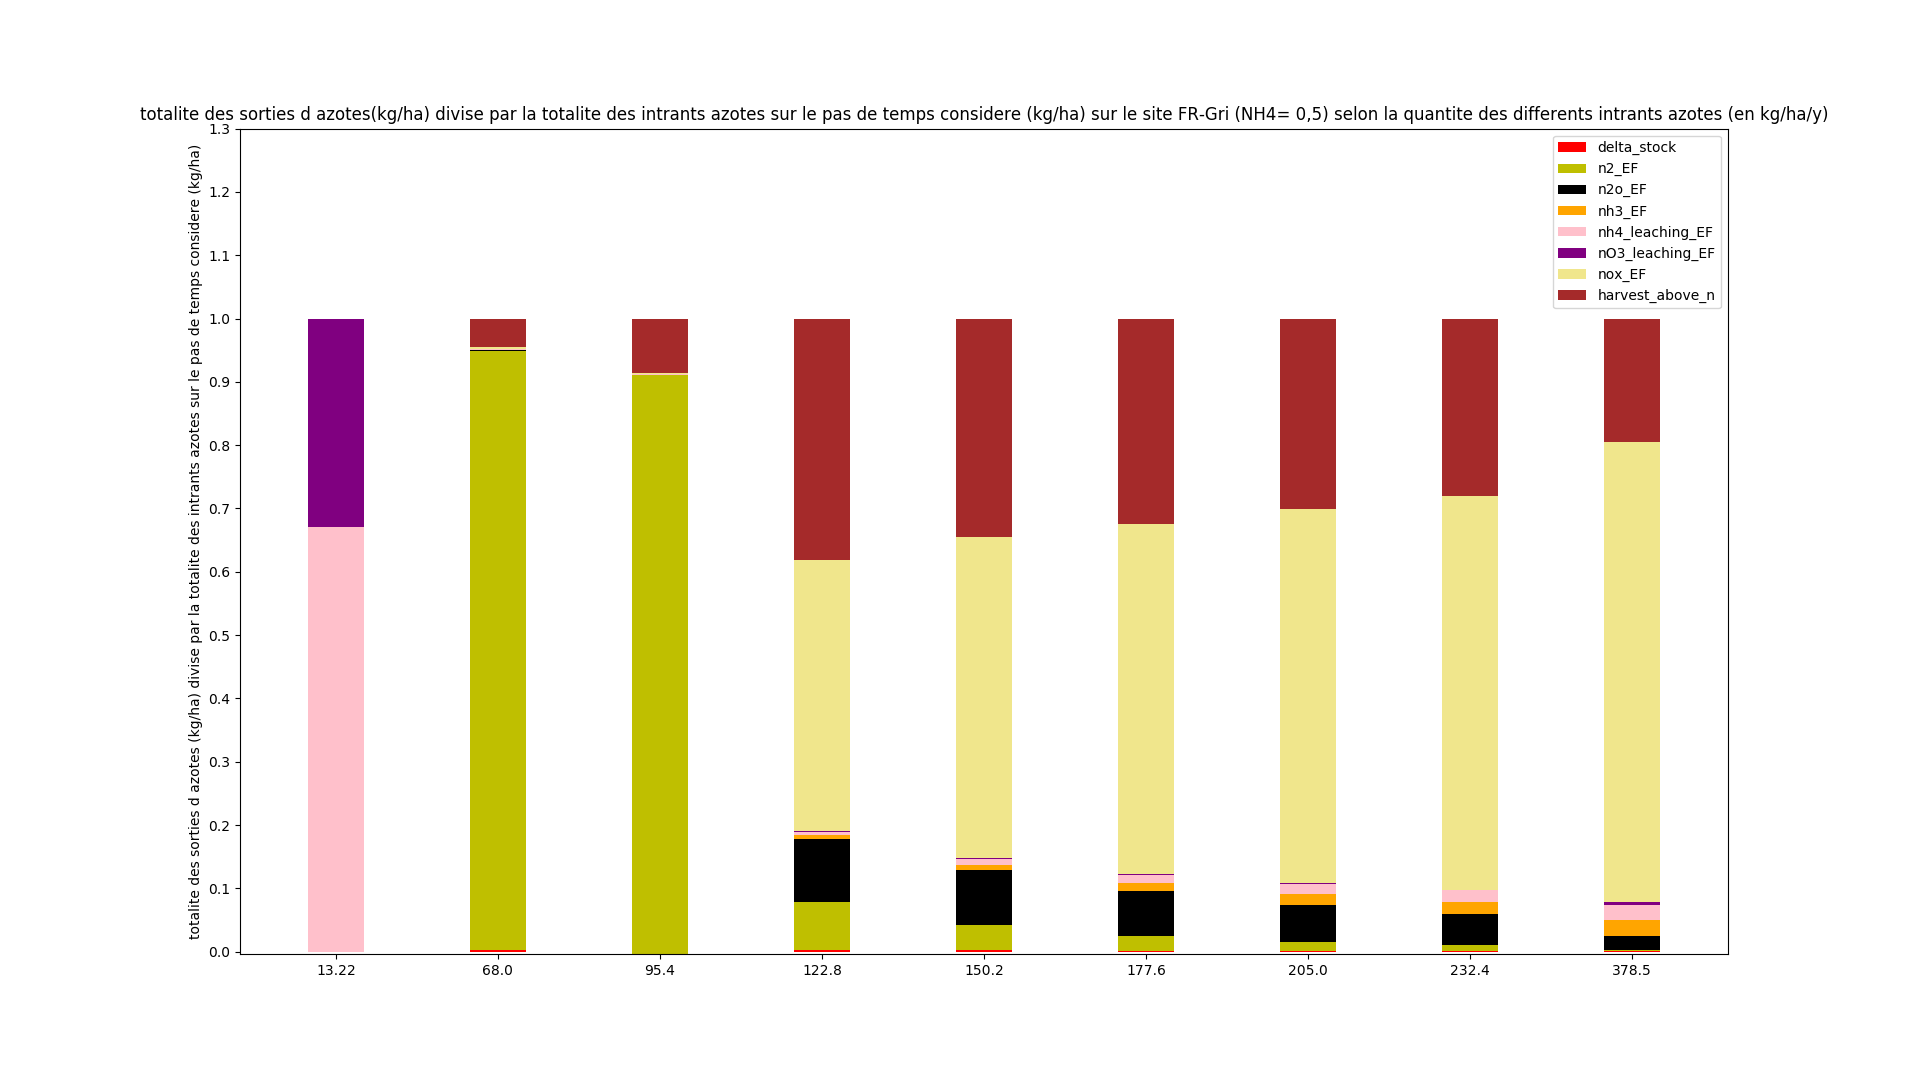
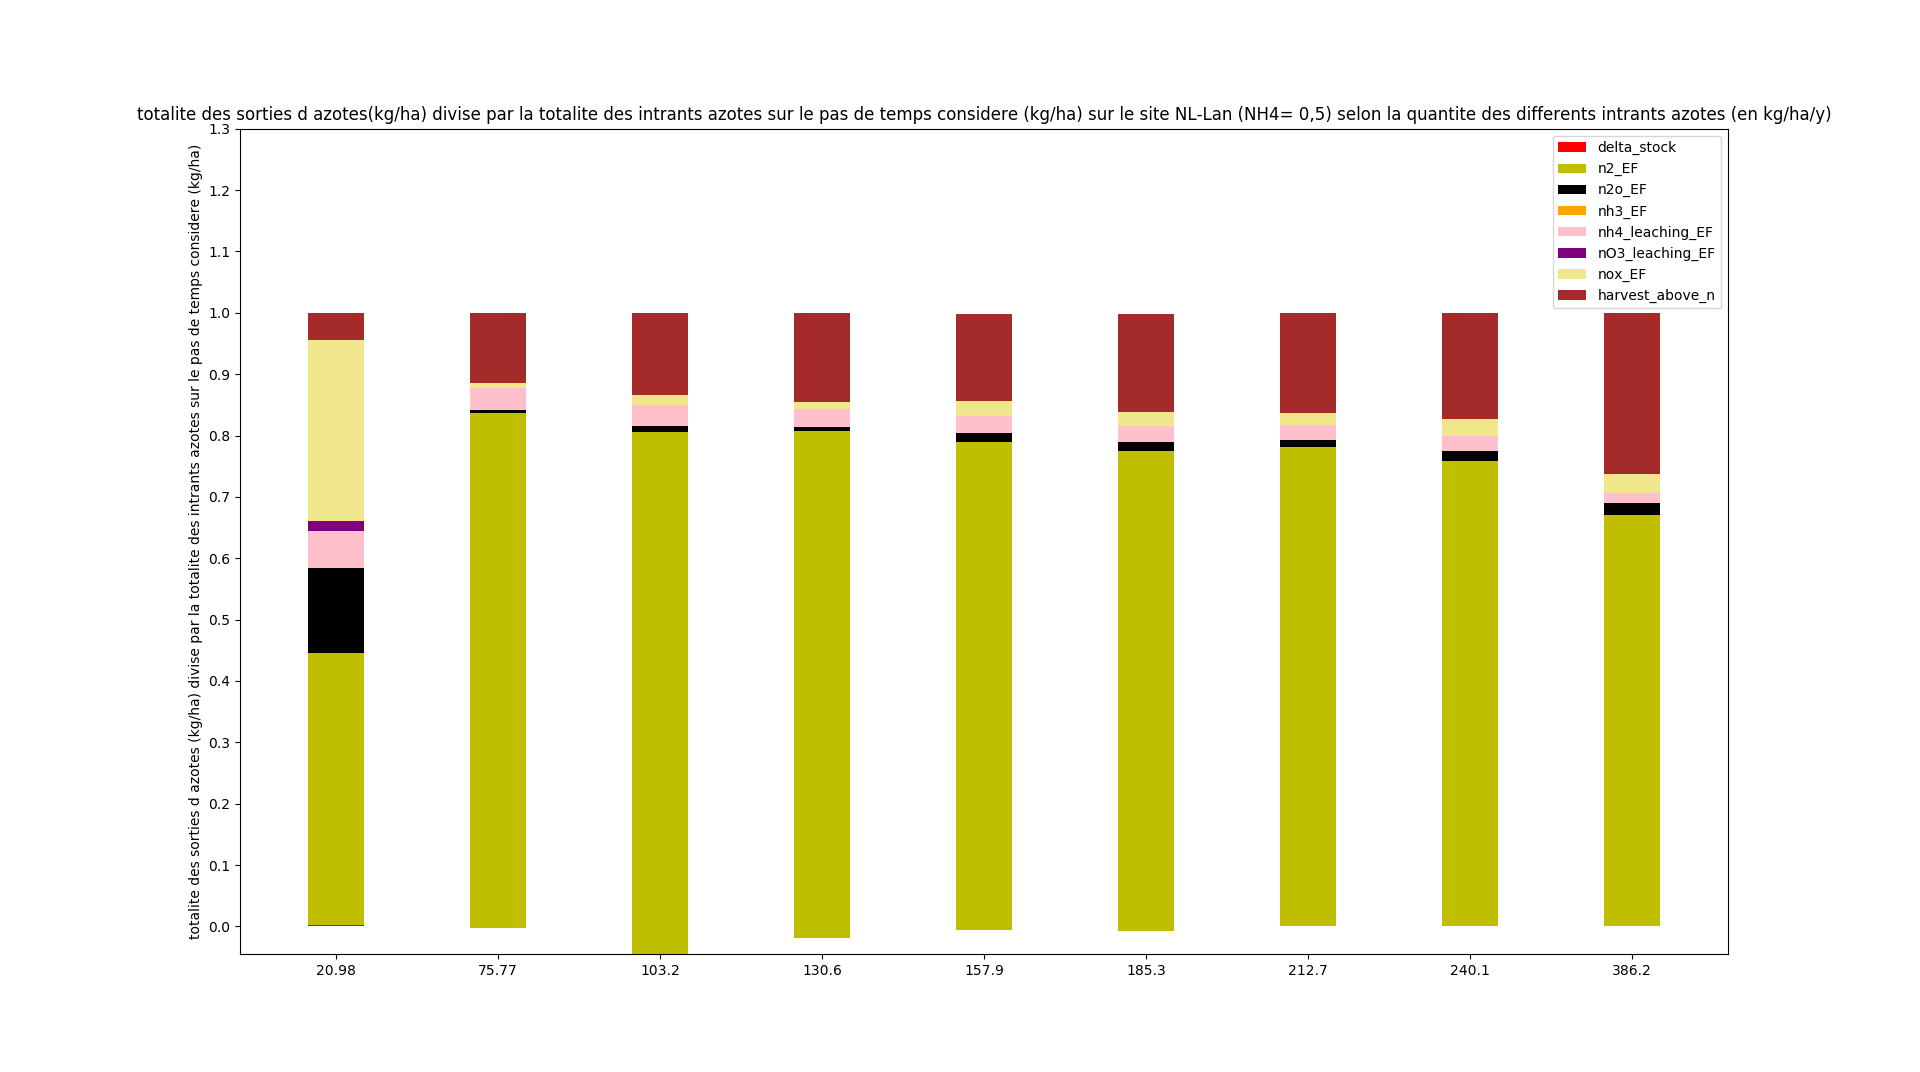
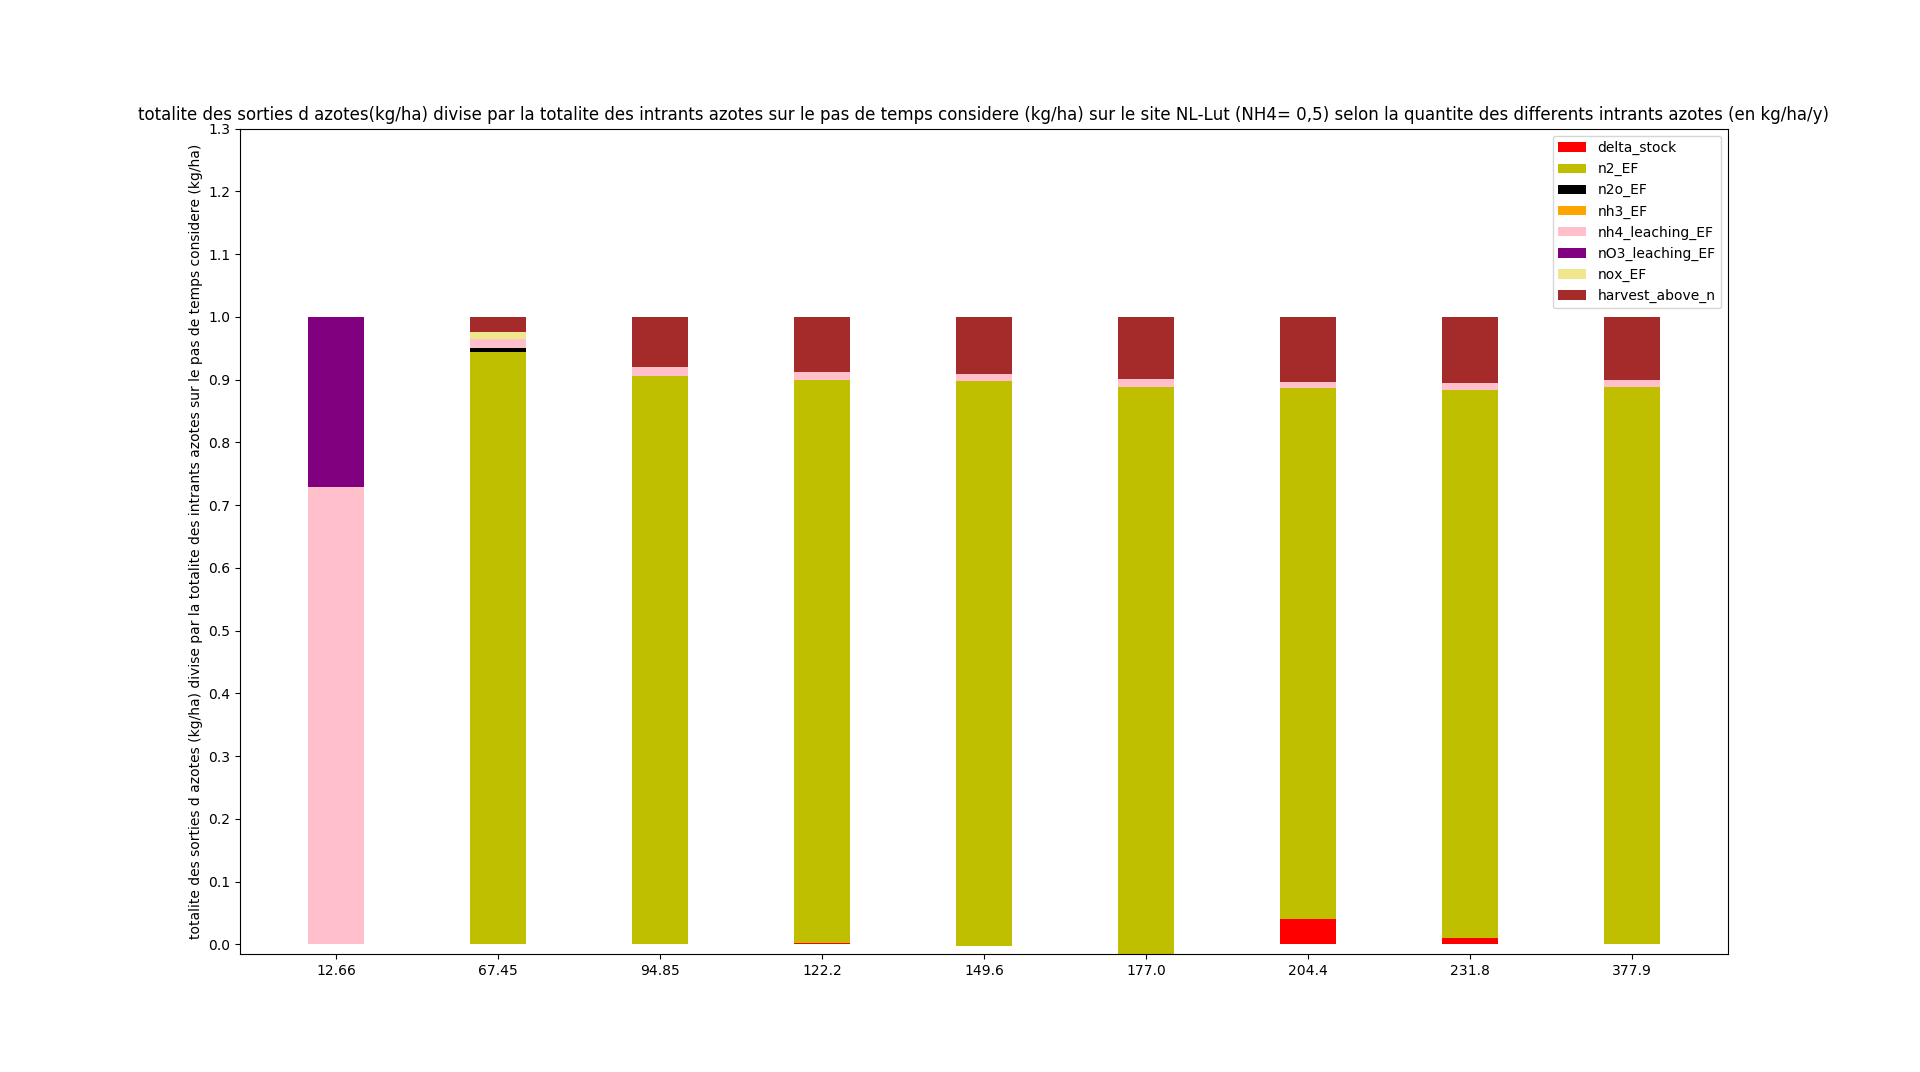
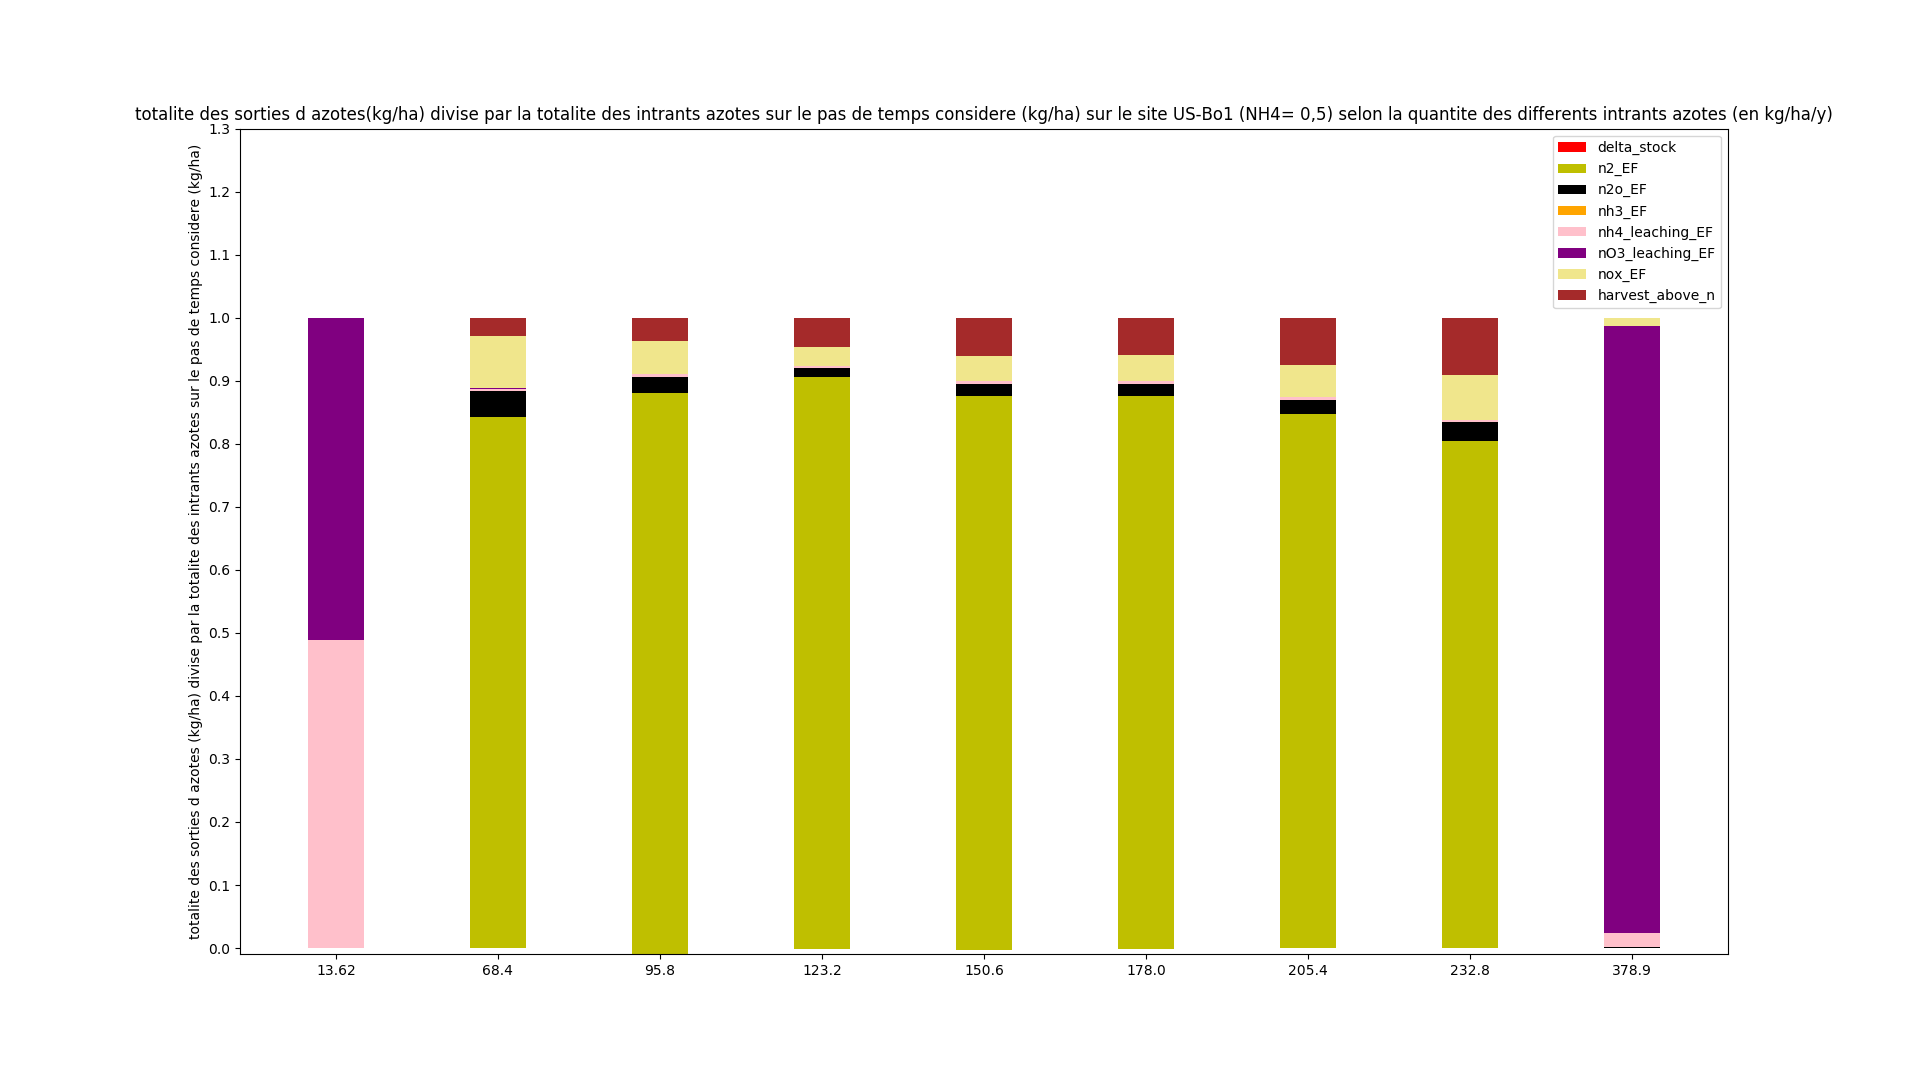
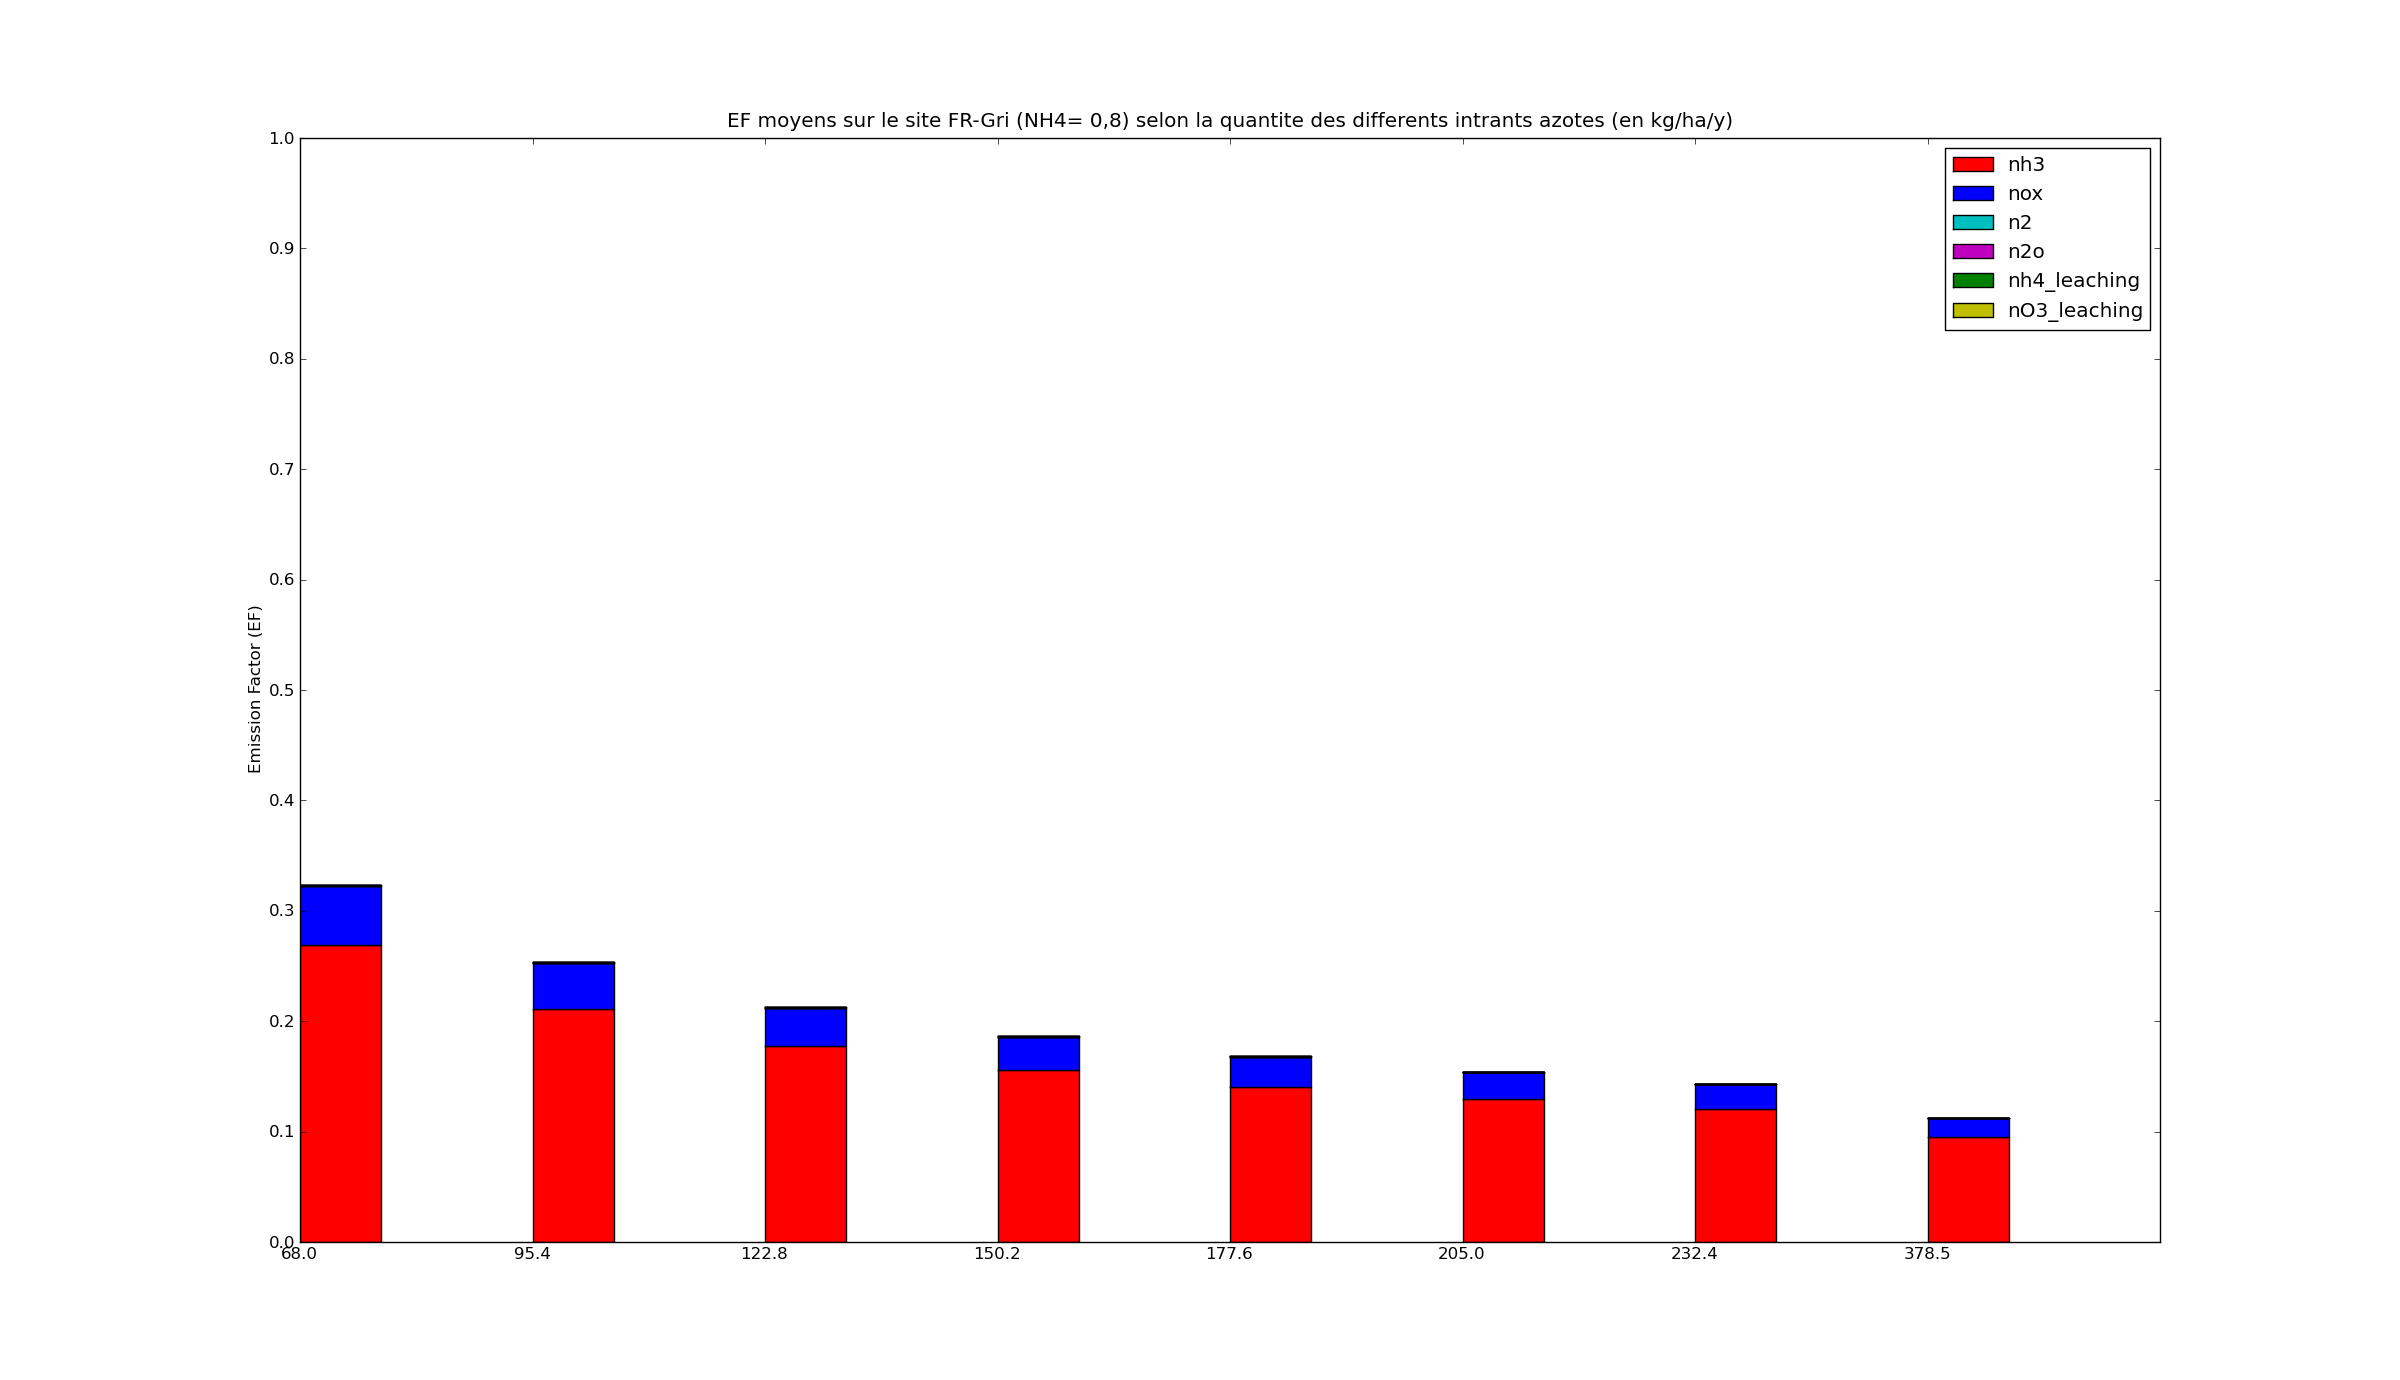
C. EF of each parameters on each site for NH4%=0.5 and 0.8 (method c)
path : /home/orchidee03/taudoux/documents/Results/B/EFc/
Python : barplot_c.py (arg1= Name of the site) using files.txt in which values of nitrogen emissions and leaching are listed in order to plot EF in function of nitrogen inputs (fertilizer, NHx and NOx depositions).
| DK-Ris
|
|---|
| 0.5 | 0.8
|
|---|
 | 
|
|---|
| FR-Gri
|
|---|
| 0.5 | 0.8
|
|---|
 | 
|
|---|
| NL-Lan
|
|---|
| 0.5 | 0.8
|
|---|
 | 
|
|---|
| NL-Lut
|
|---|
| 0.5 | 0.8
|
|---|
 | 
|
|---|
| US-Bo1
|
|---|
| 0.5 | 0.8
|
|---|
 | 
|
|---|
| US-Ne1
|
|---|
| 0.5 | 0.8
|
|---|
 | 
|
|---|
| US-Ne2
|
|---|
| 0.5 | 0.8
|
|---|
 | 
|
|---|
| US-Ne3
|
|---|
| 0.5 | 0.8
|
|---|
 | 
|
|---|
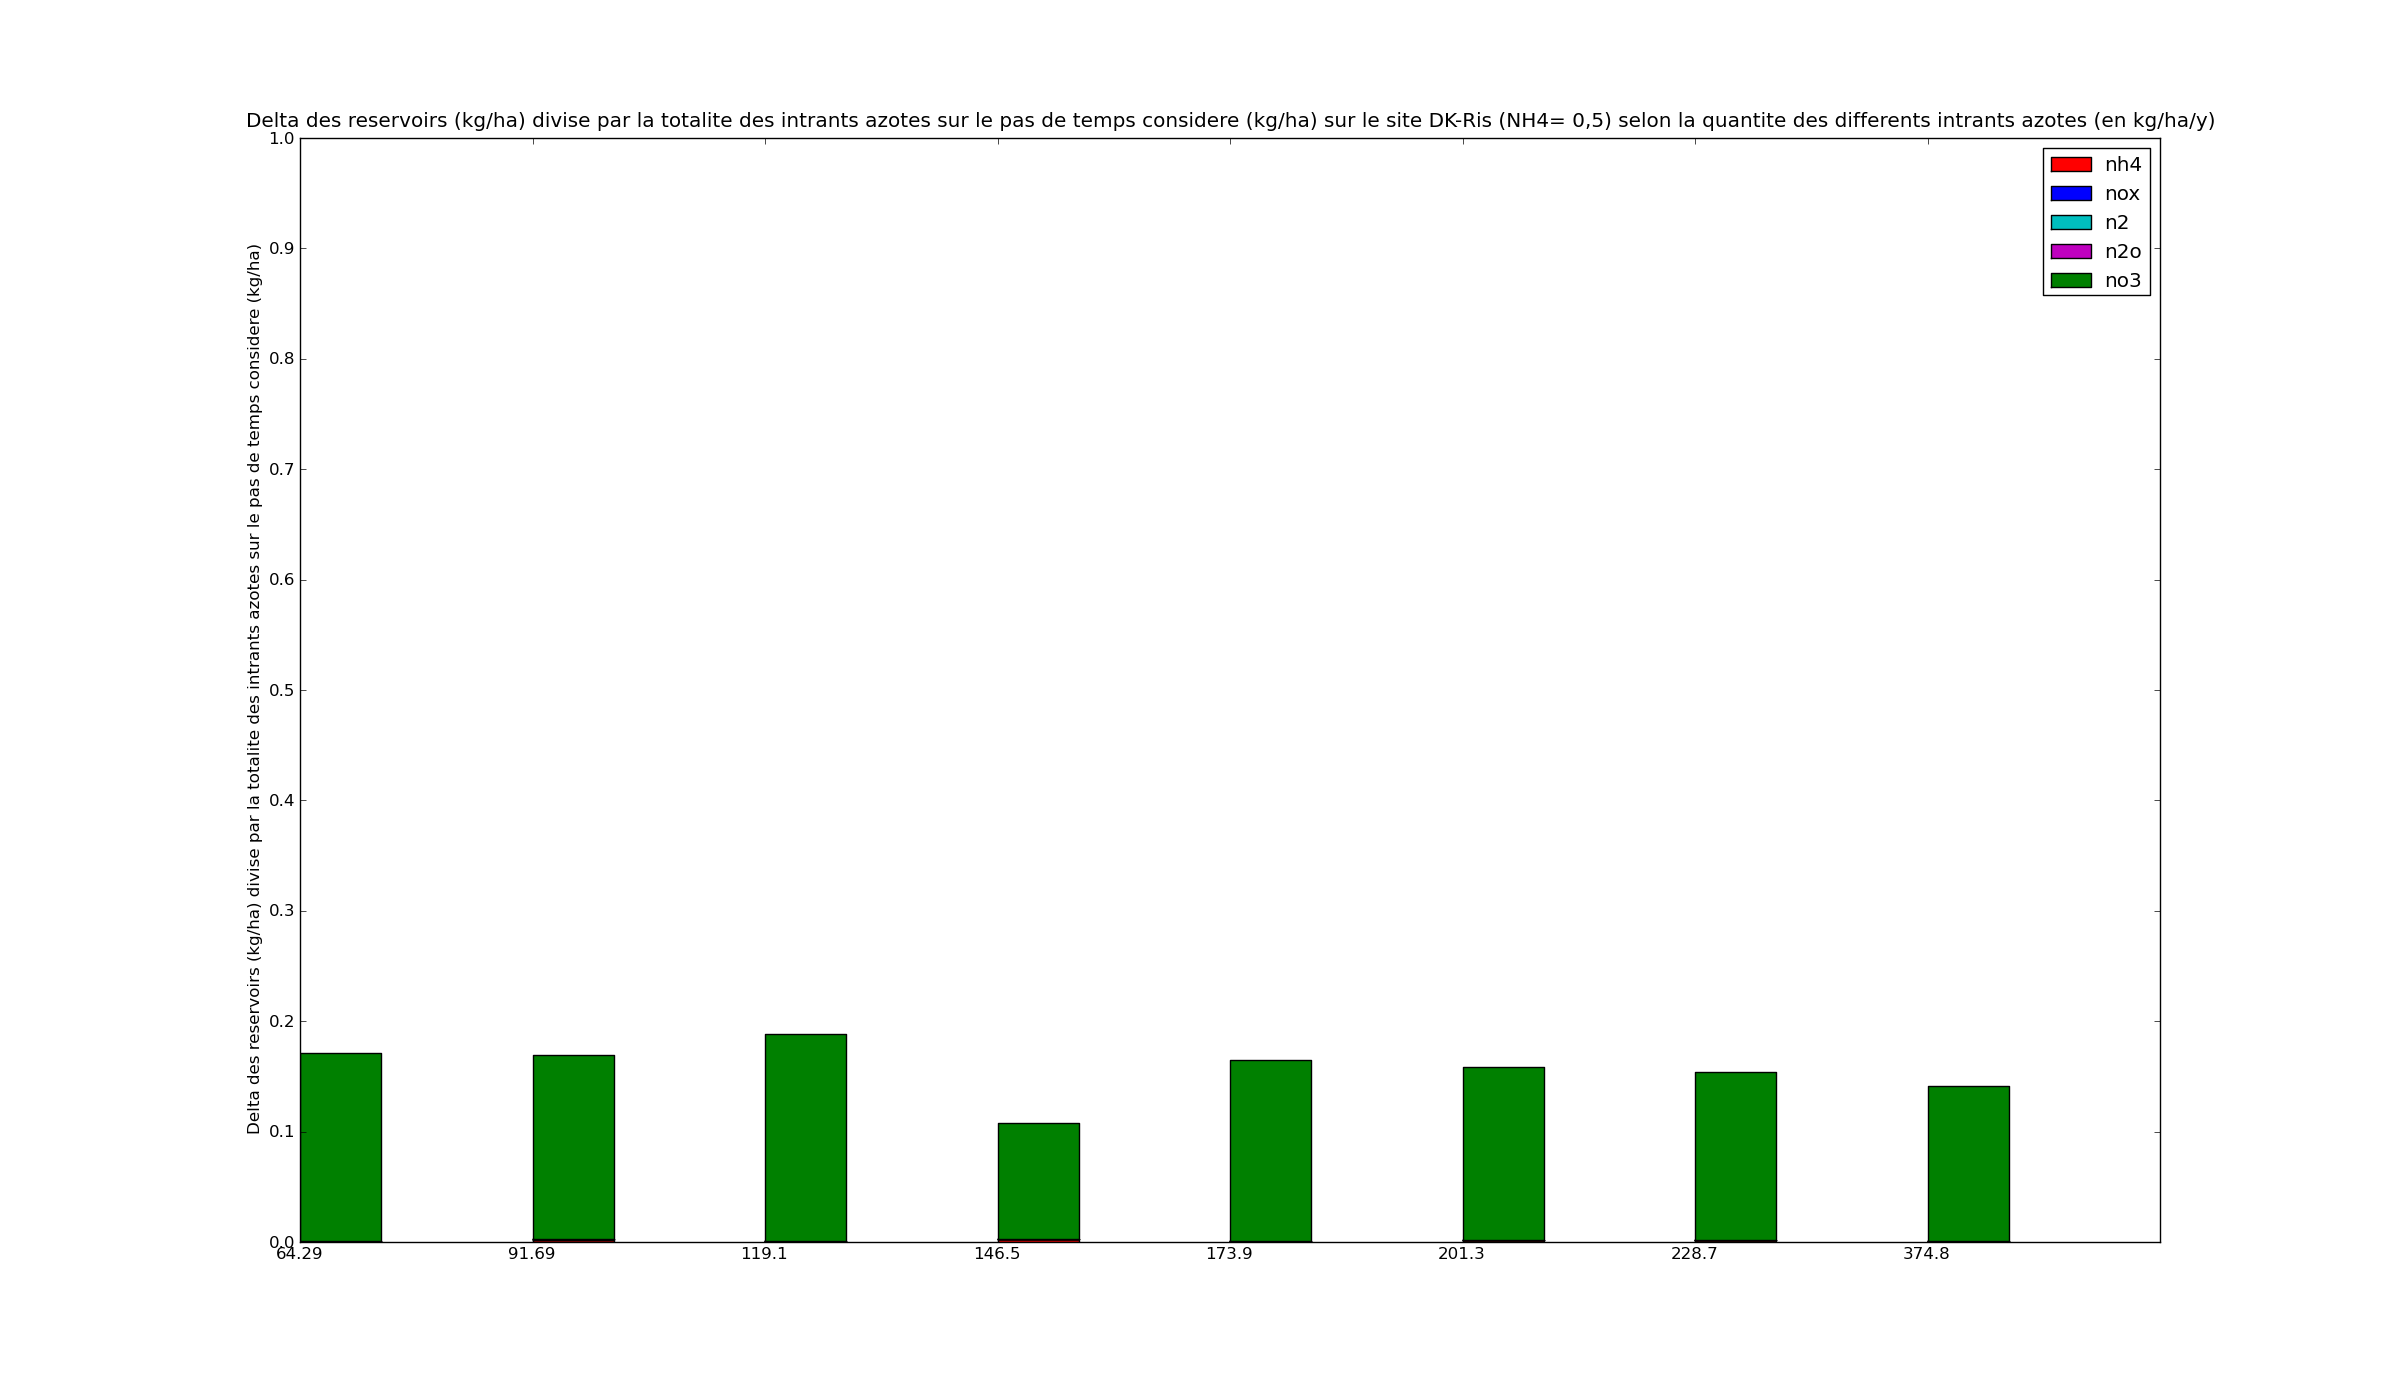
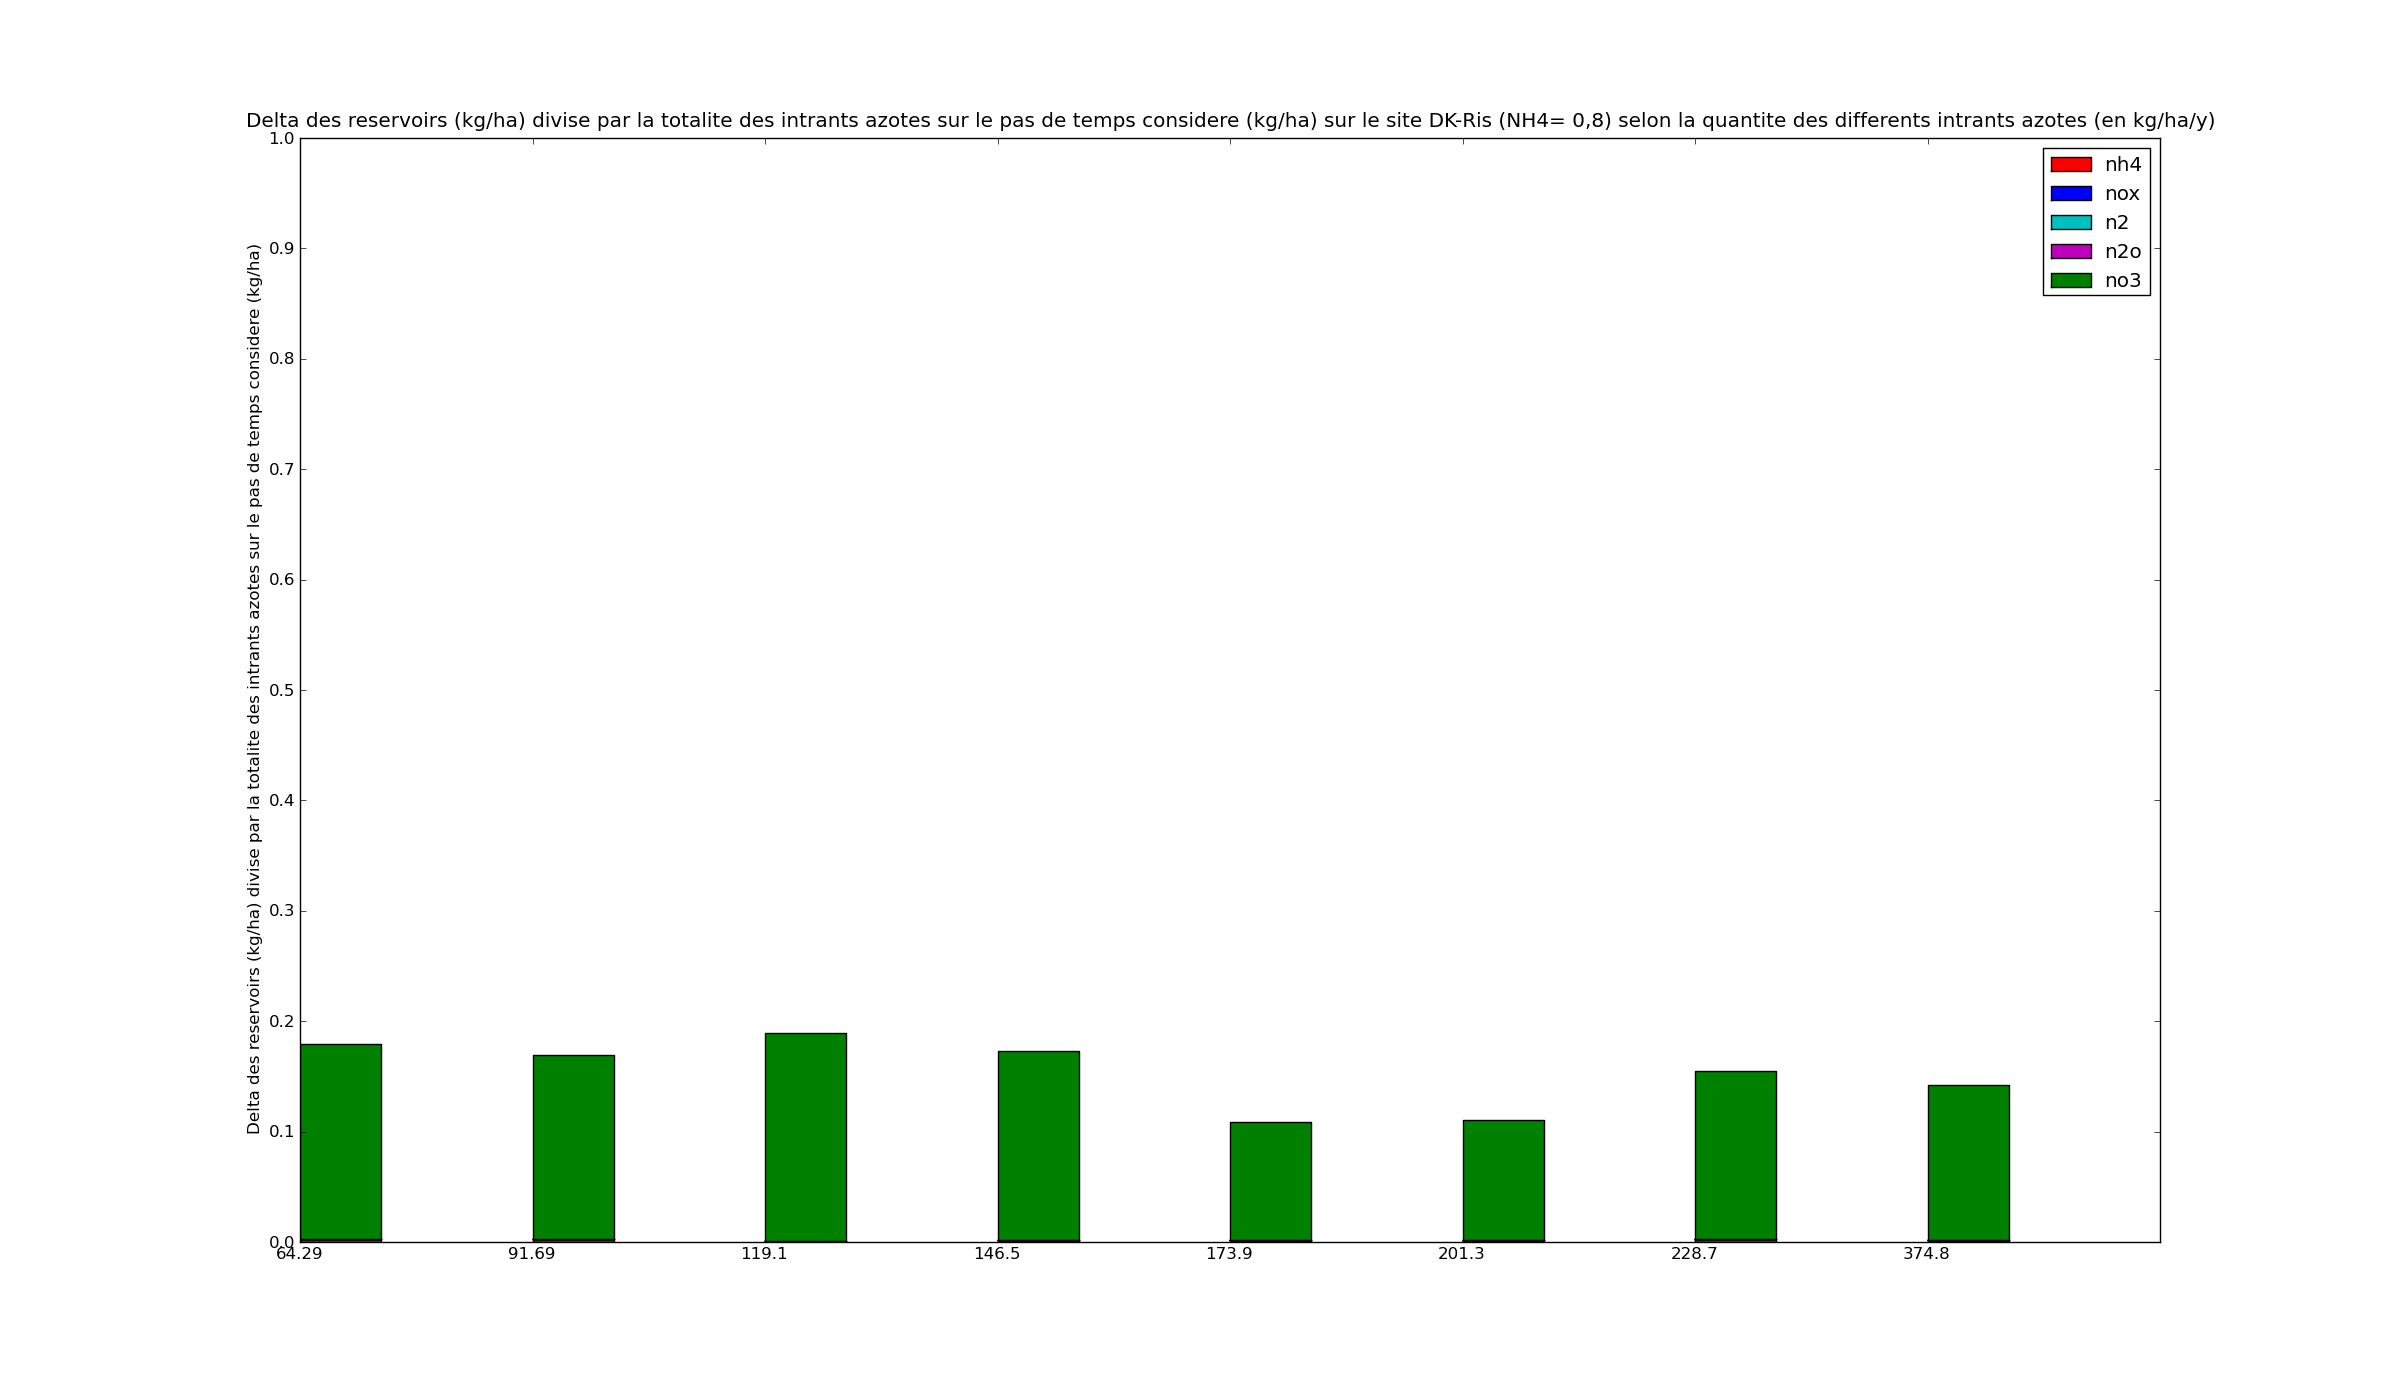
The sum of those EF is not equal to 1 for each site. So we looked at the difference between nitrogen pools (soil_nh4, soil_n2, soil_n2o, soil_no3 and soil_nox) at day1 and nitrogen pools on the last day.
path : /home/orchidee03/taudoux/documents/Results/B/EFd/
python : barplot_d.py arg1=name of the site
D. Evaluation of the model v1
| DK-Ris
|
|---|
| 0.5 | 0.8
|
|---|
 | 
|
|---|
| FR-Gri
|
|---|
| 0.5 | 0.8
|
|---|
 | 
|
|---|
| NL-Lan
|
|---|
| 0.5 | 0.8
|
|---|
 | 
|
|---|
| NL-Lut
|
|---|
| 0.5 | 0.8
|
|---|
 | 
|
|---|
| US-Bo1
|
|---|
| 0.5 | 0.8
|
|---|
 | 
|
|---|
| US-Ne1
|
|---|
| 0.5 | 0.8
|
|---|
 | 
|
|---|
| US-Ne2
|
|---|
| 0.5 | 0.8
|
|---|
 | 
|
|---|
| US-Ne3
|
|---|
| 0.5 | 0.8
|
|---|
 | 
|
|---|
This is just for the record on how we arrived at taking this decision for the analysis, this is included in the next part.
The values we found seem to be a little odd... So, in order to know if they are exploitable, we looked at the closure of different model components :
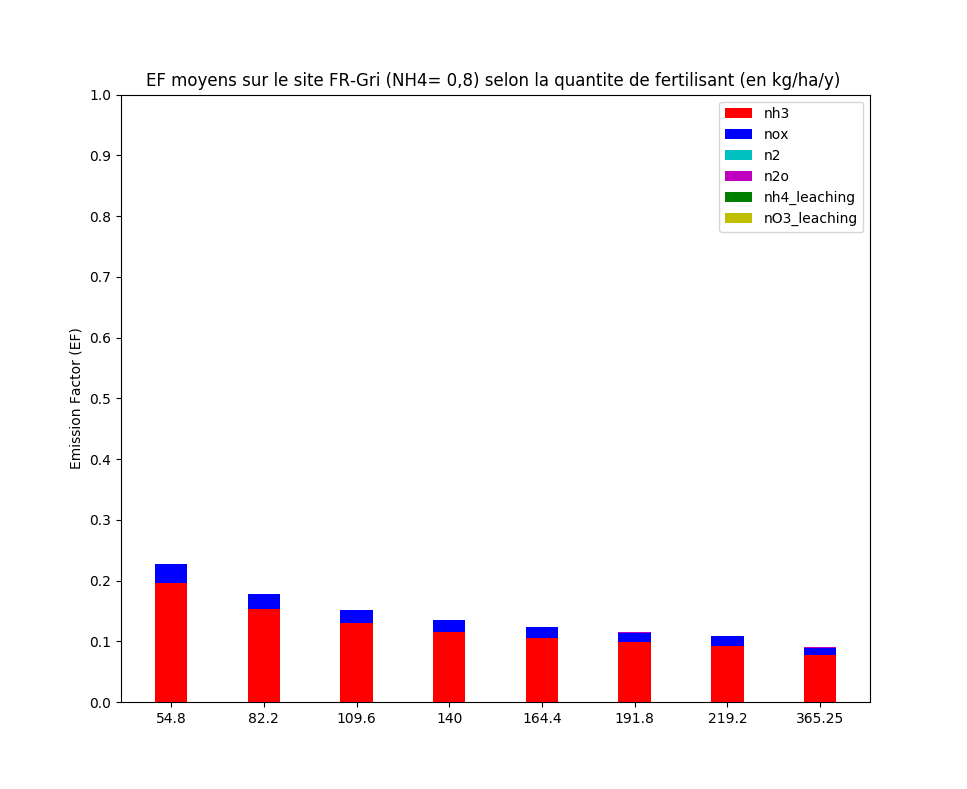
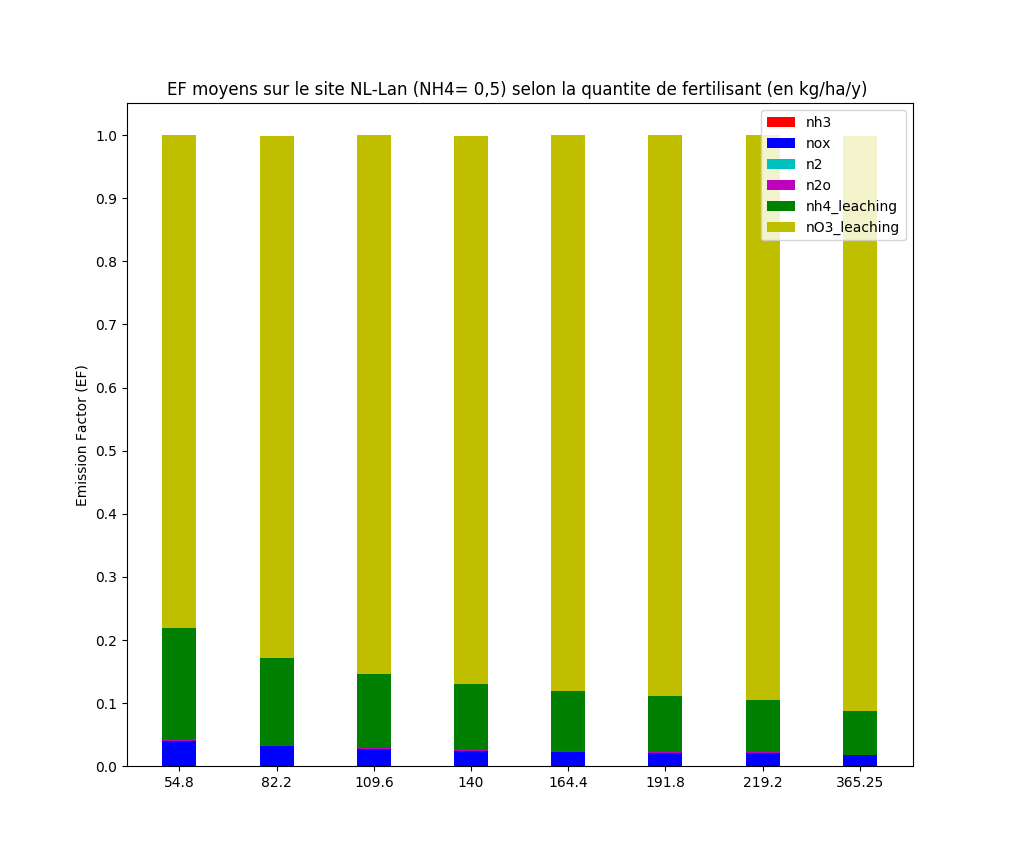
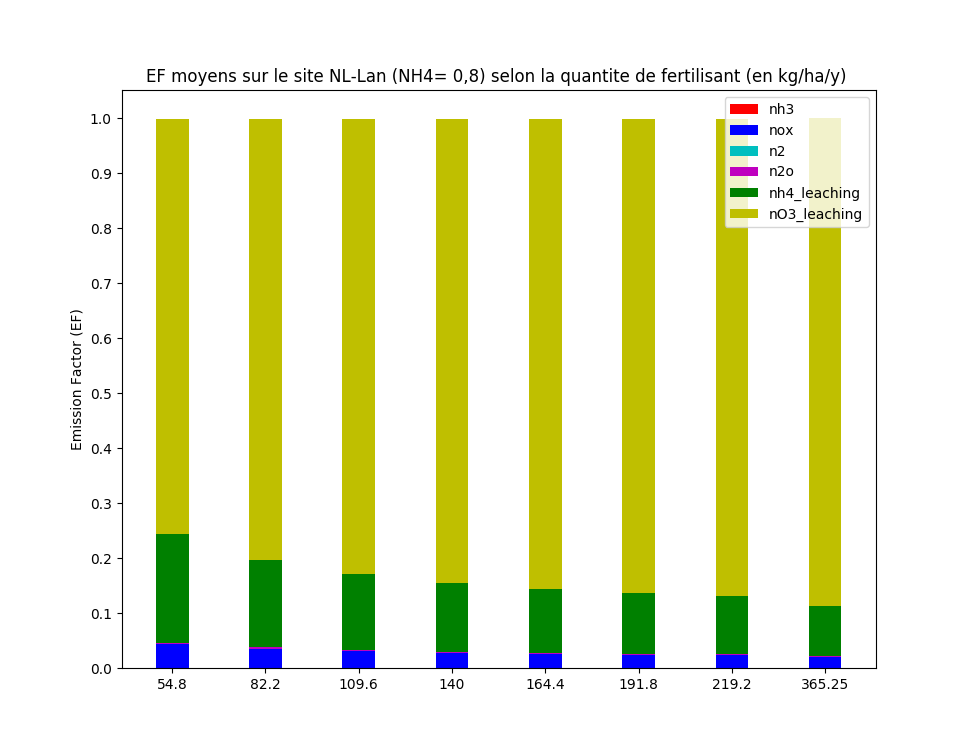
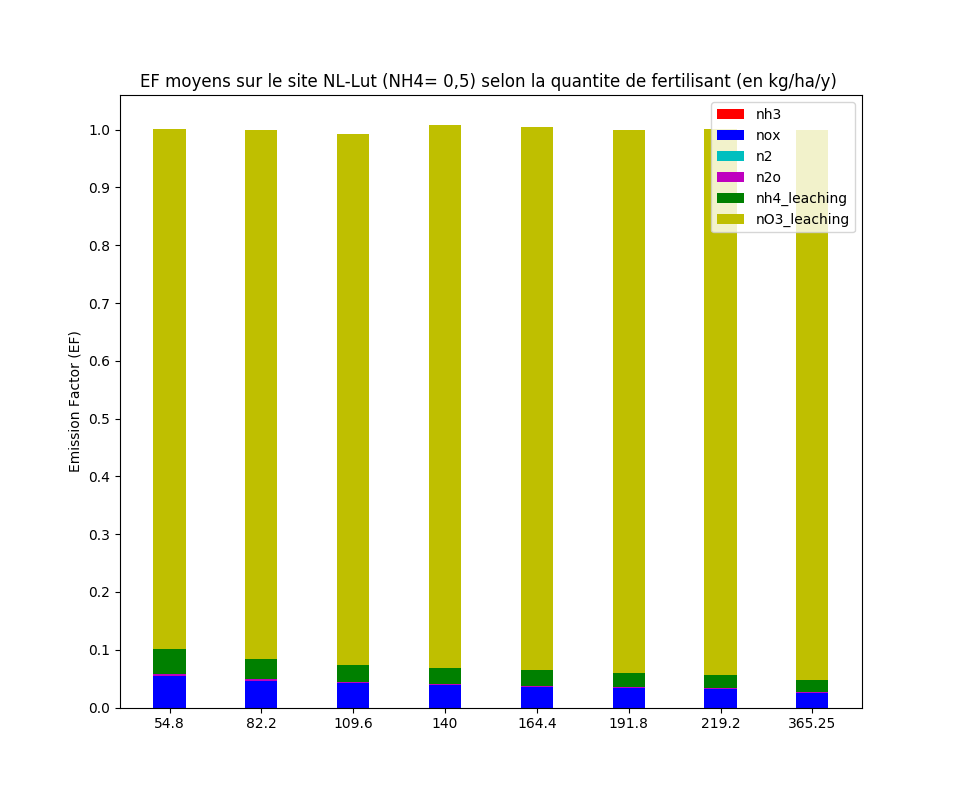
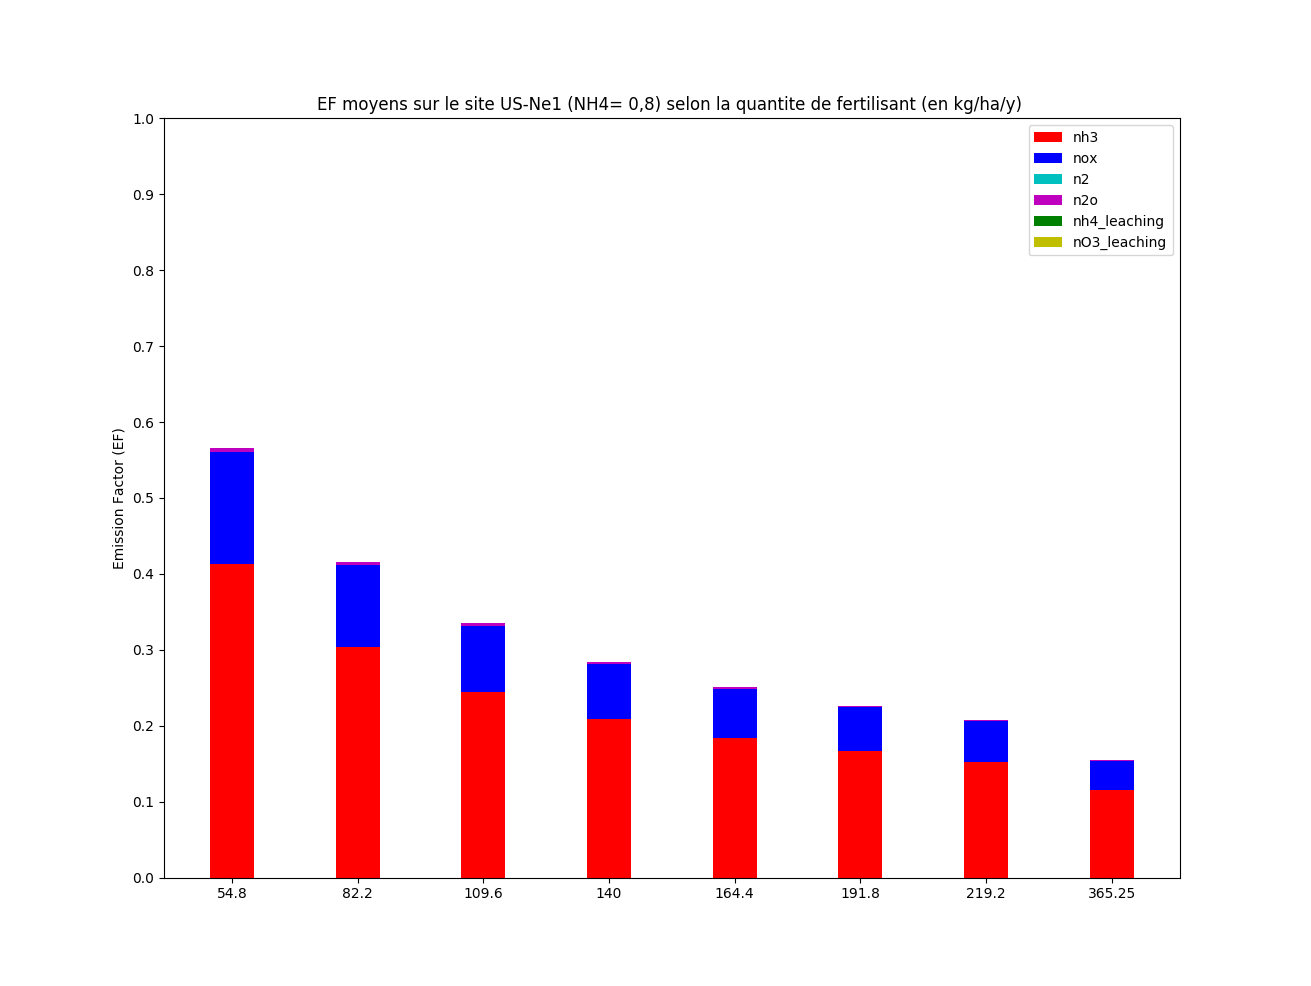
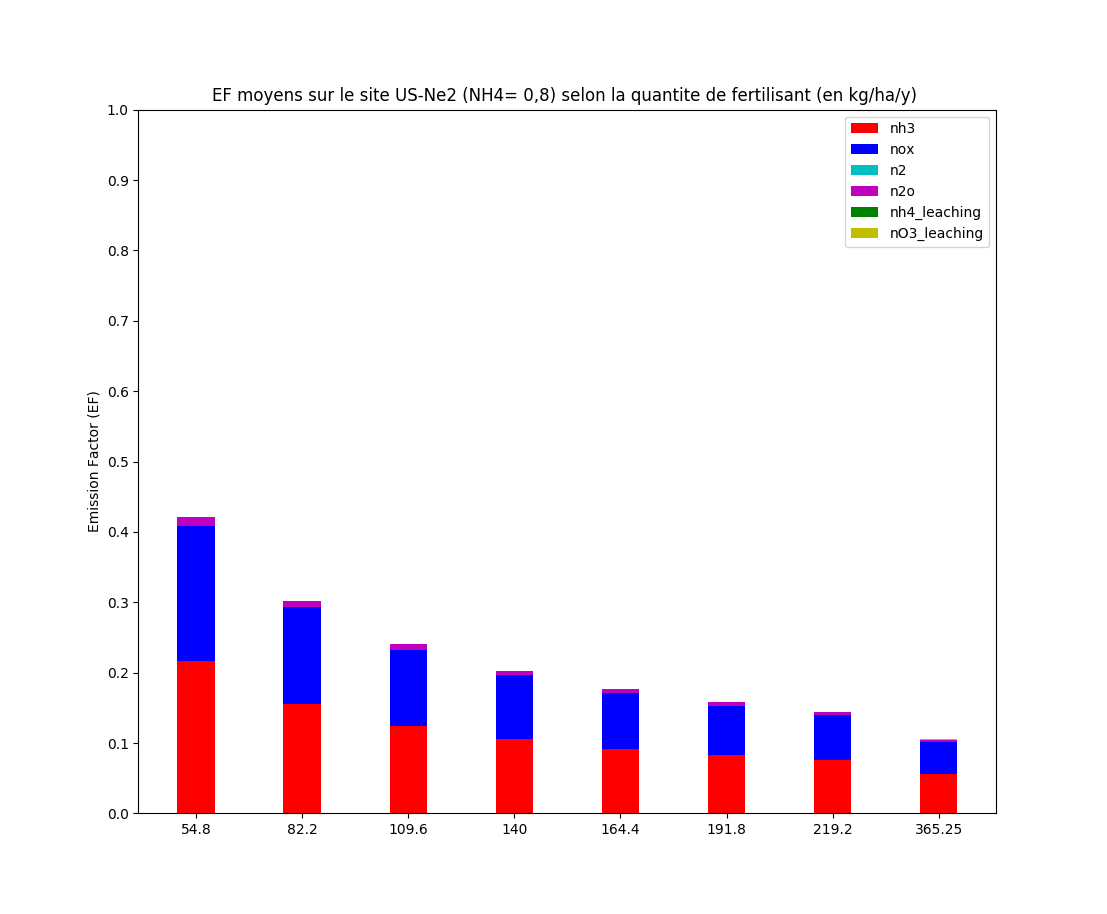
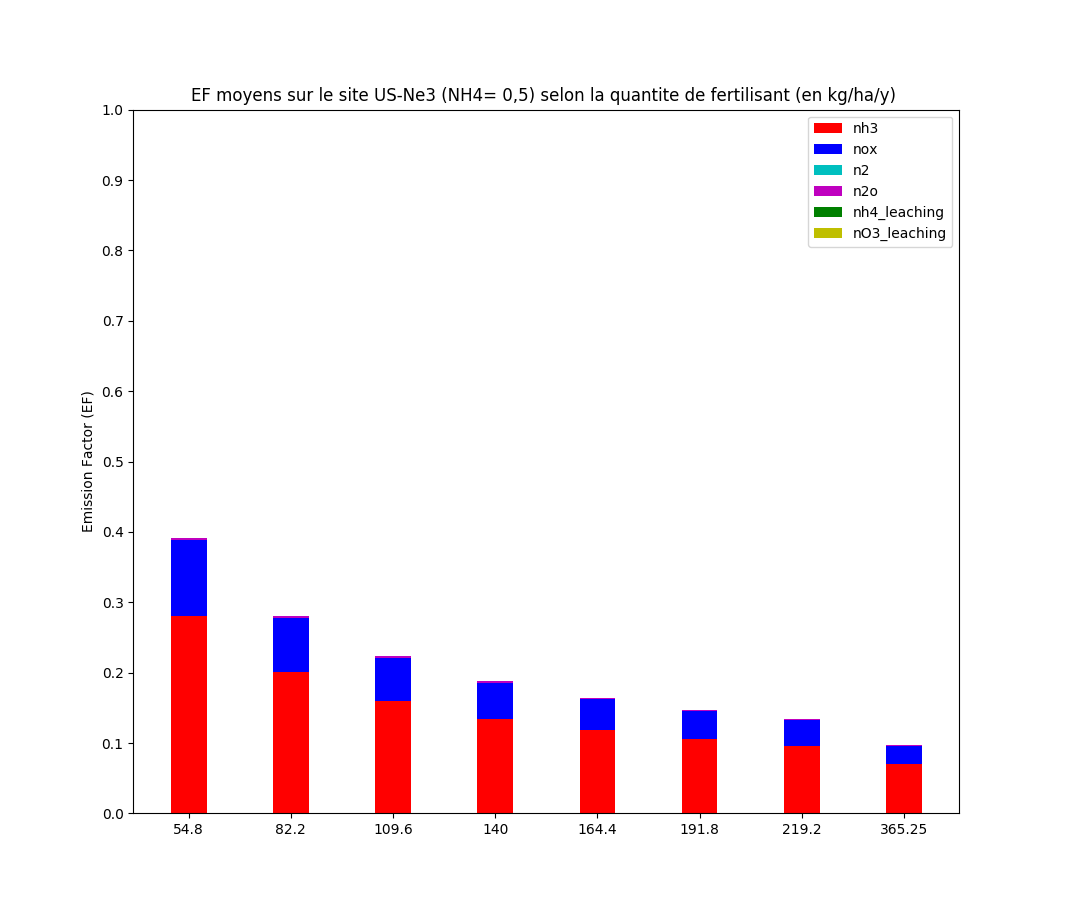
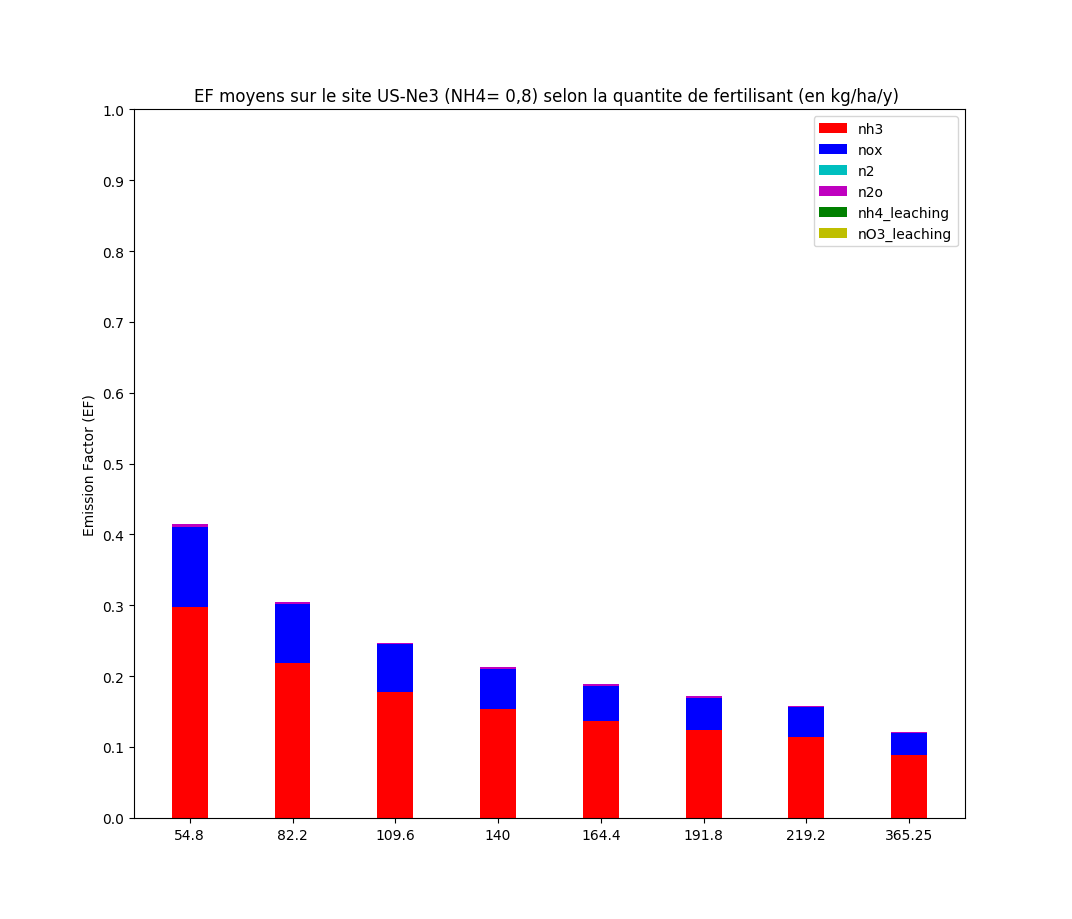
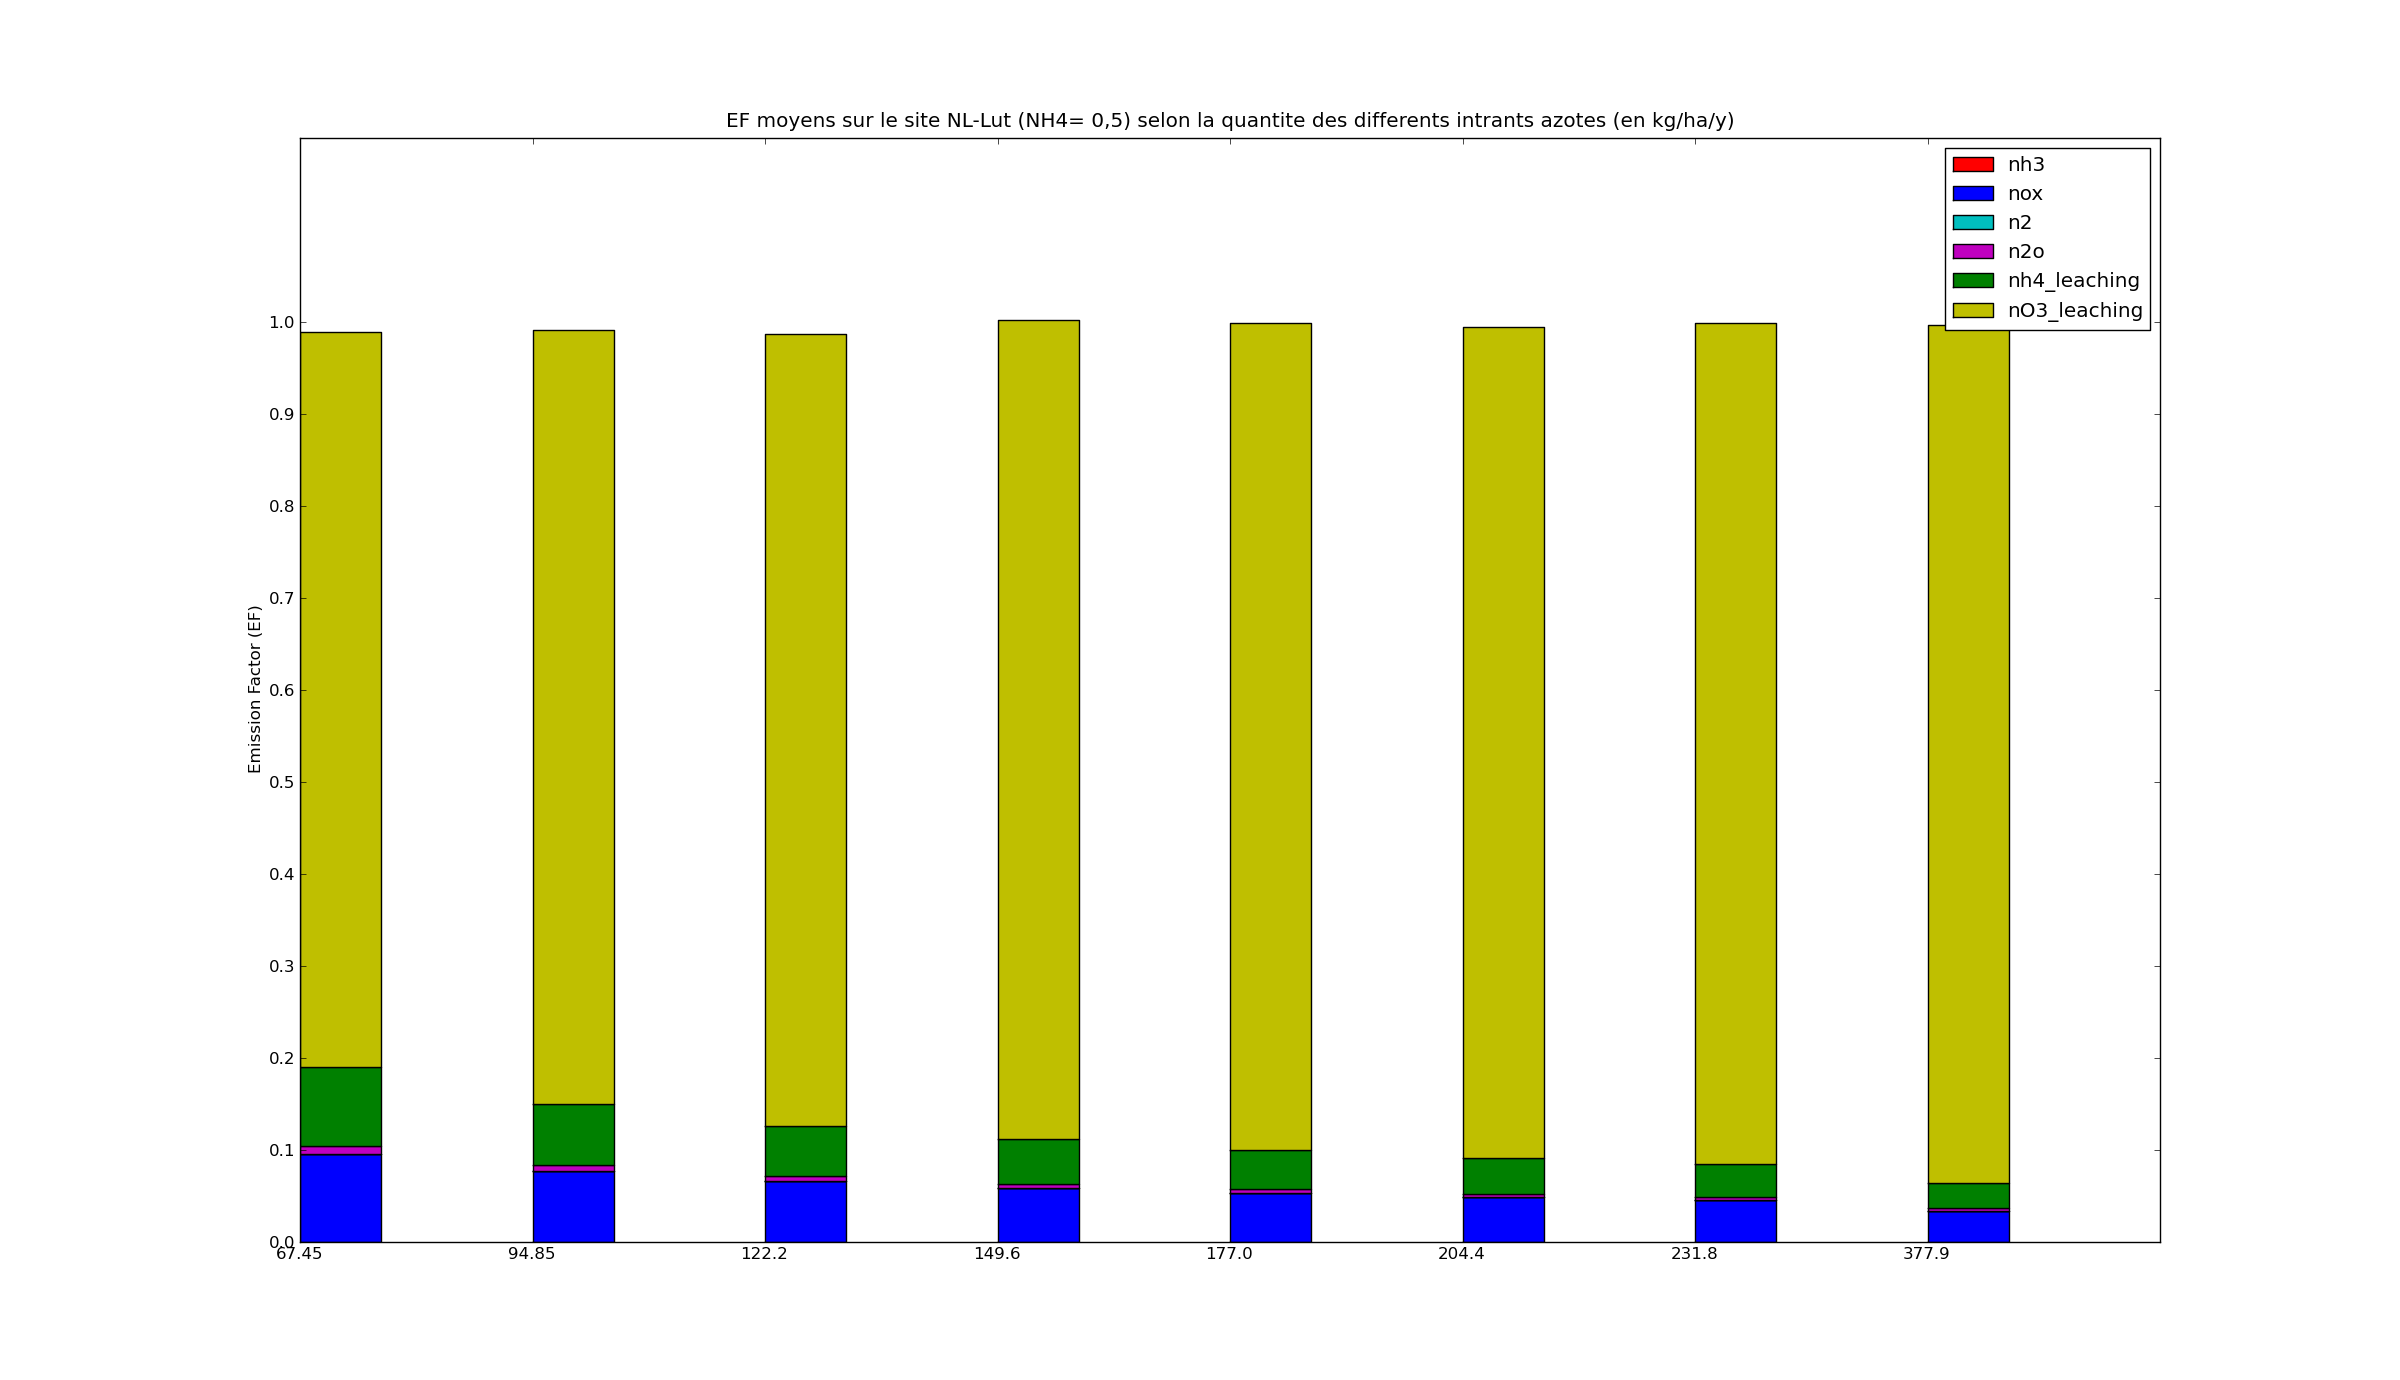
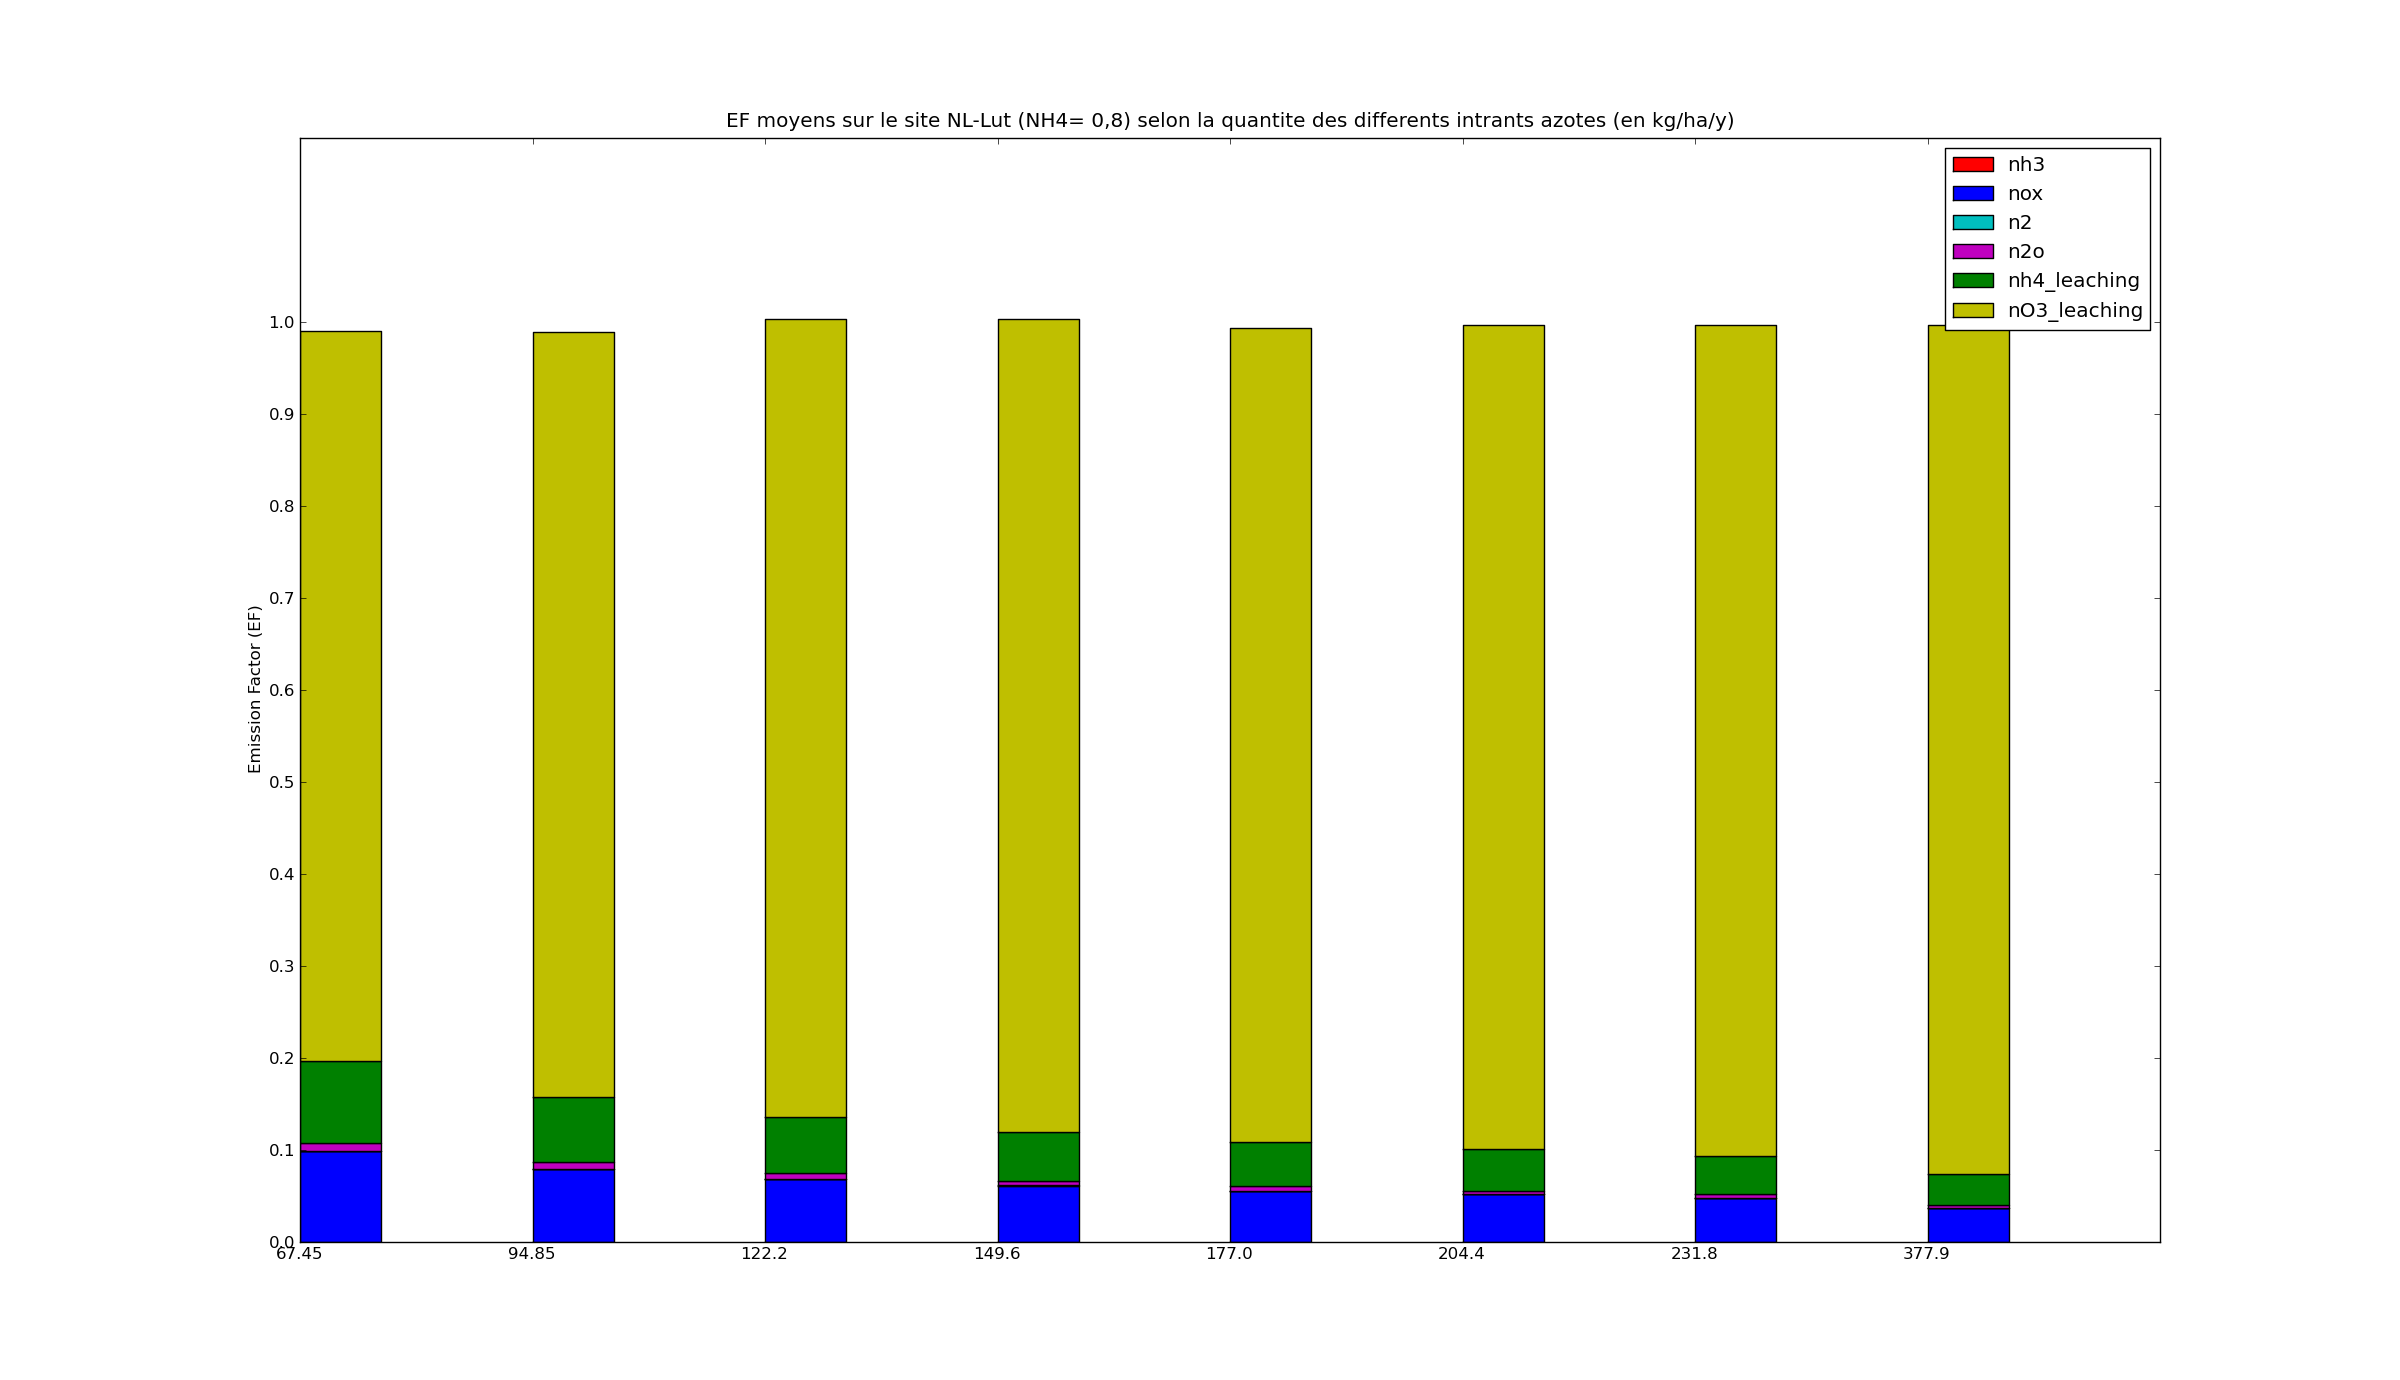
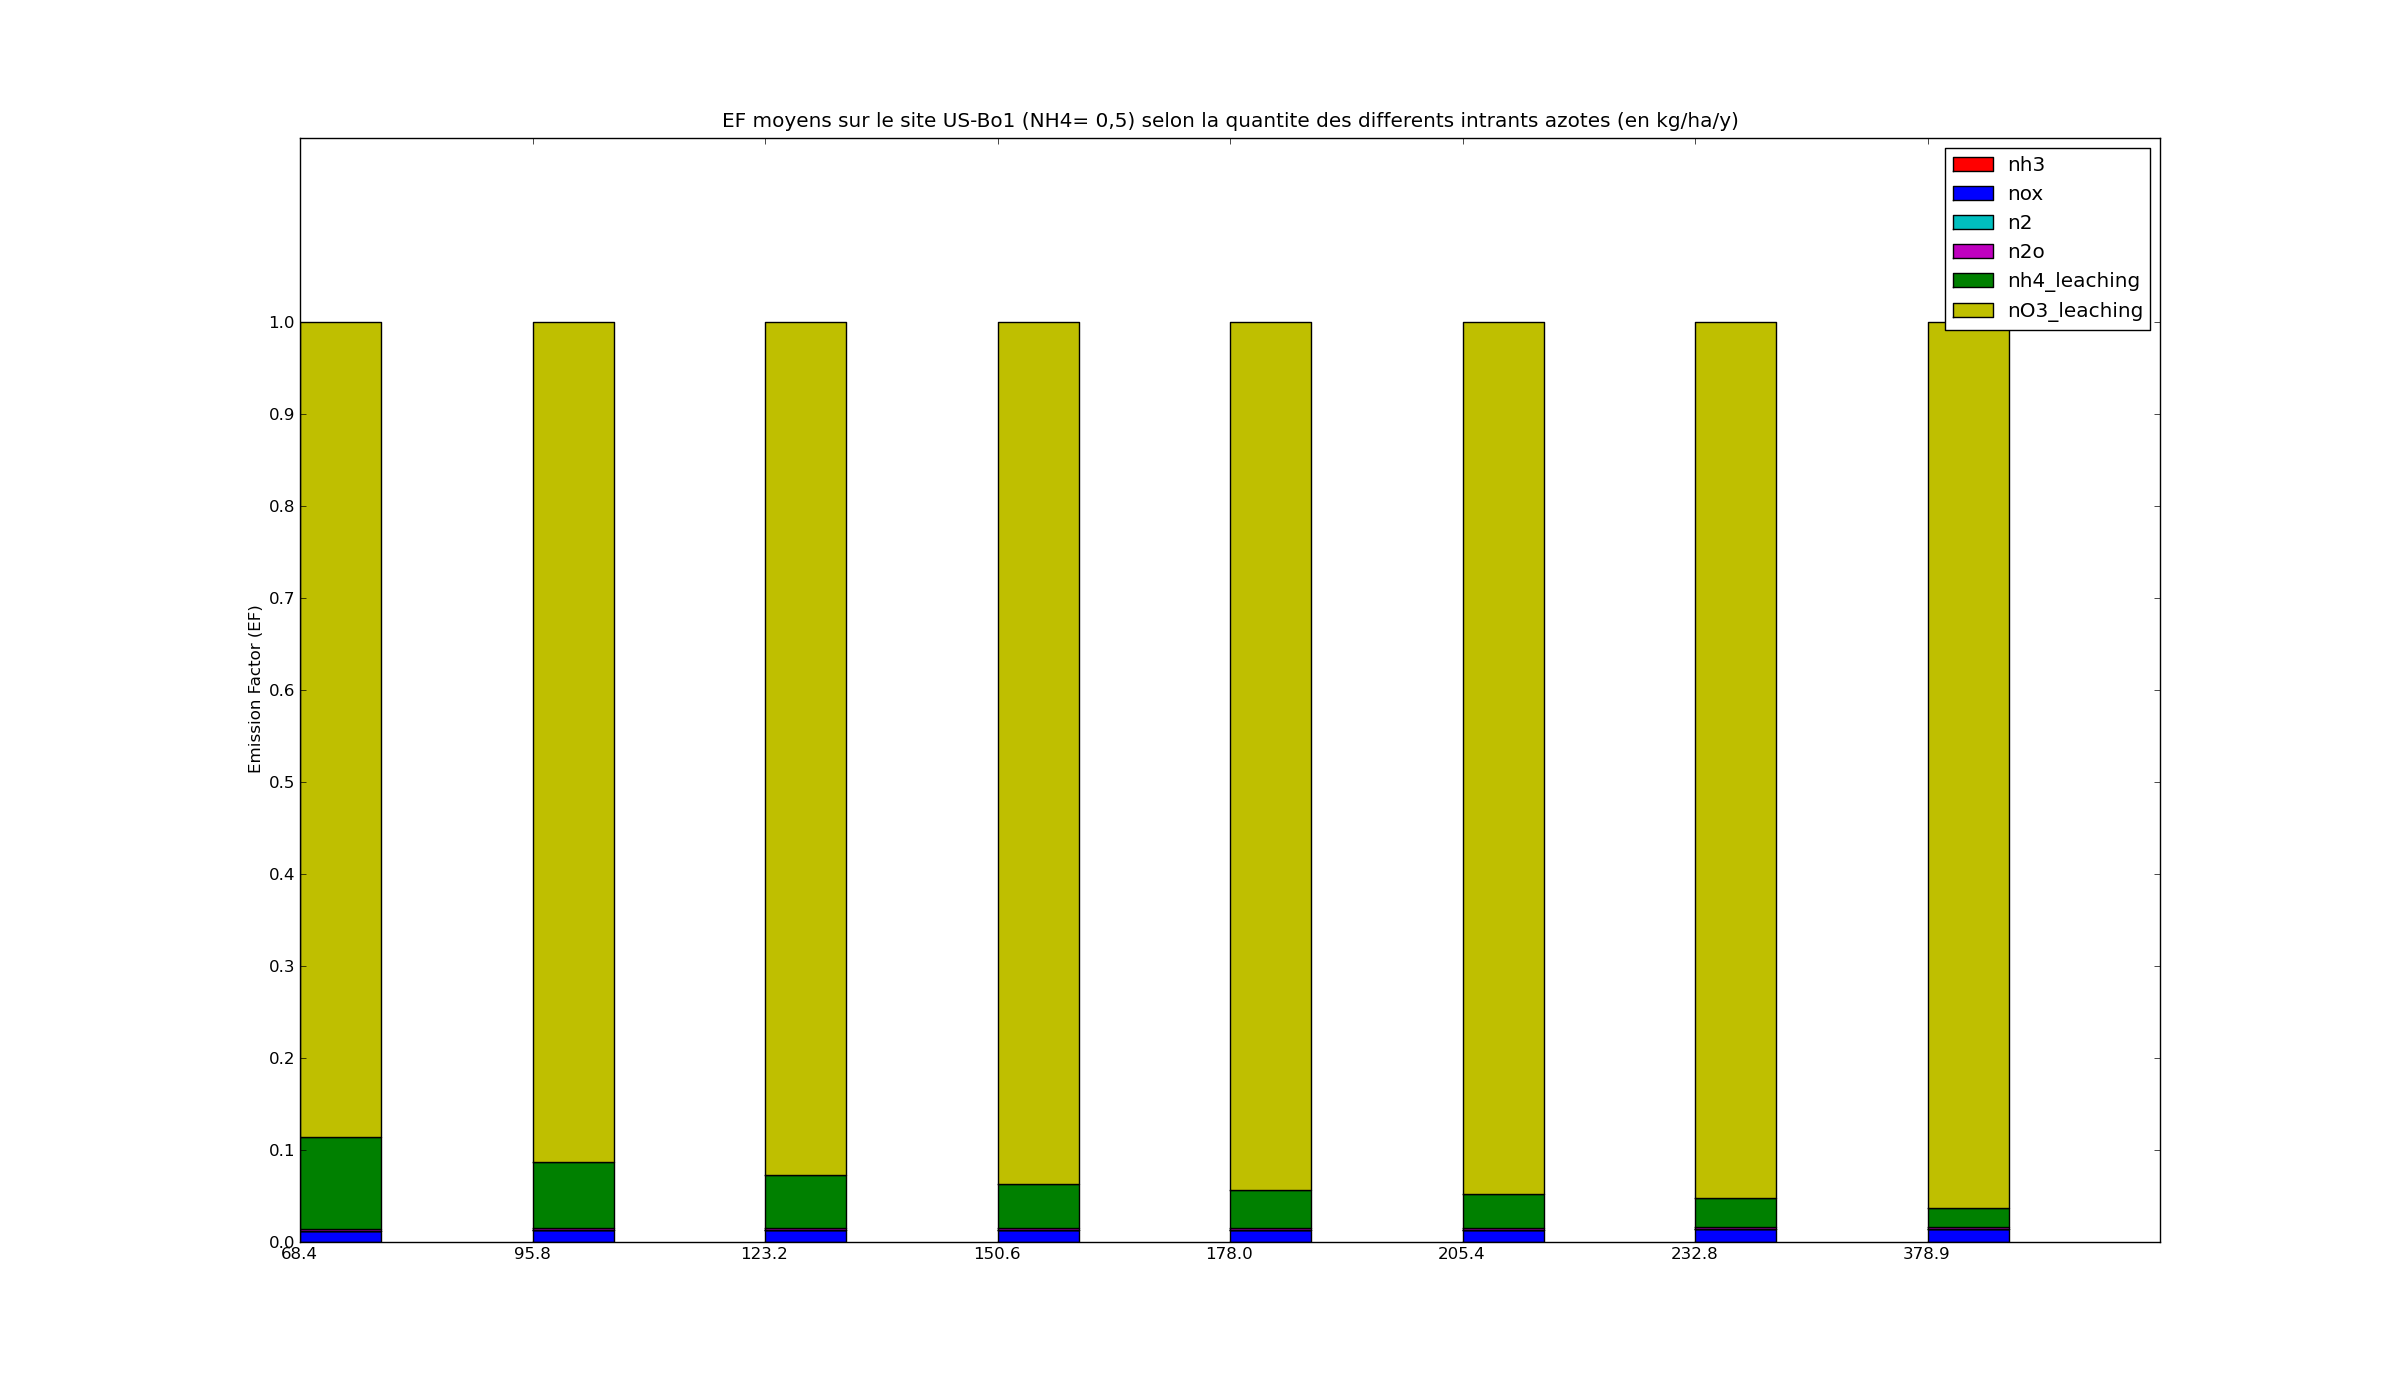
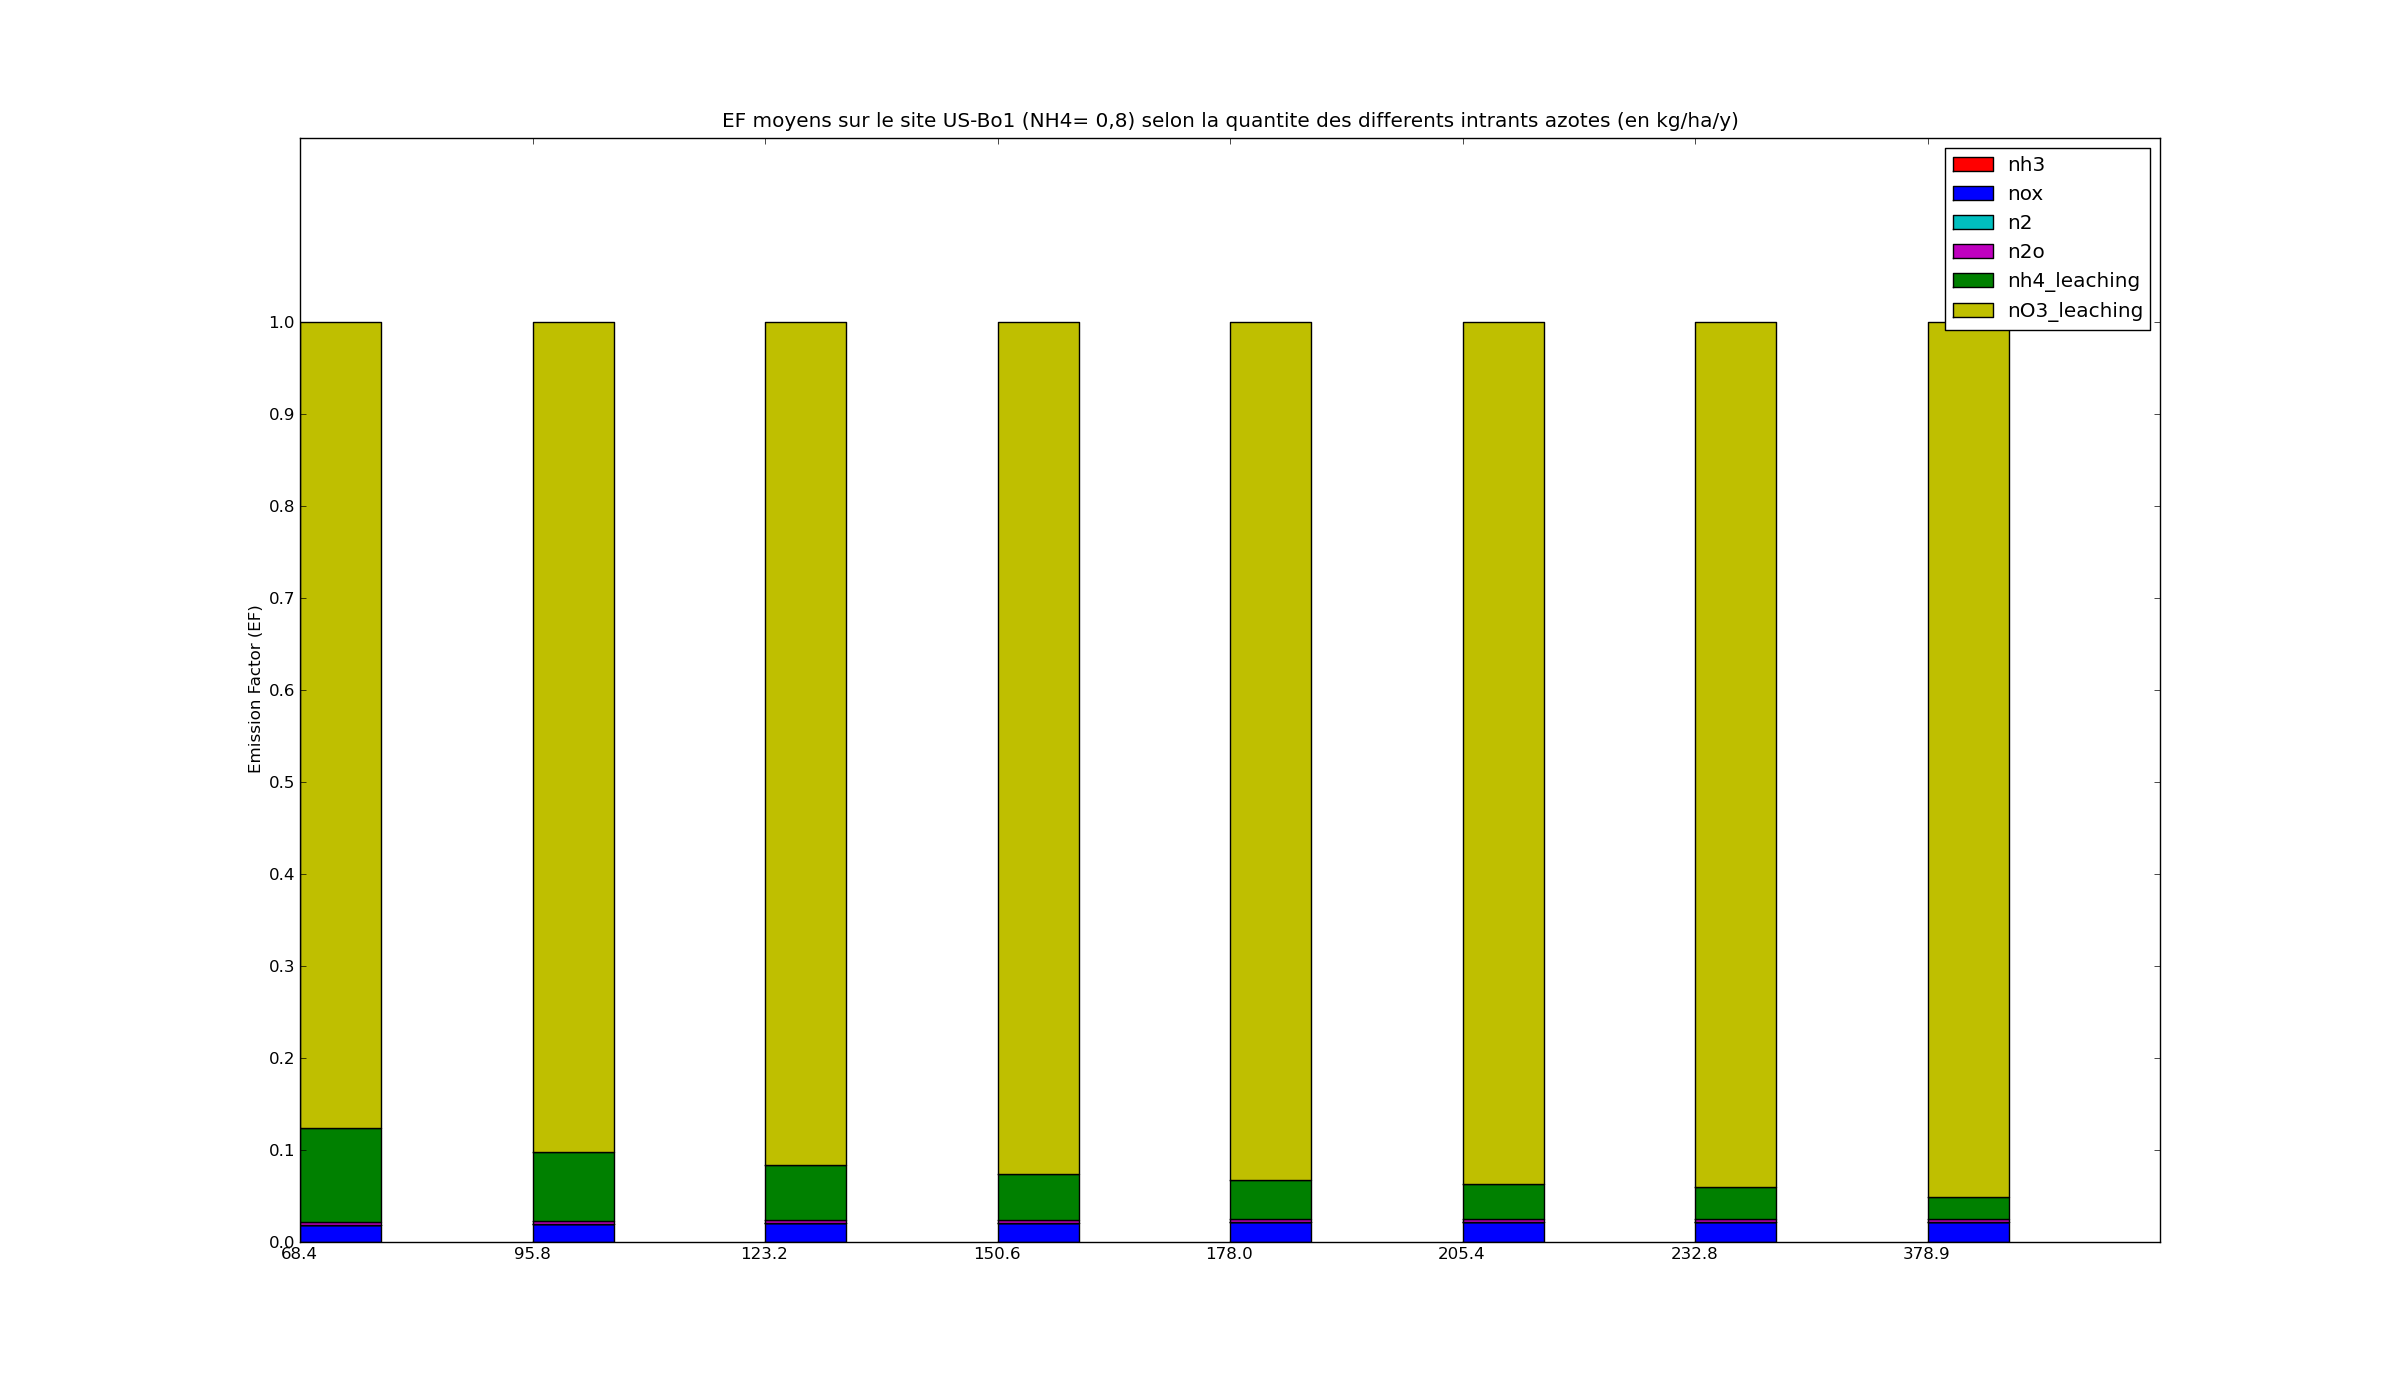
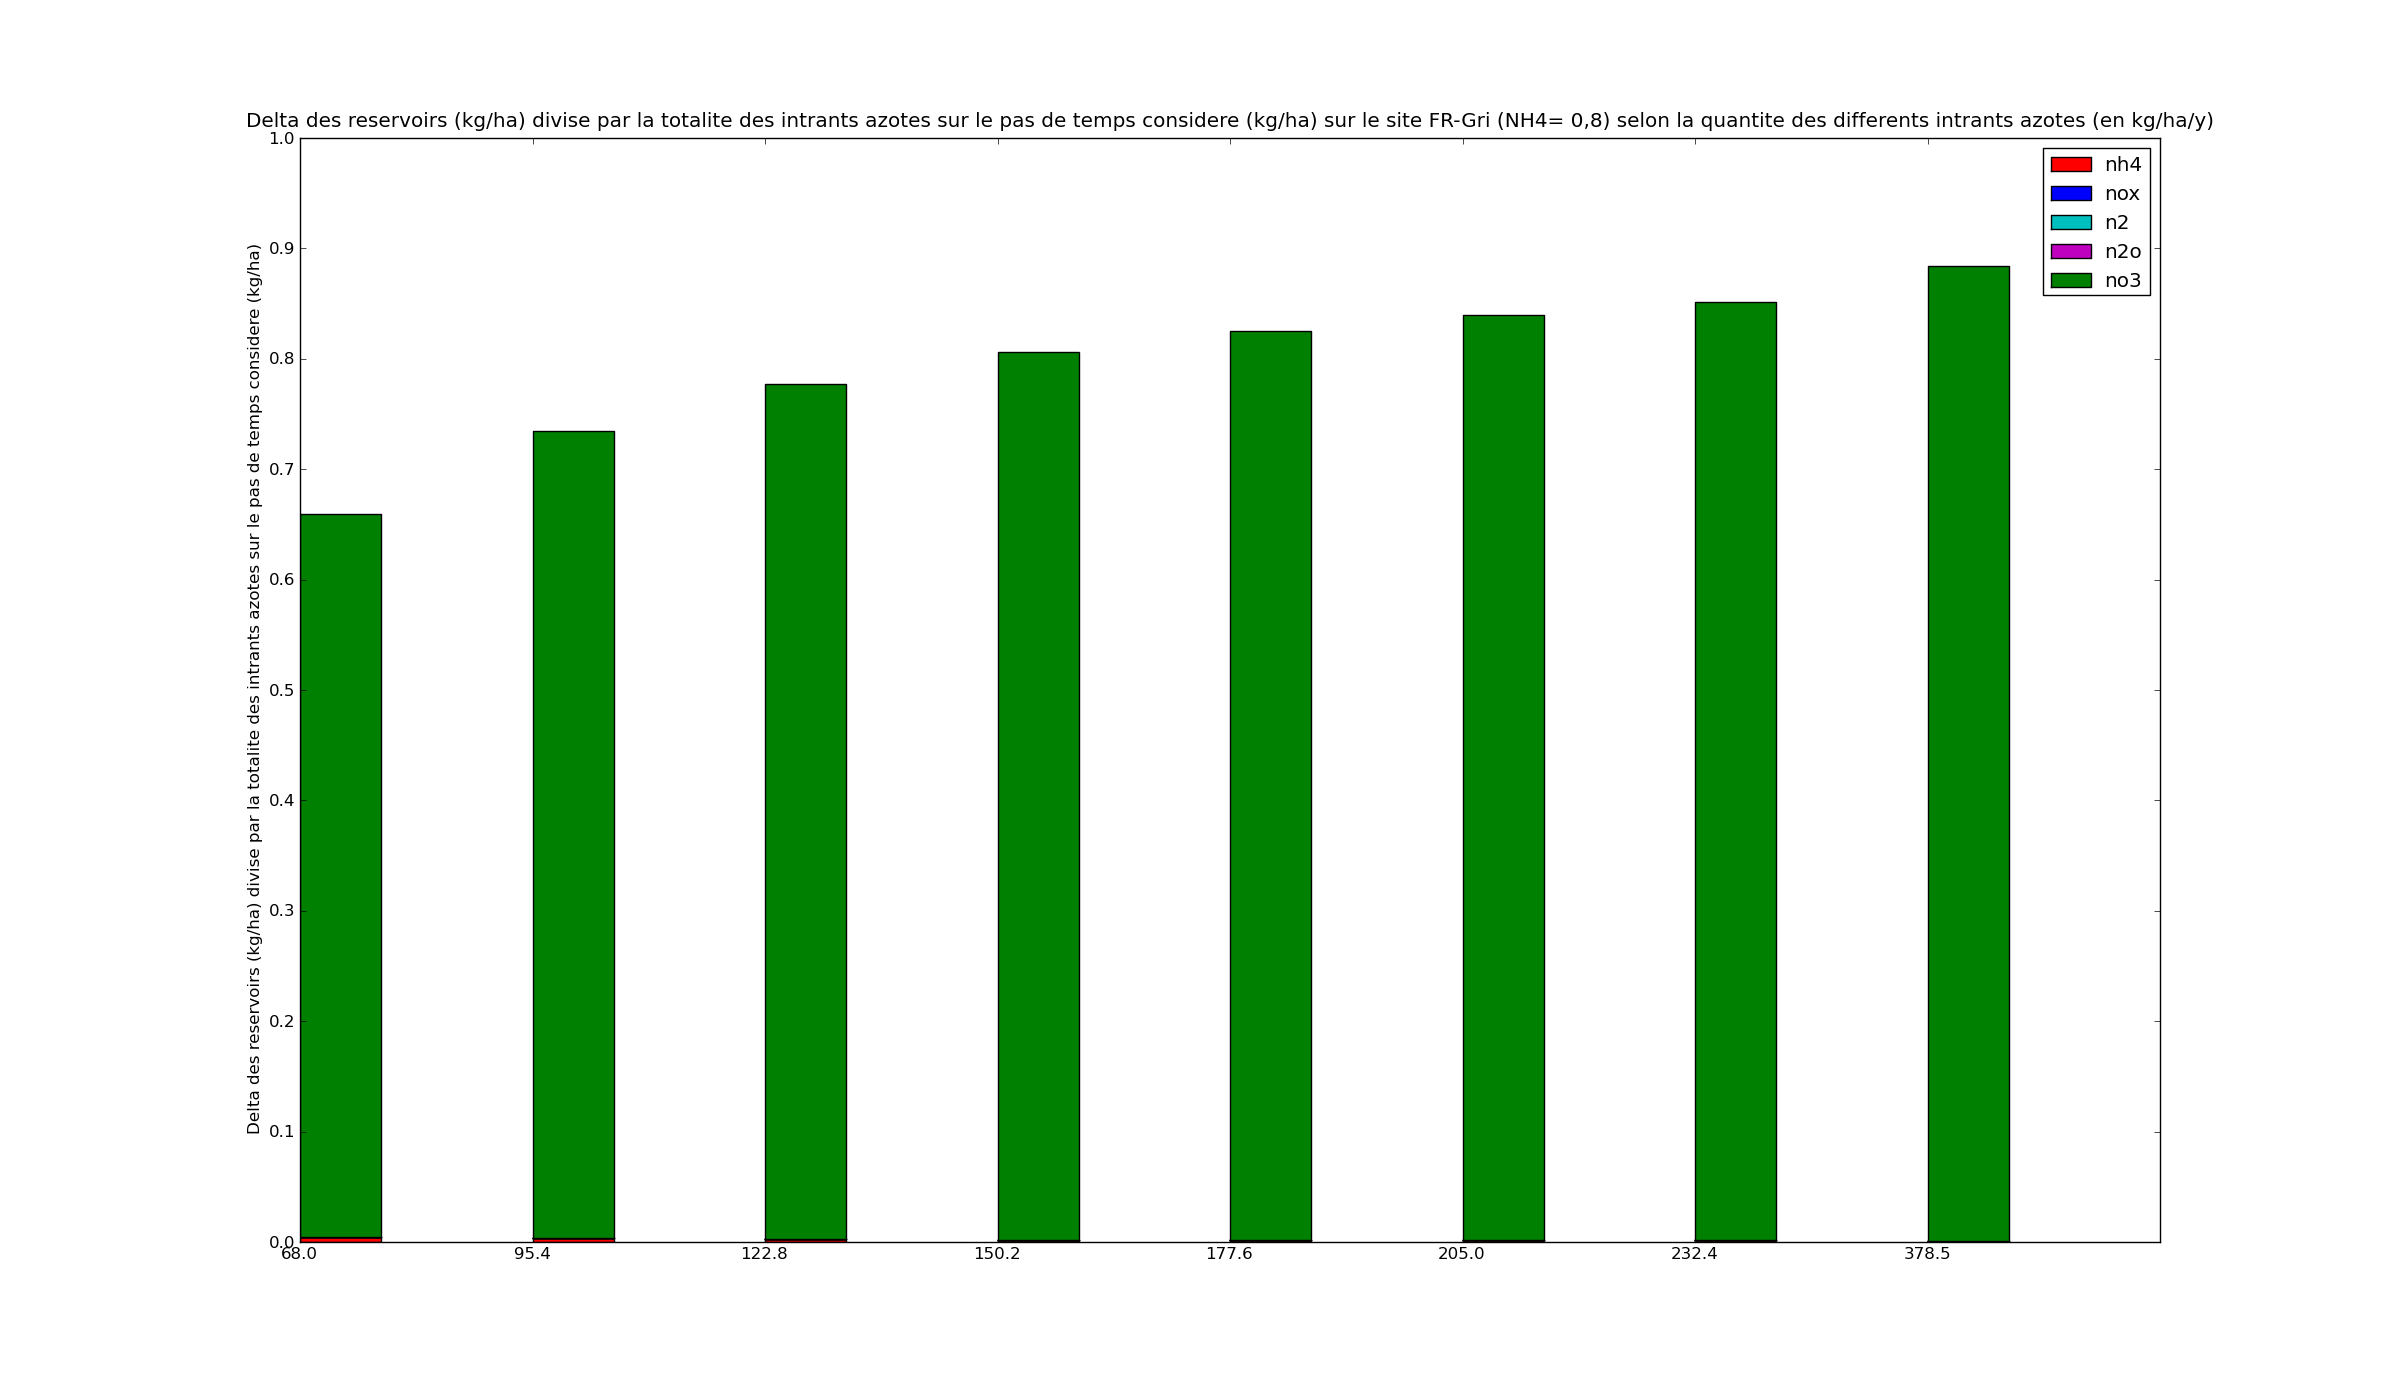
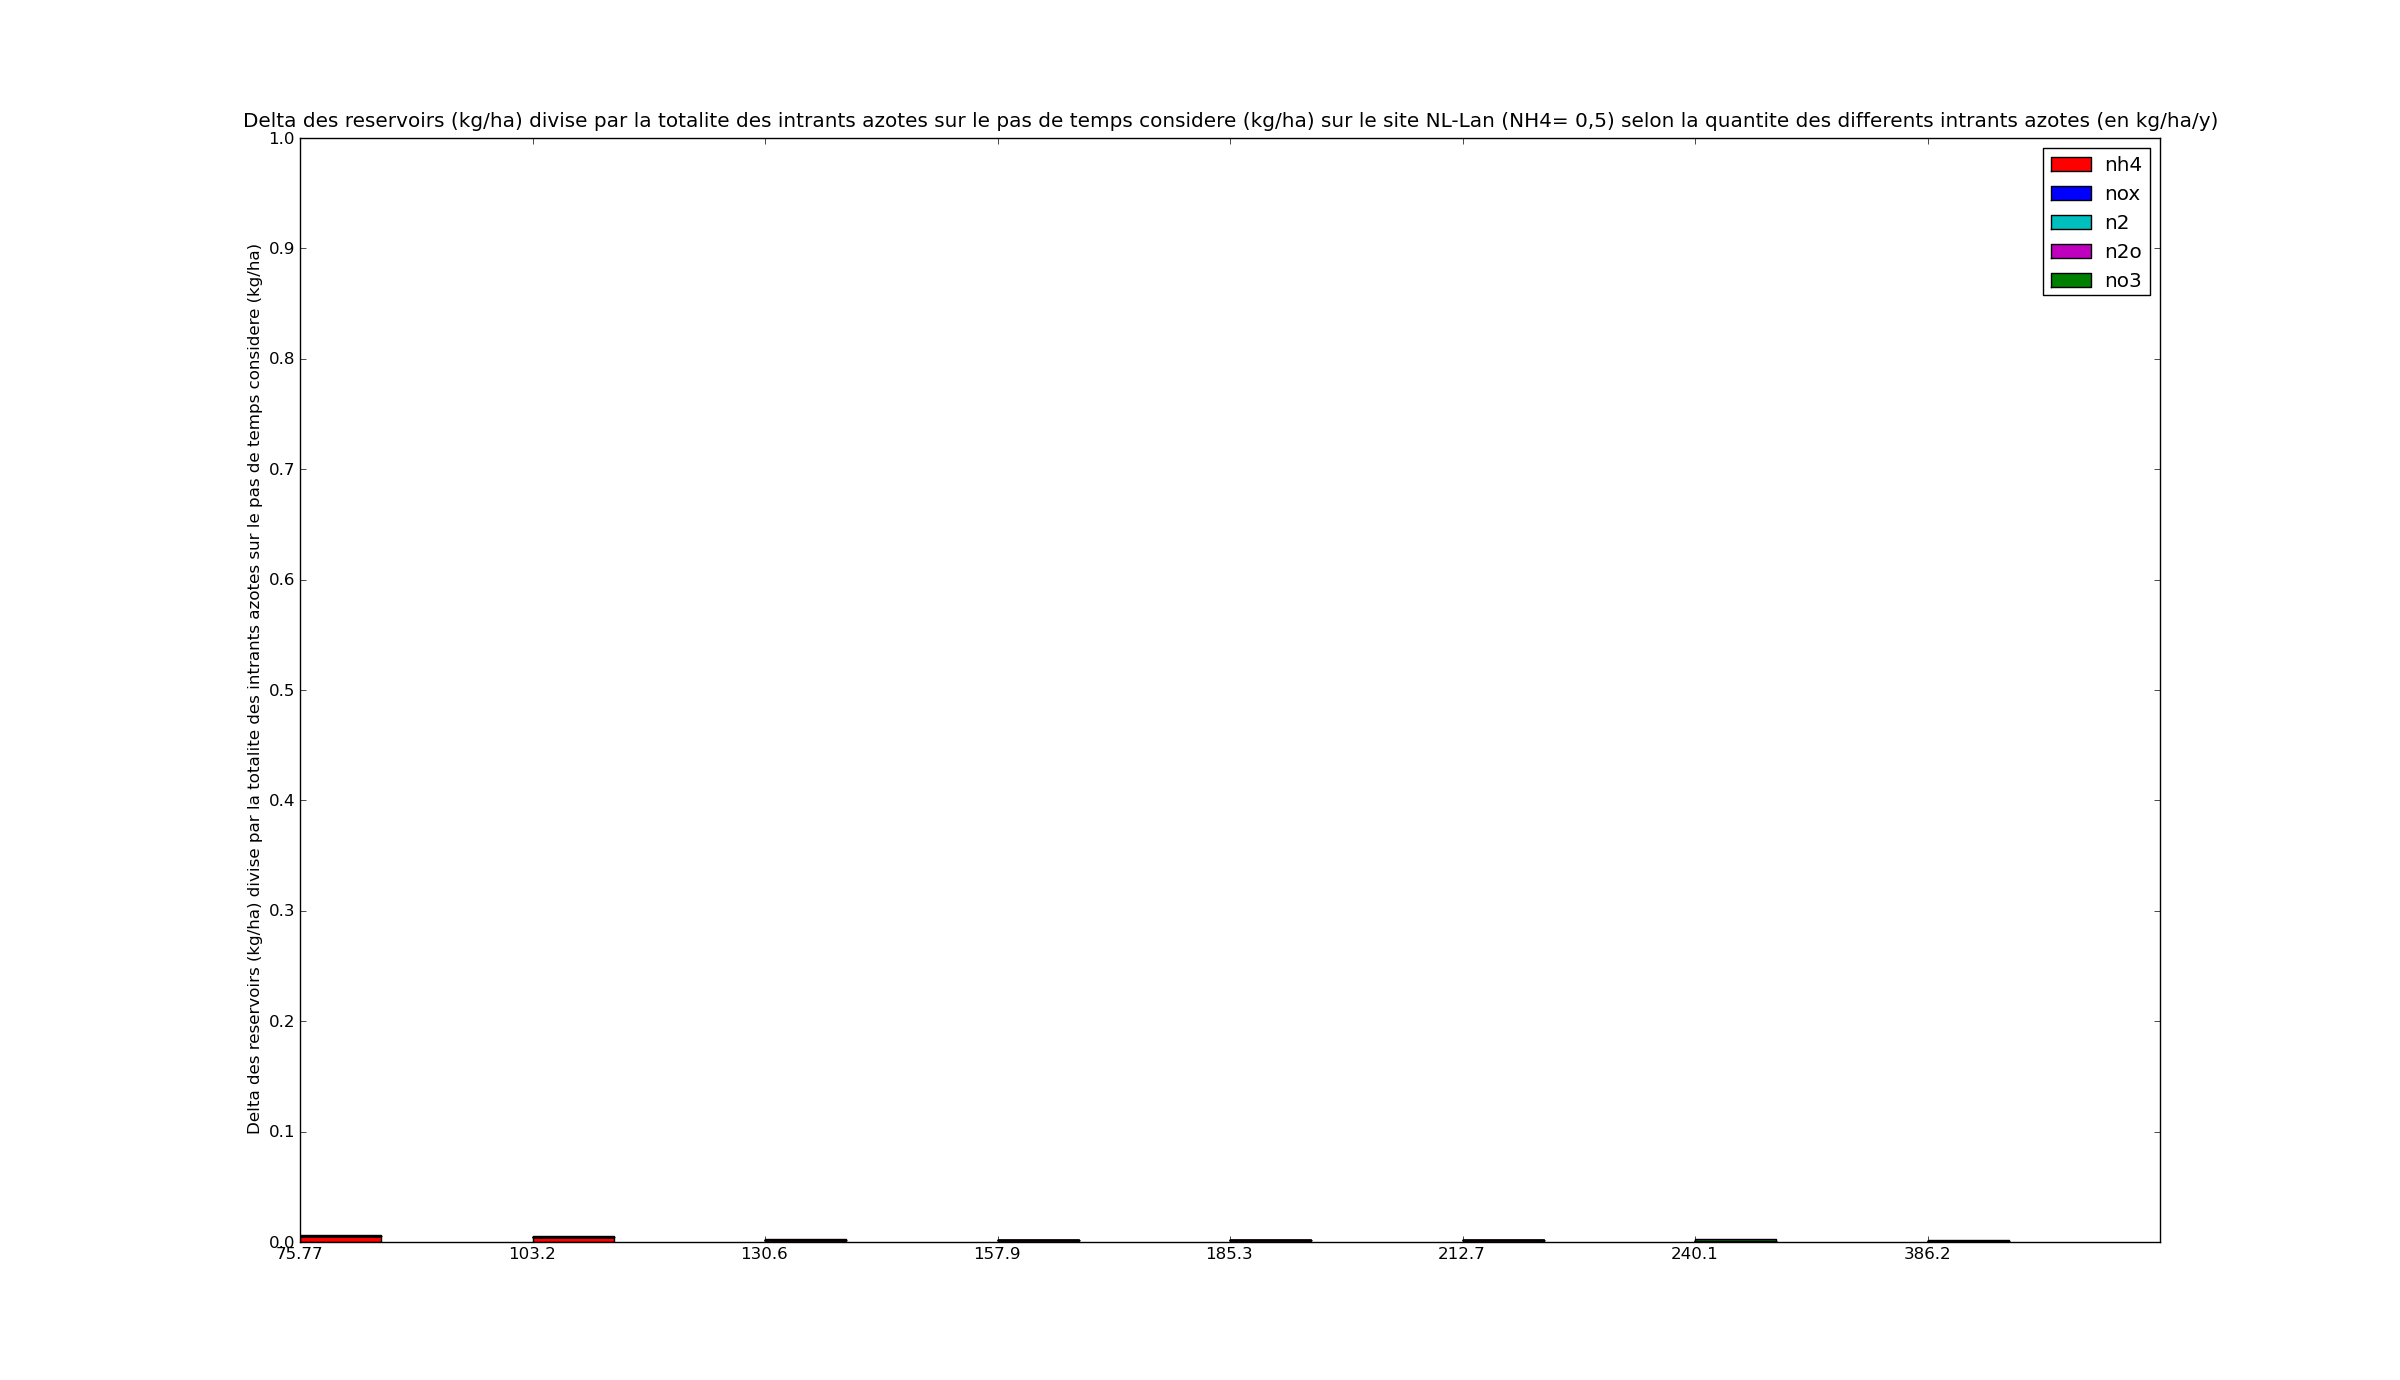
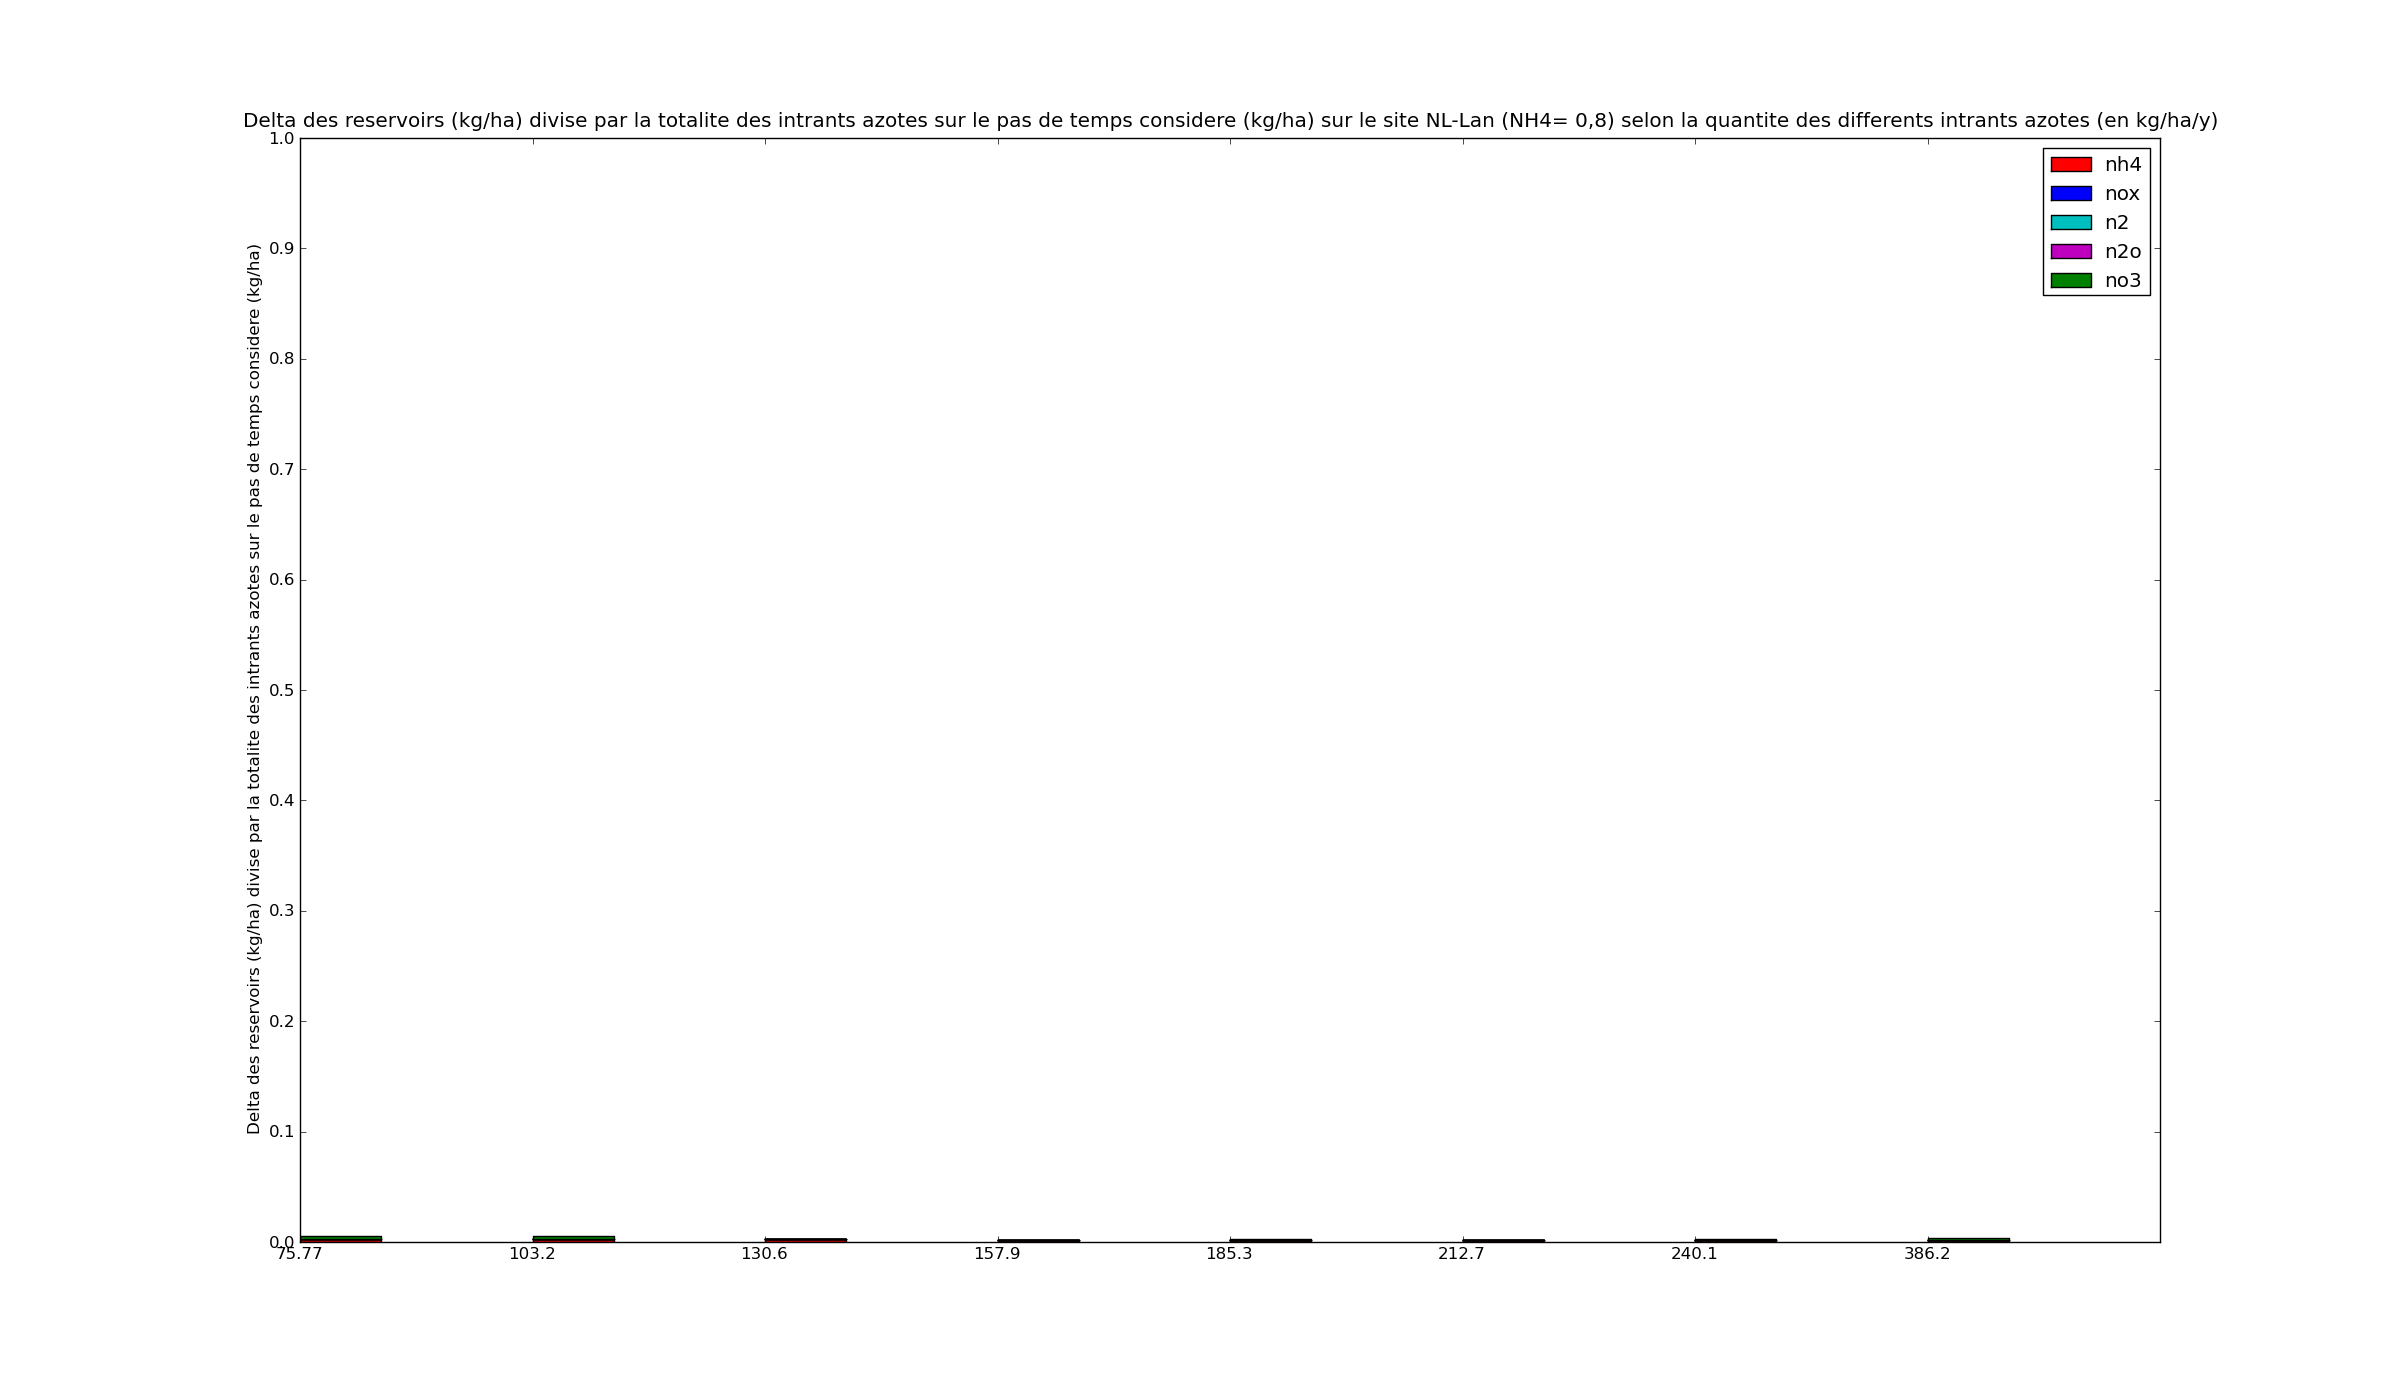
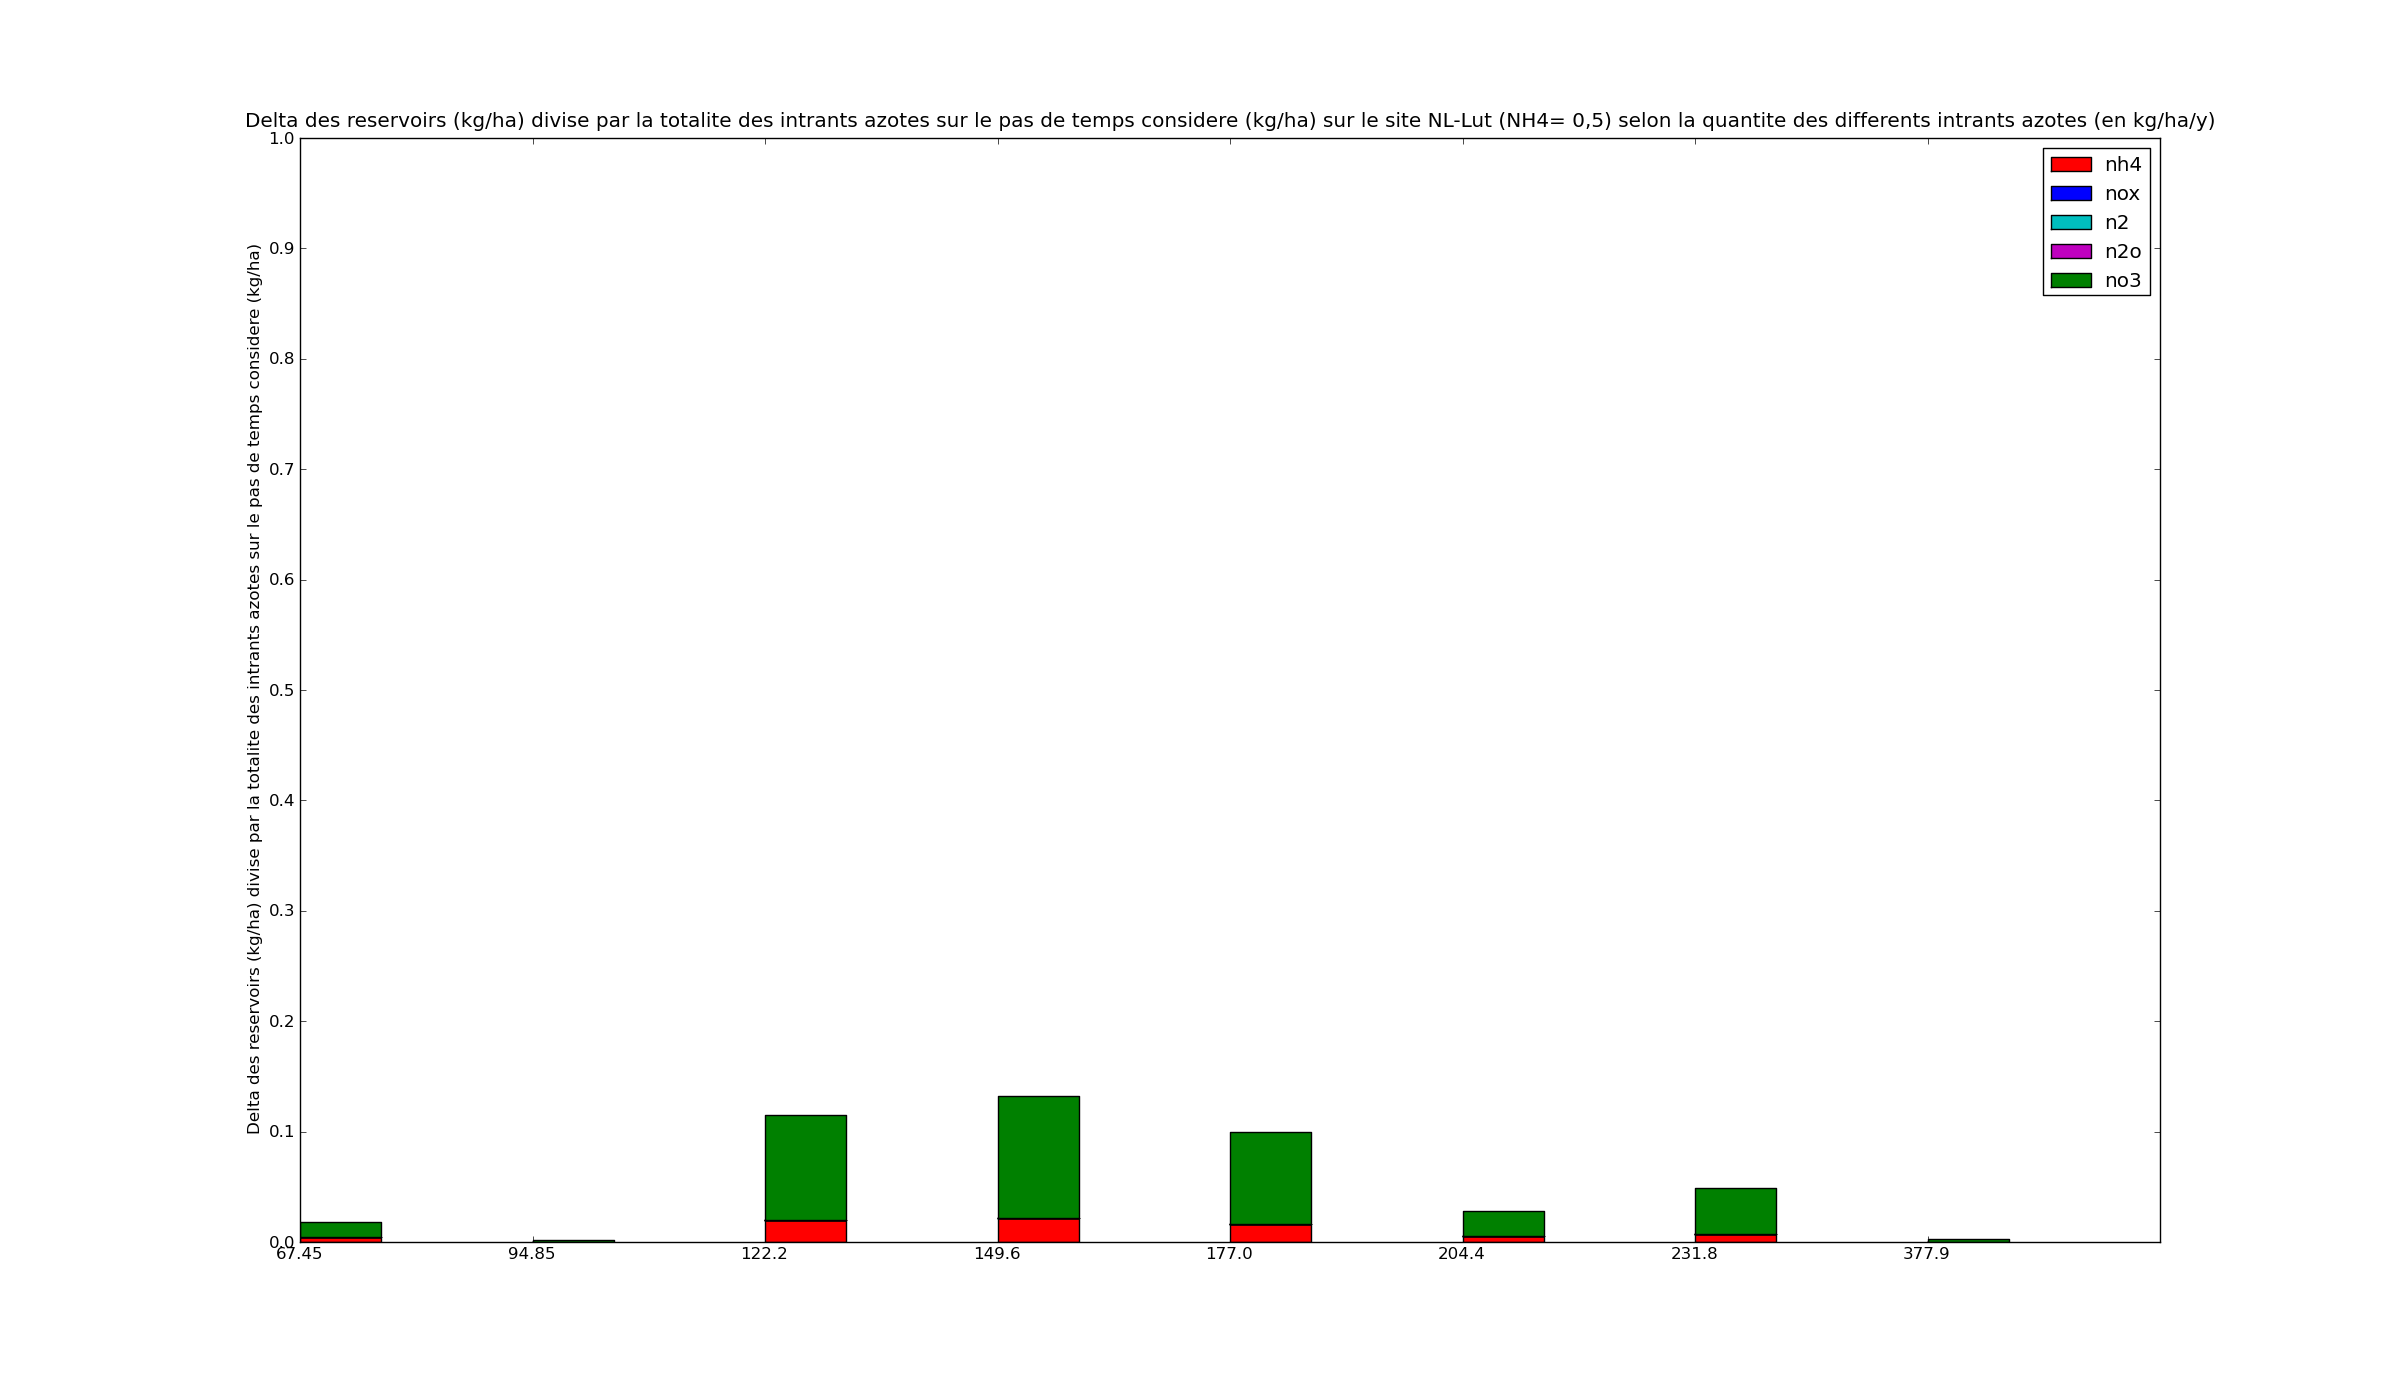
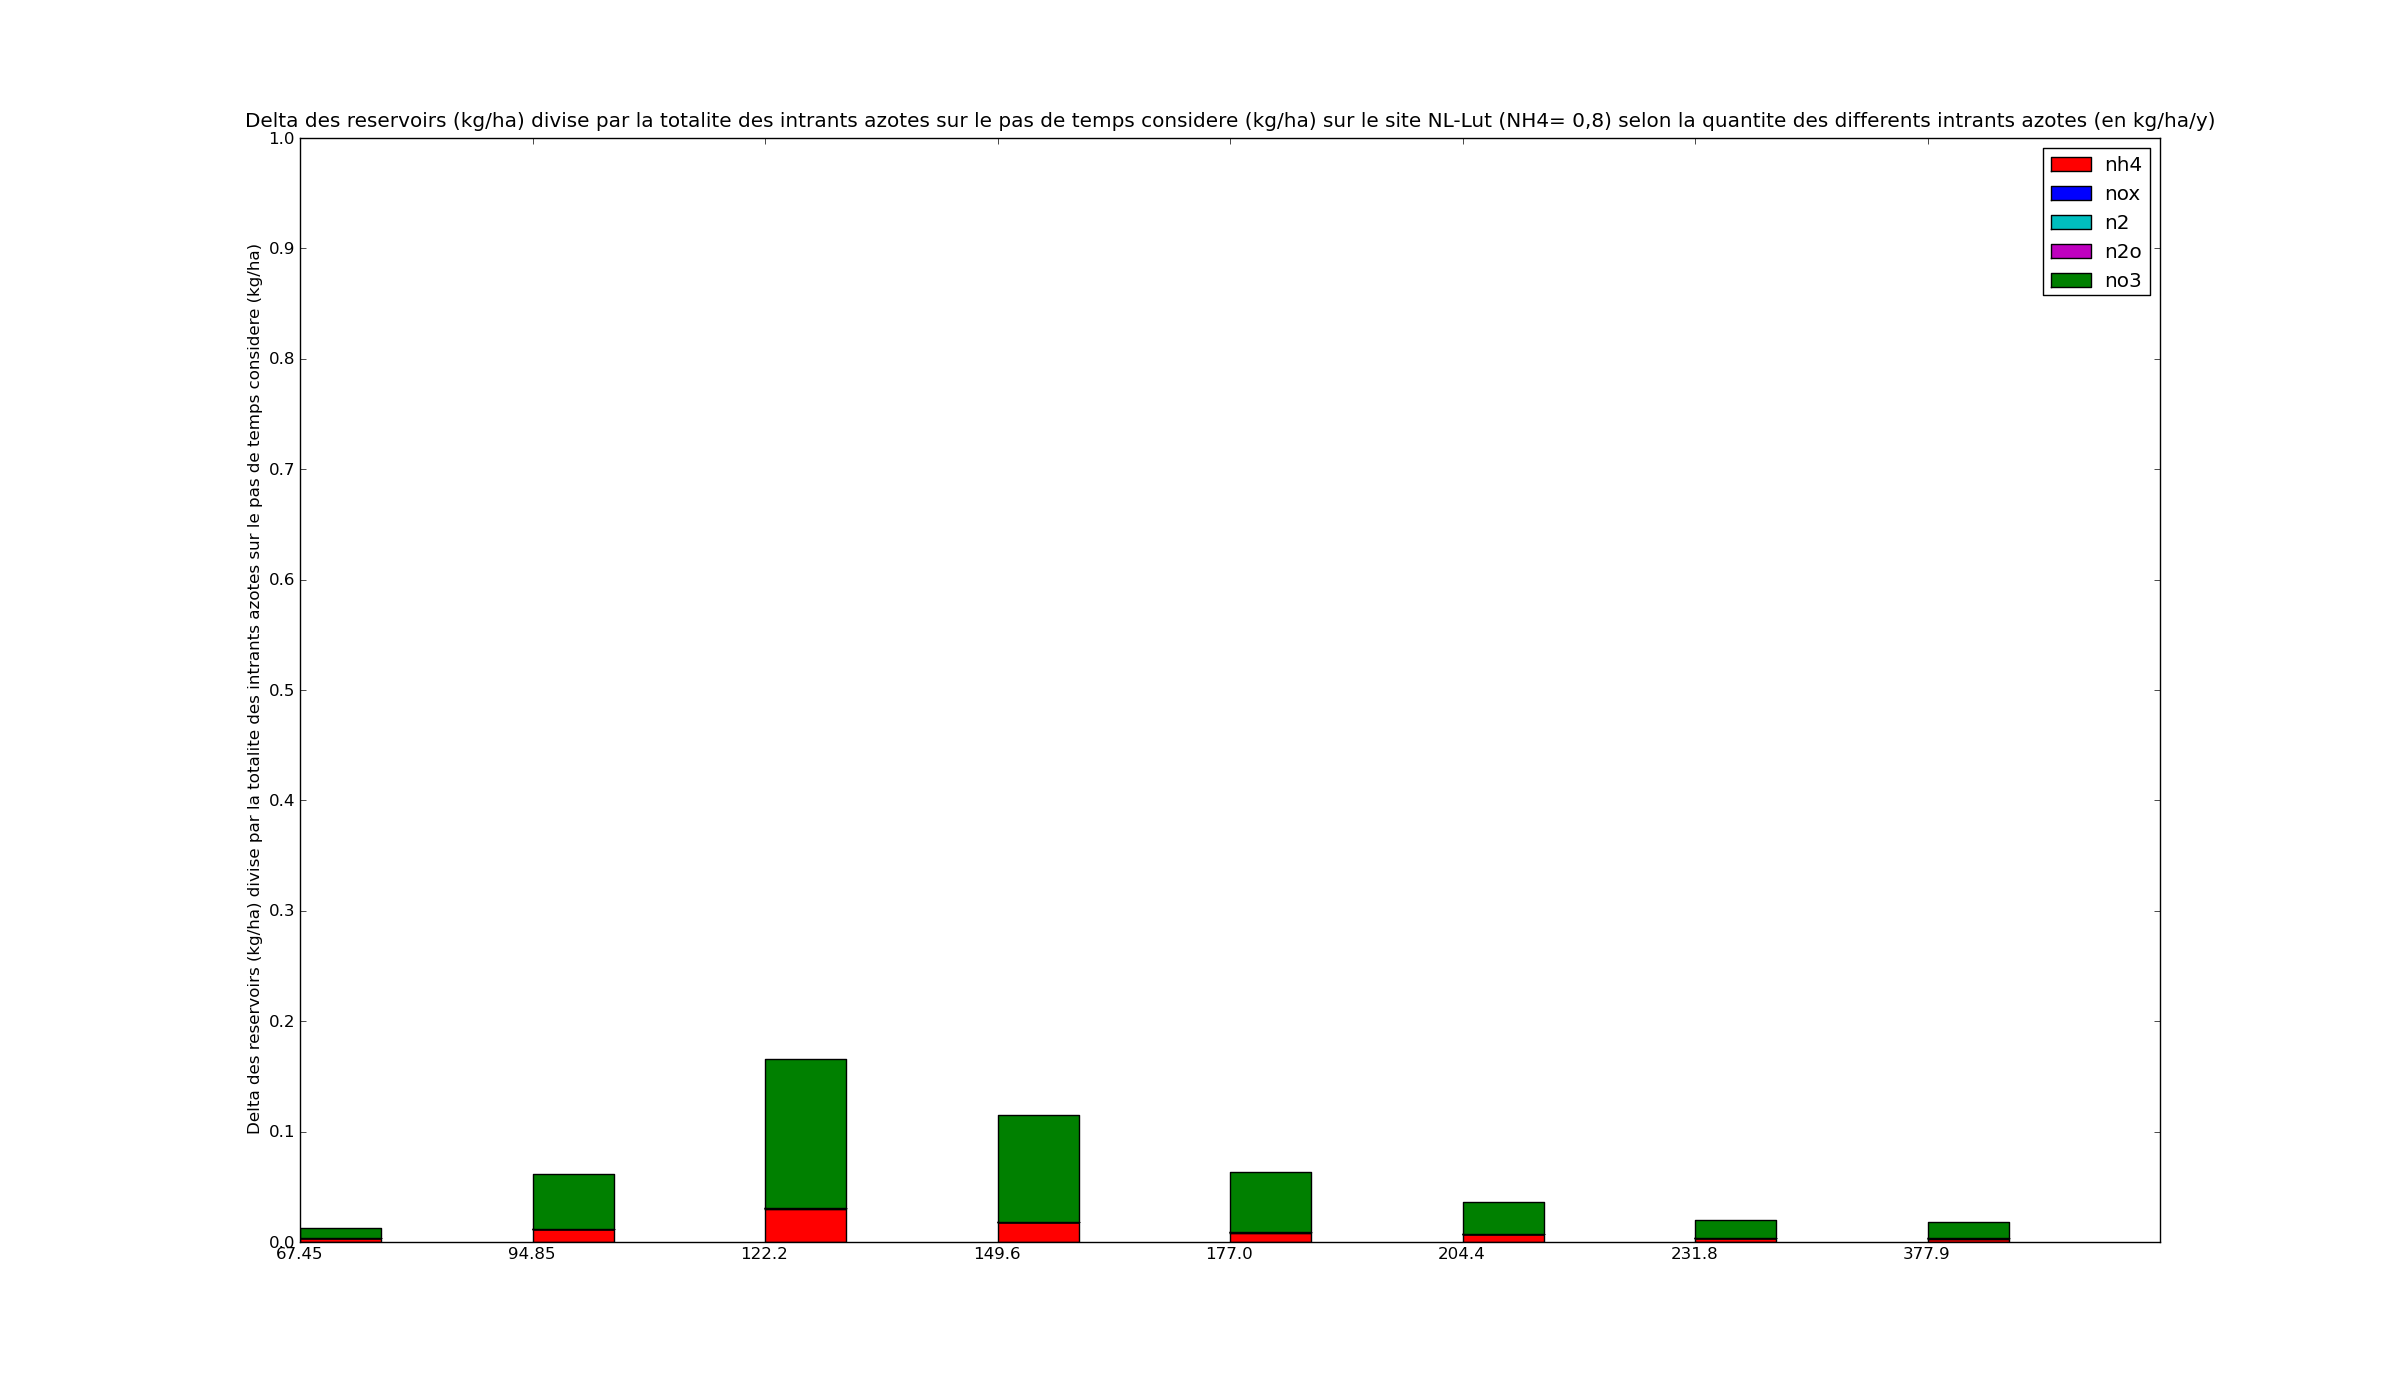
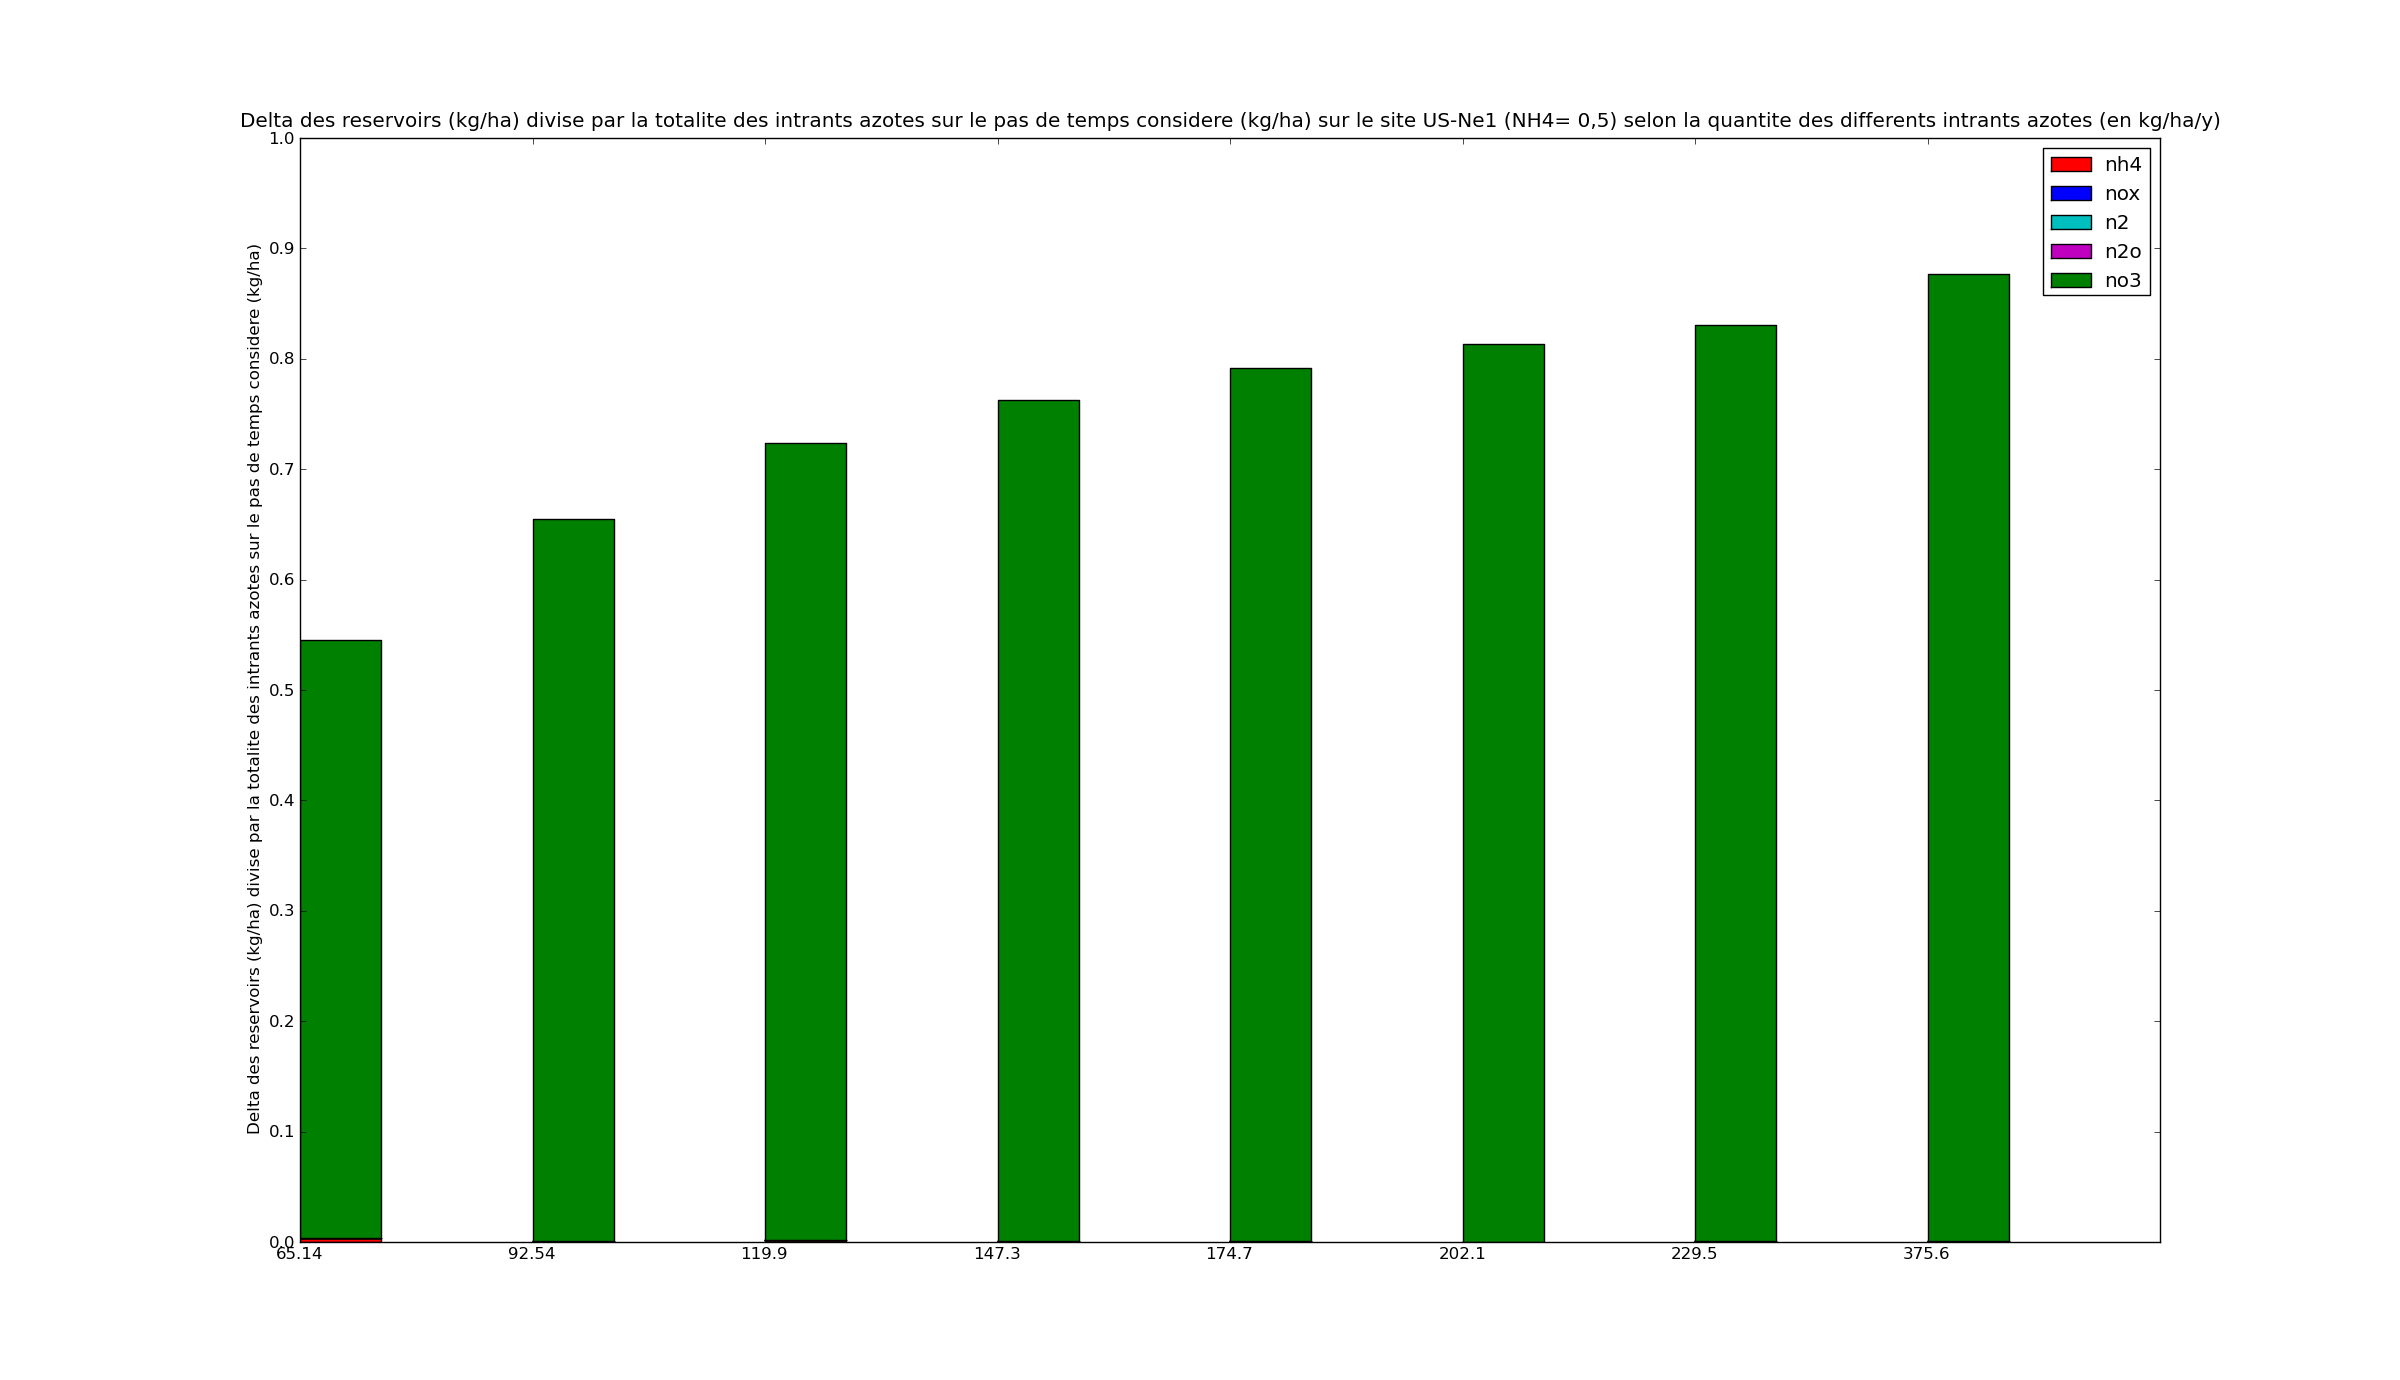
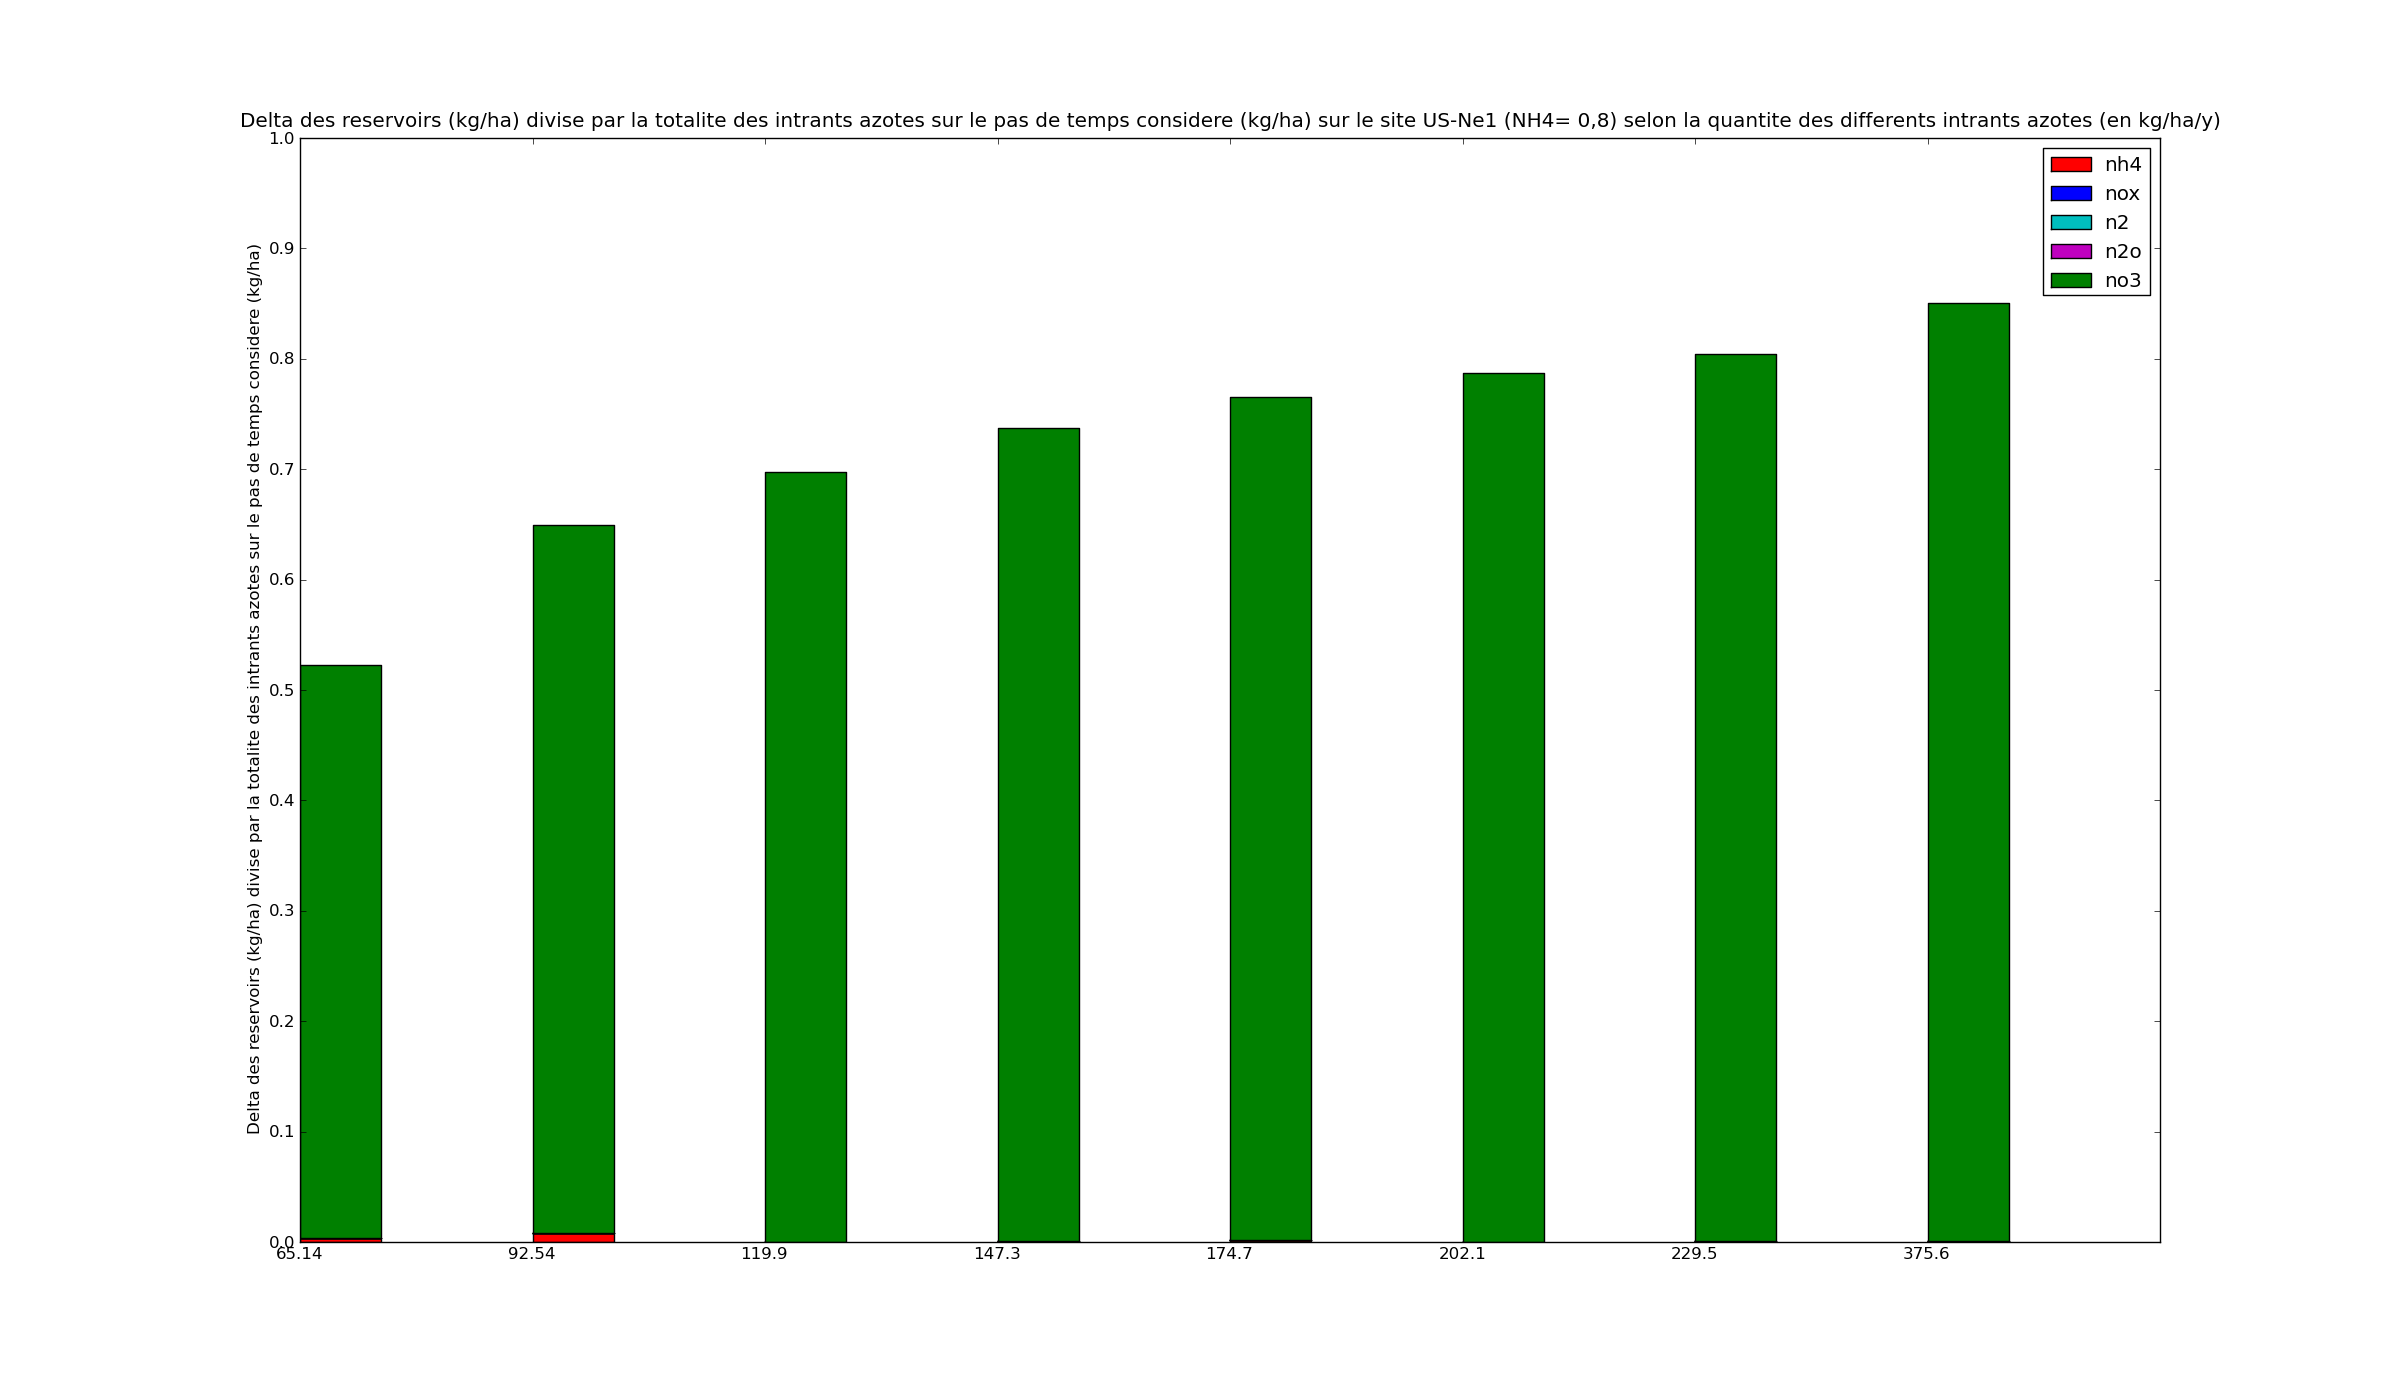
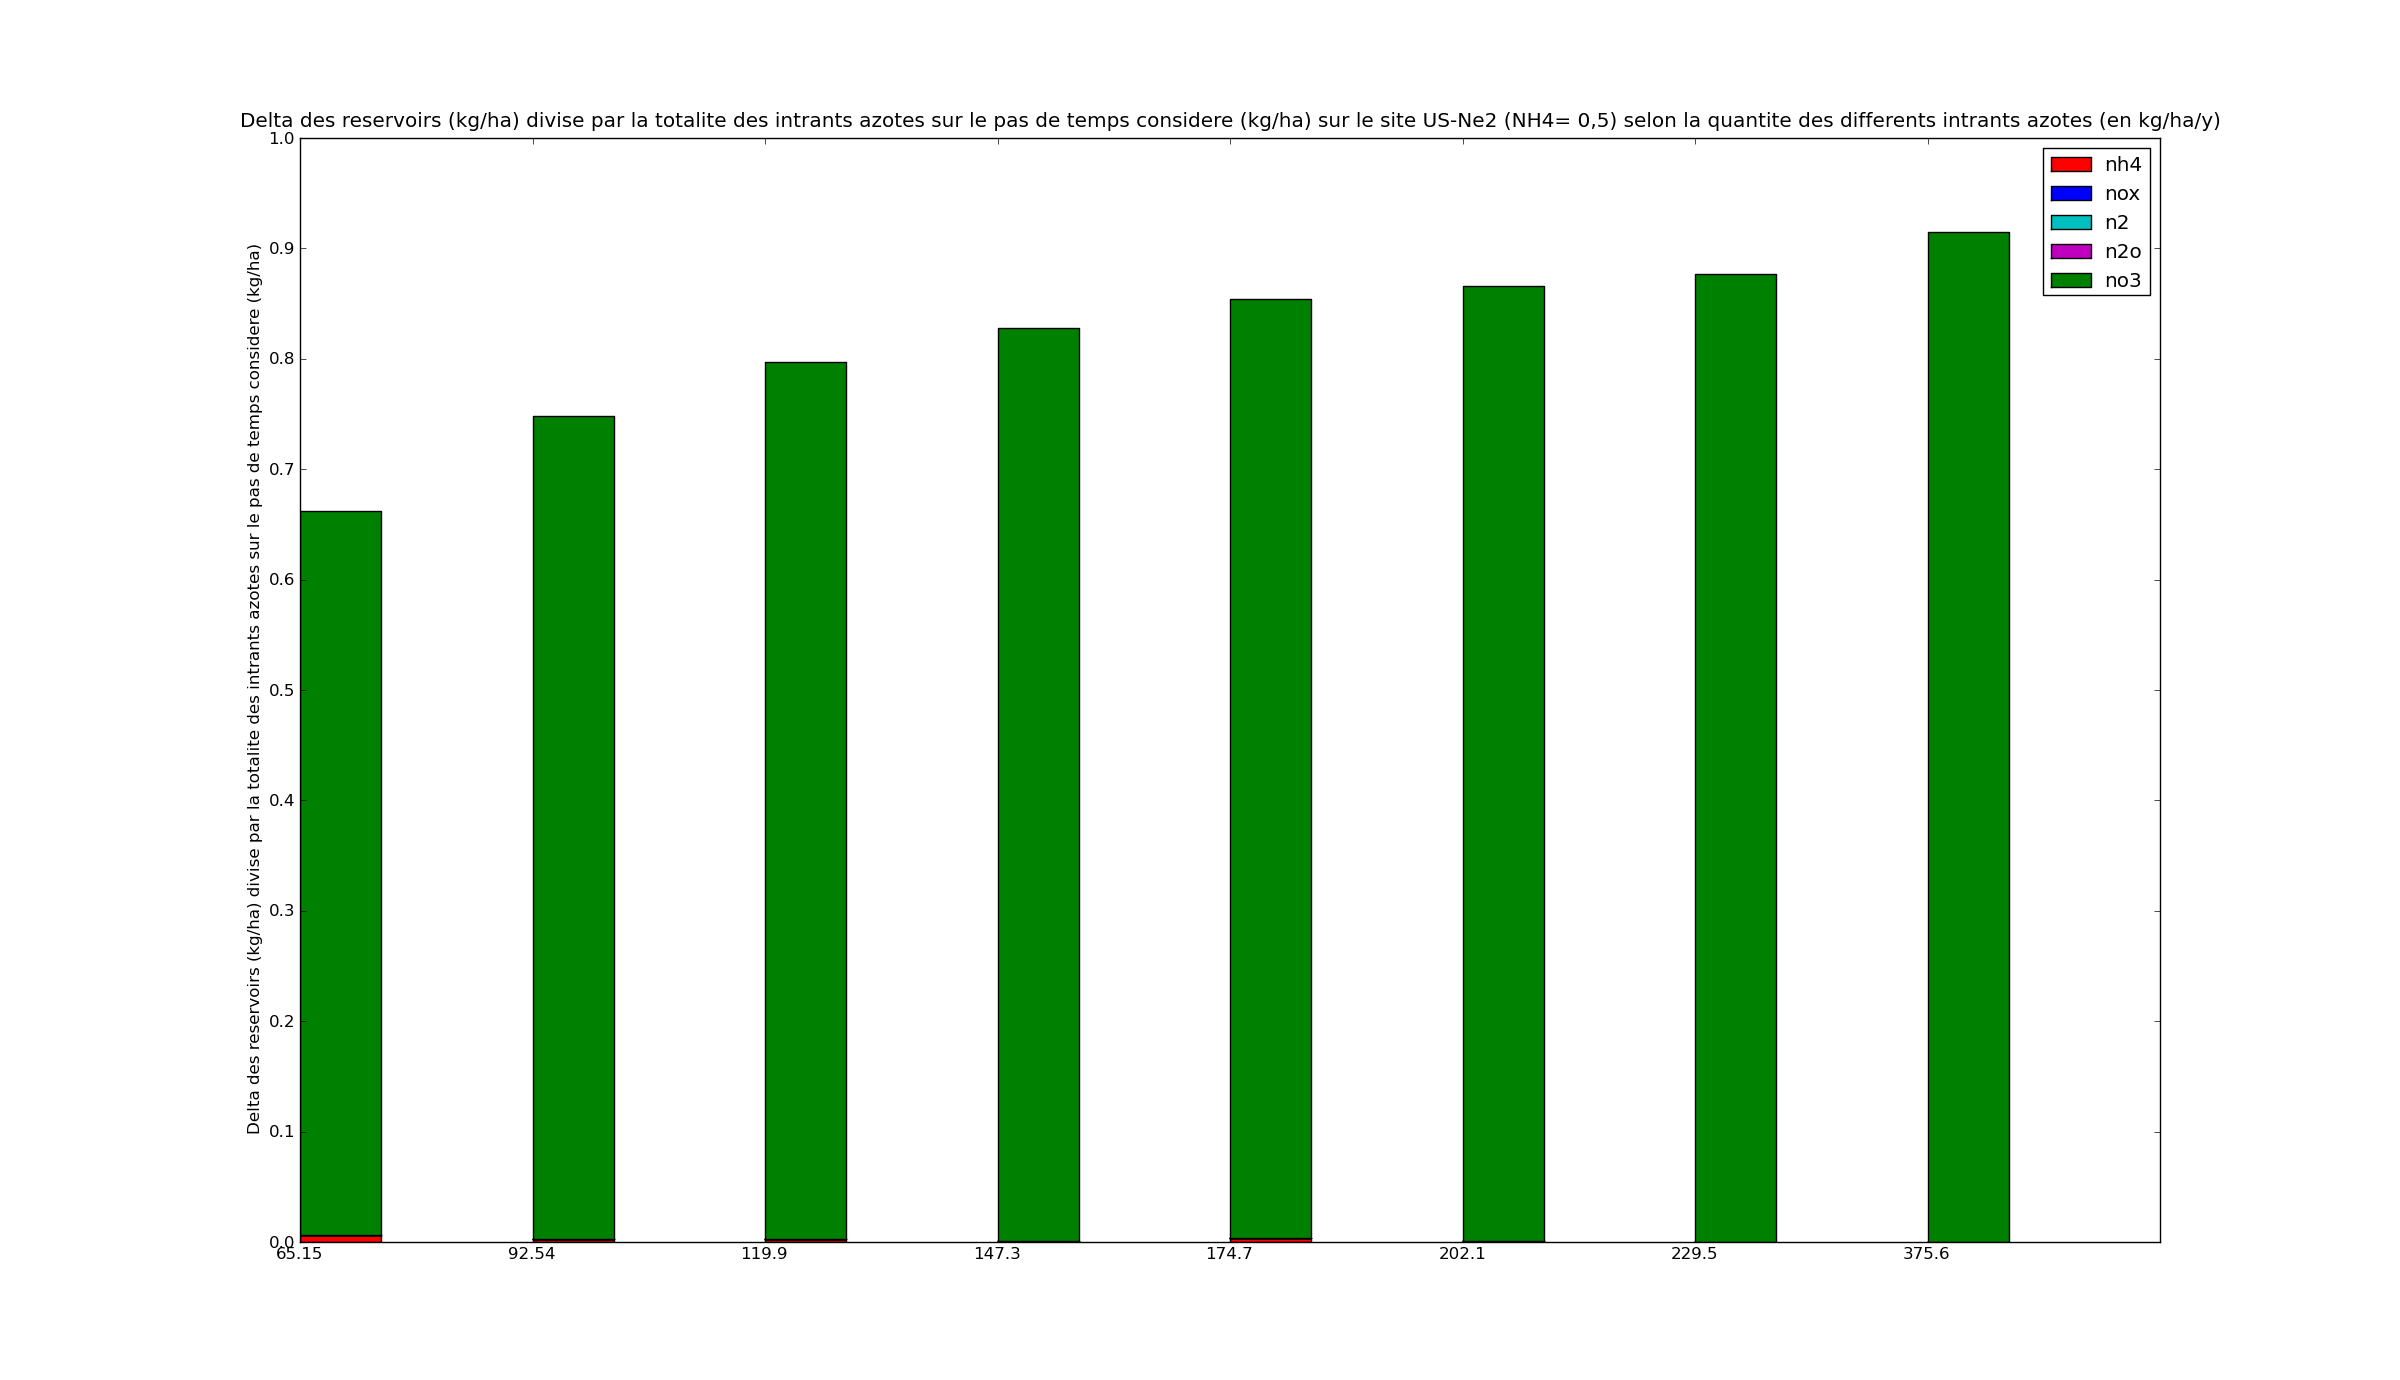
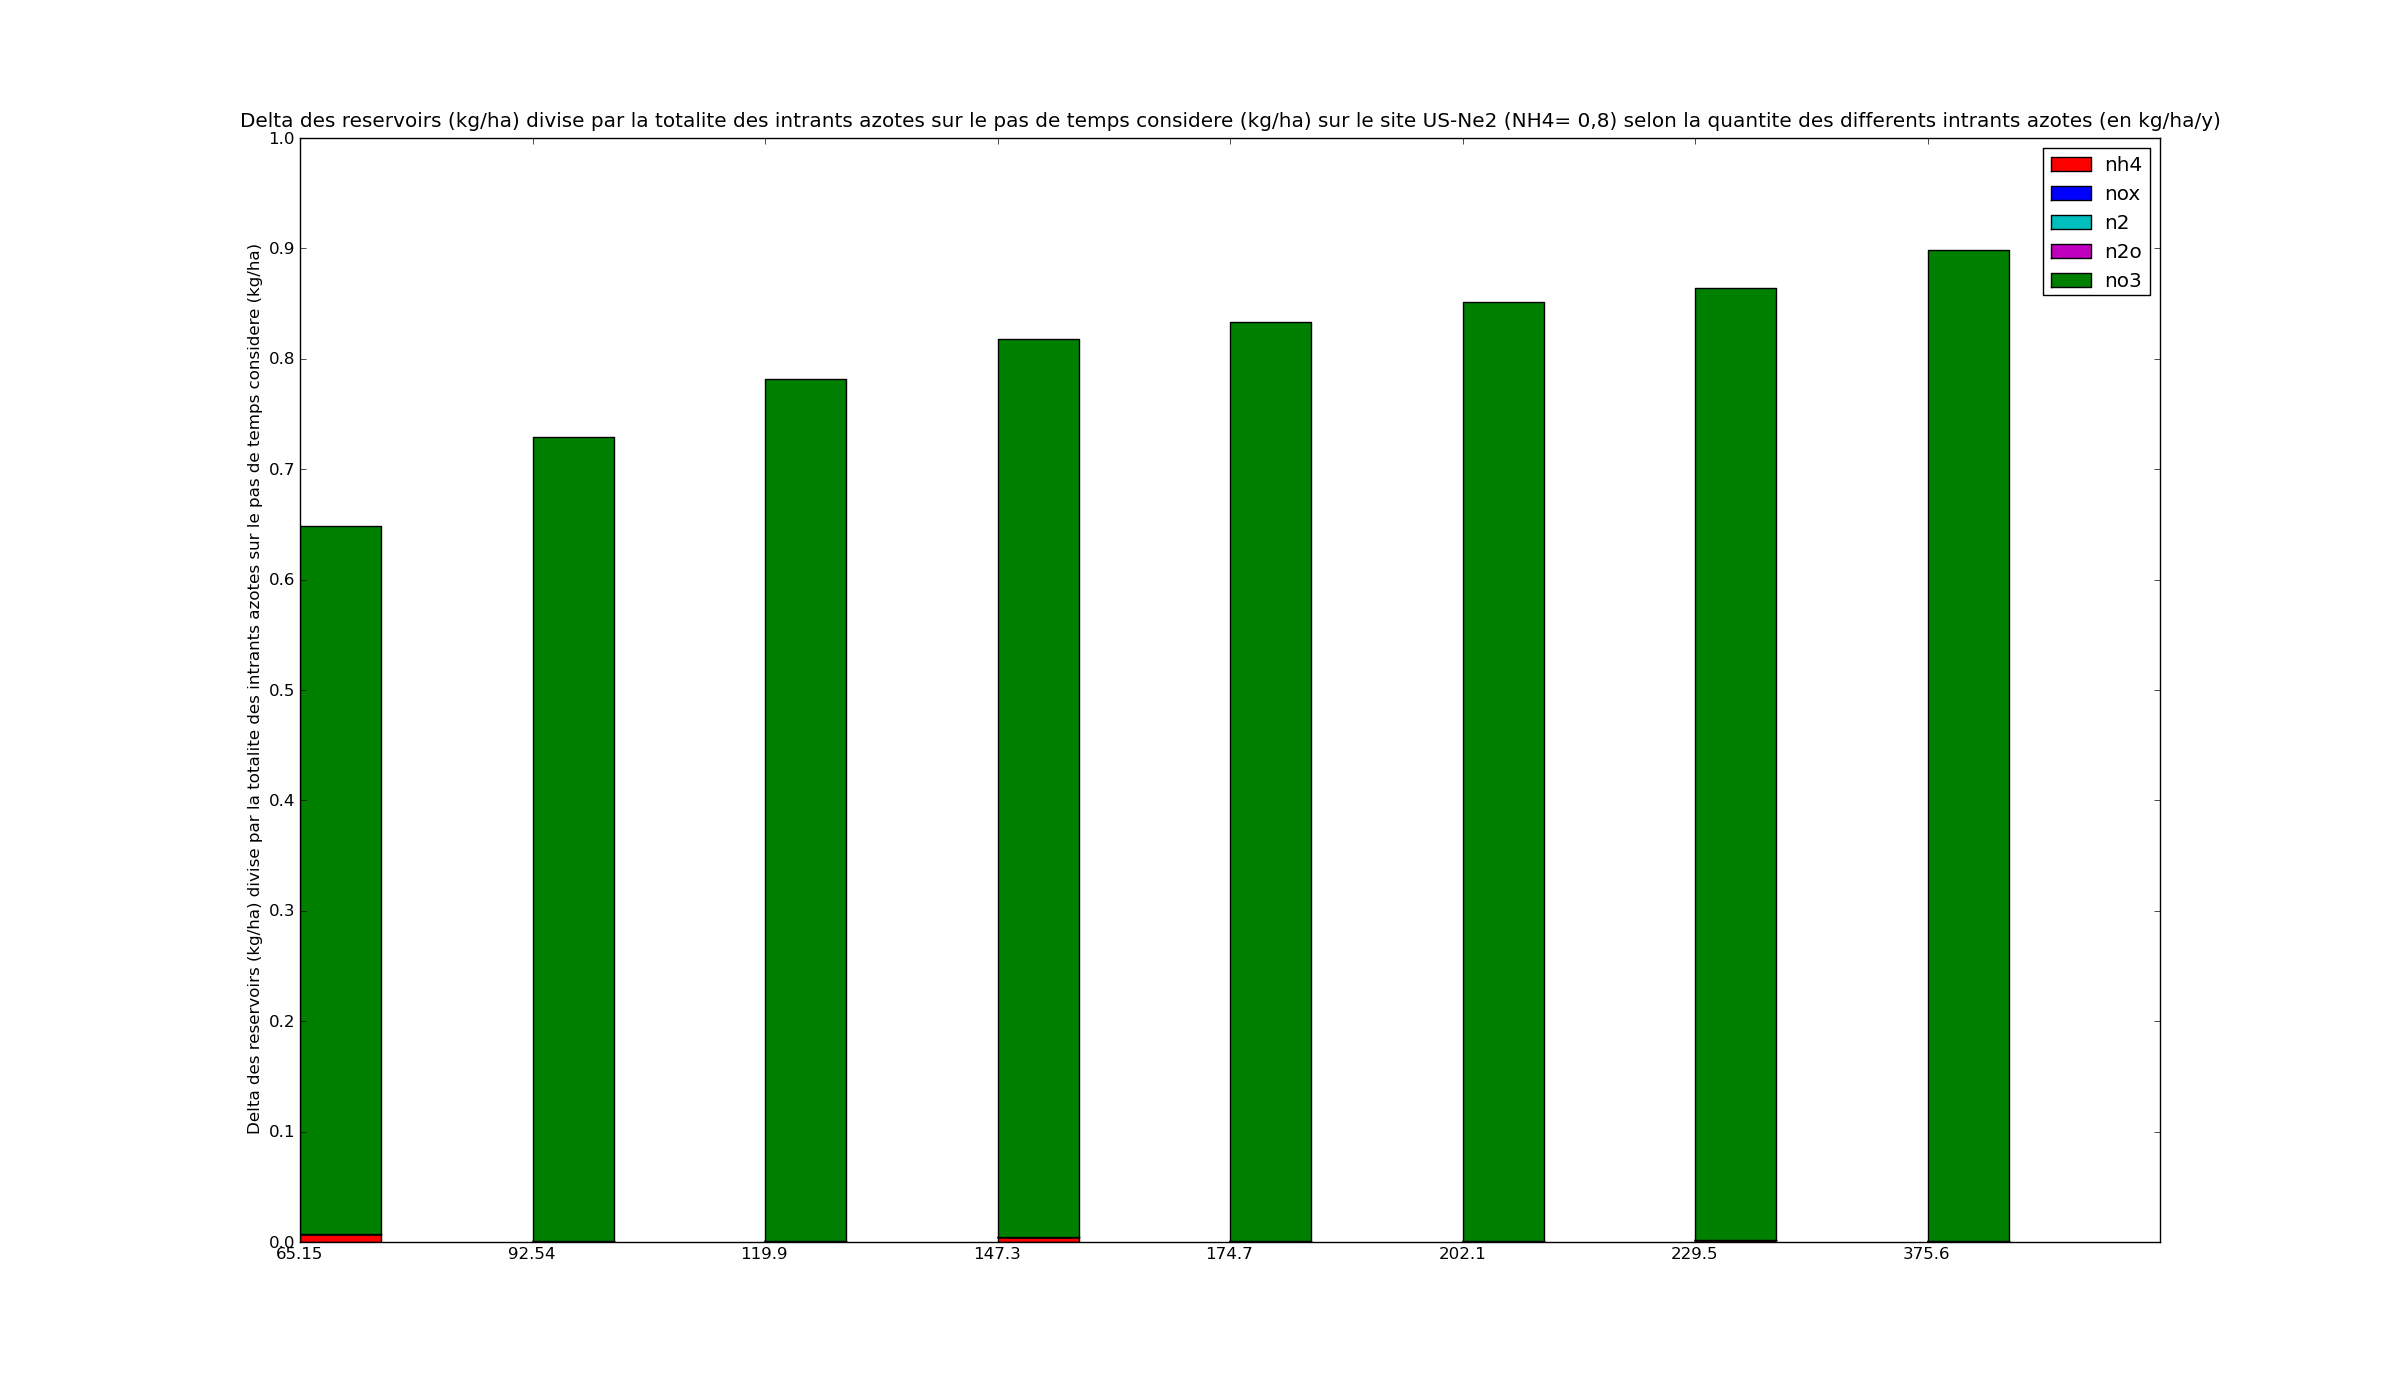
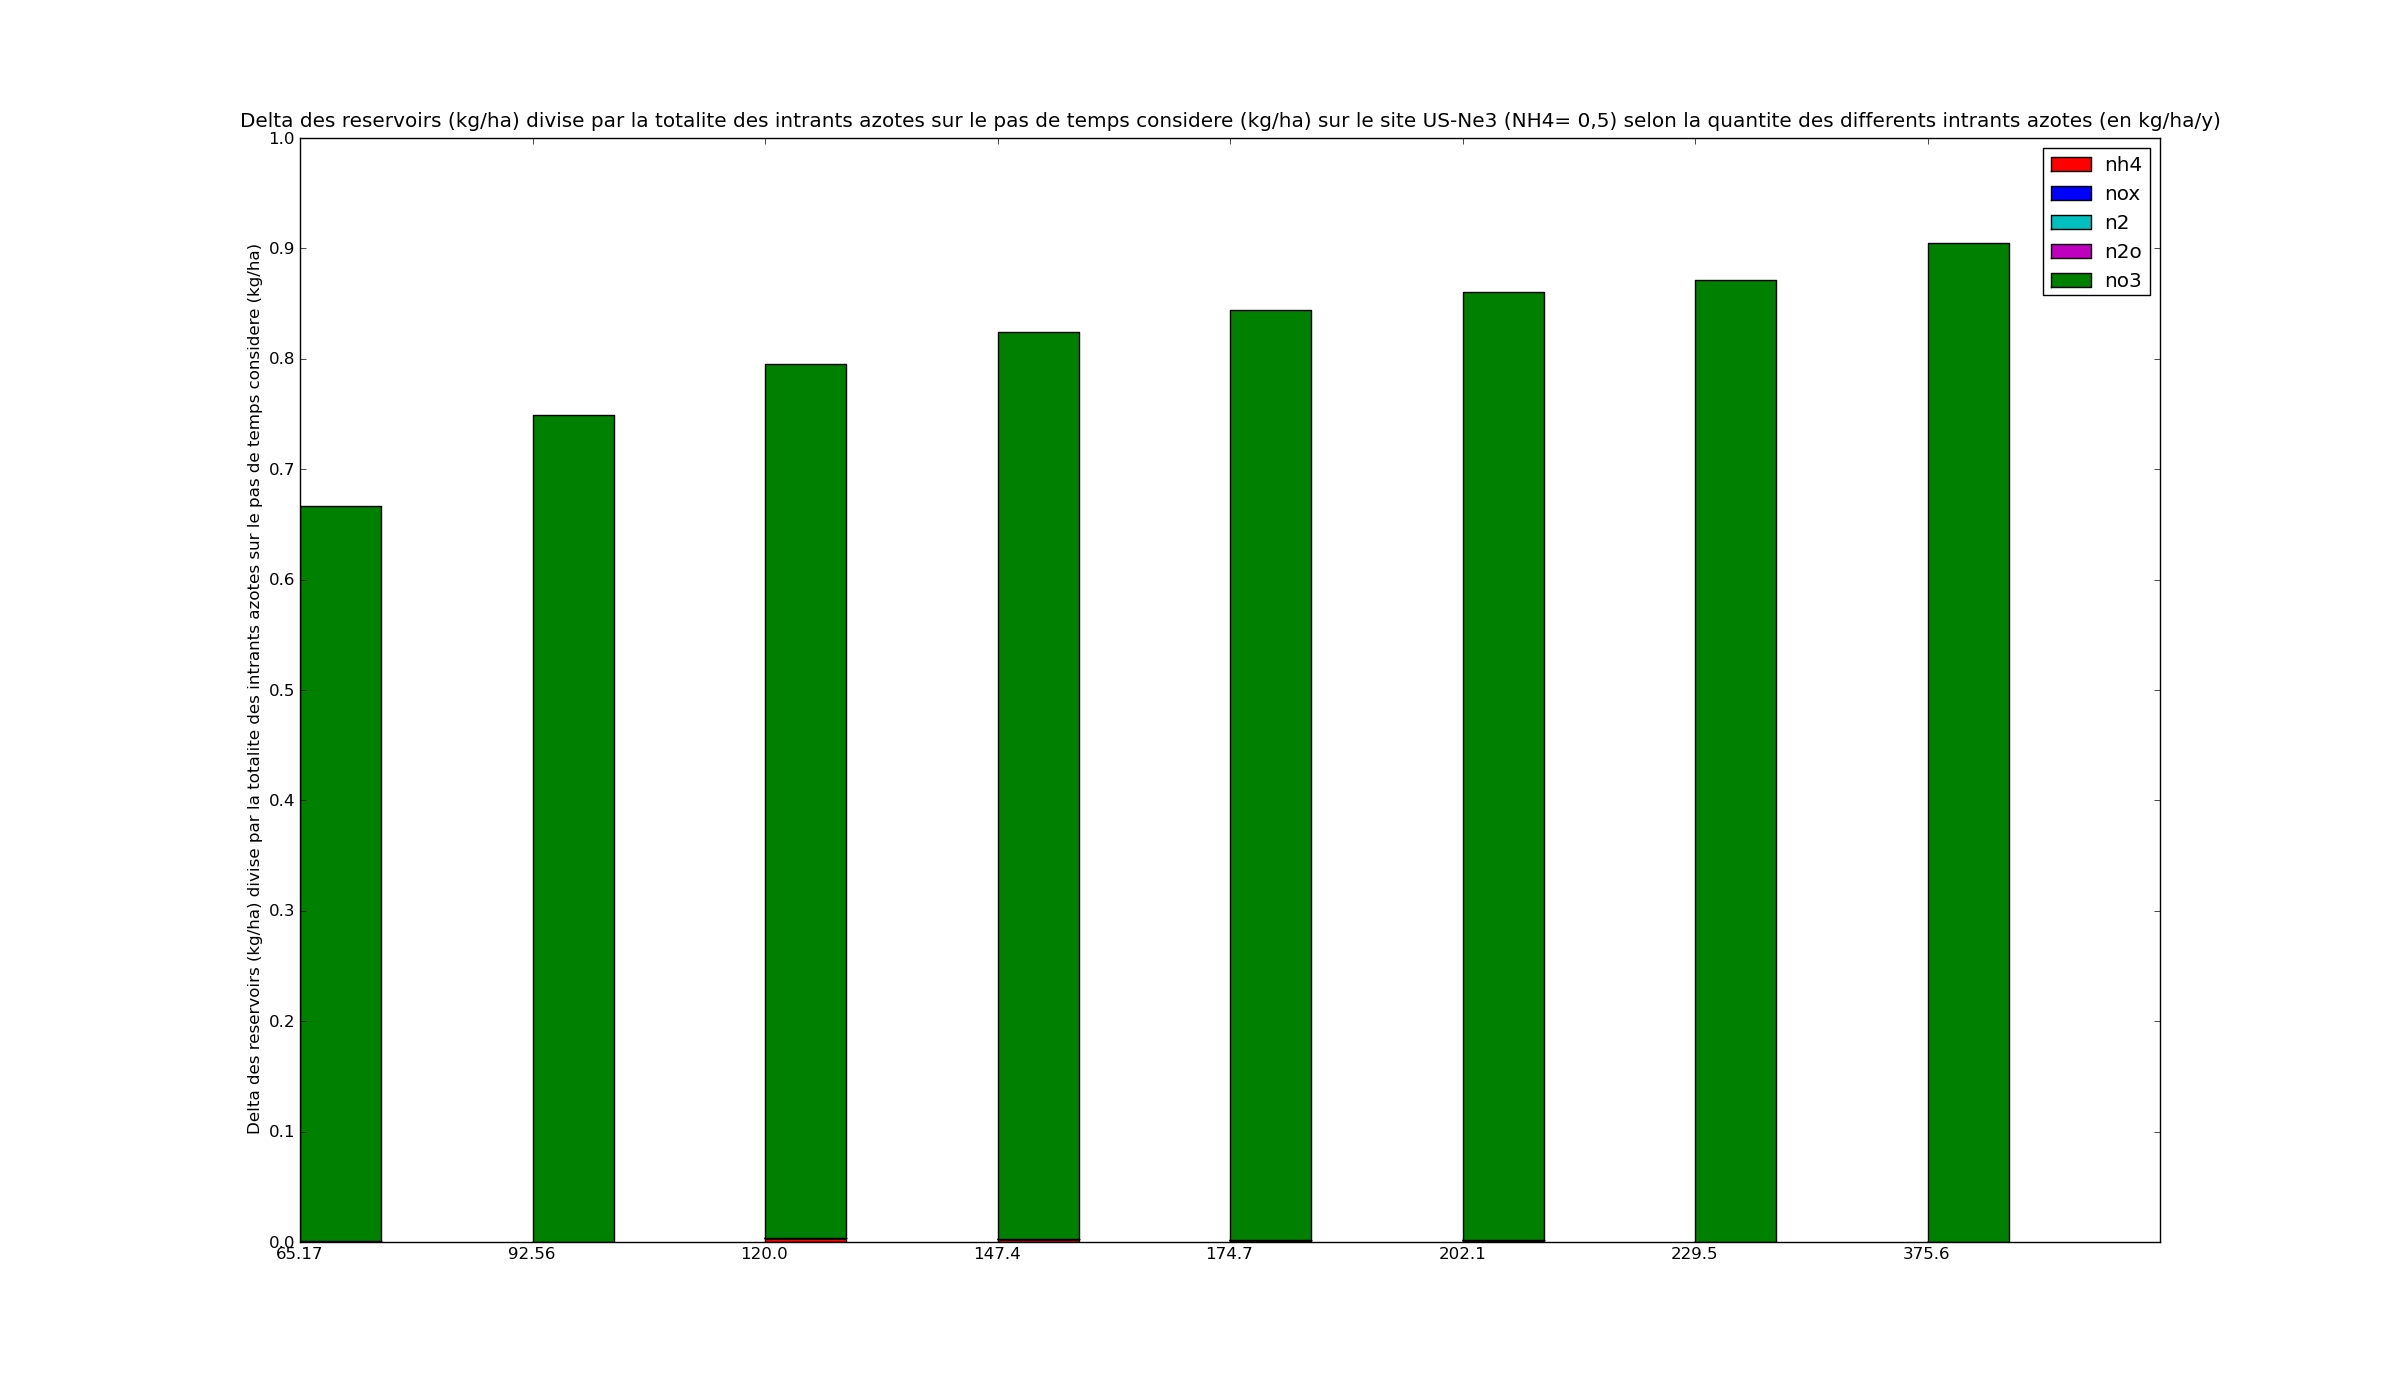
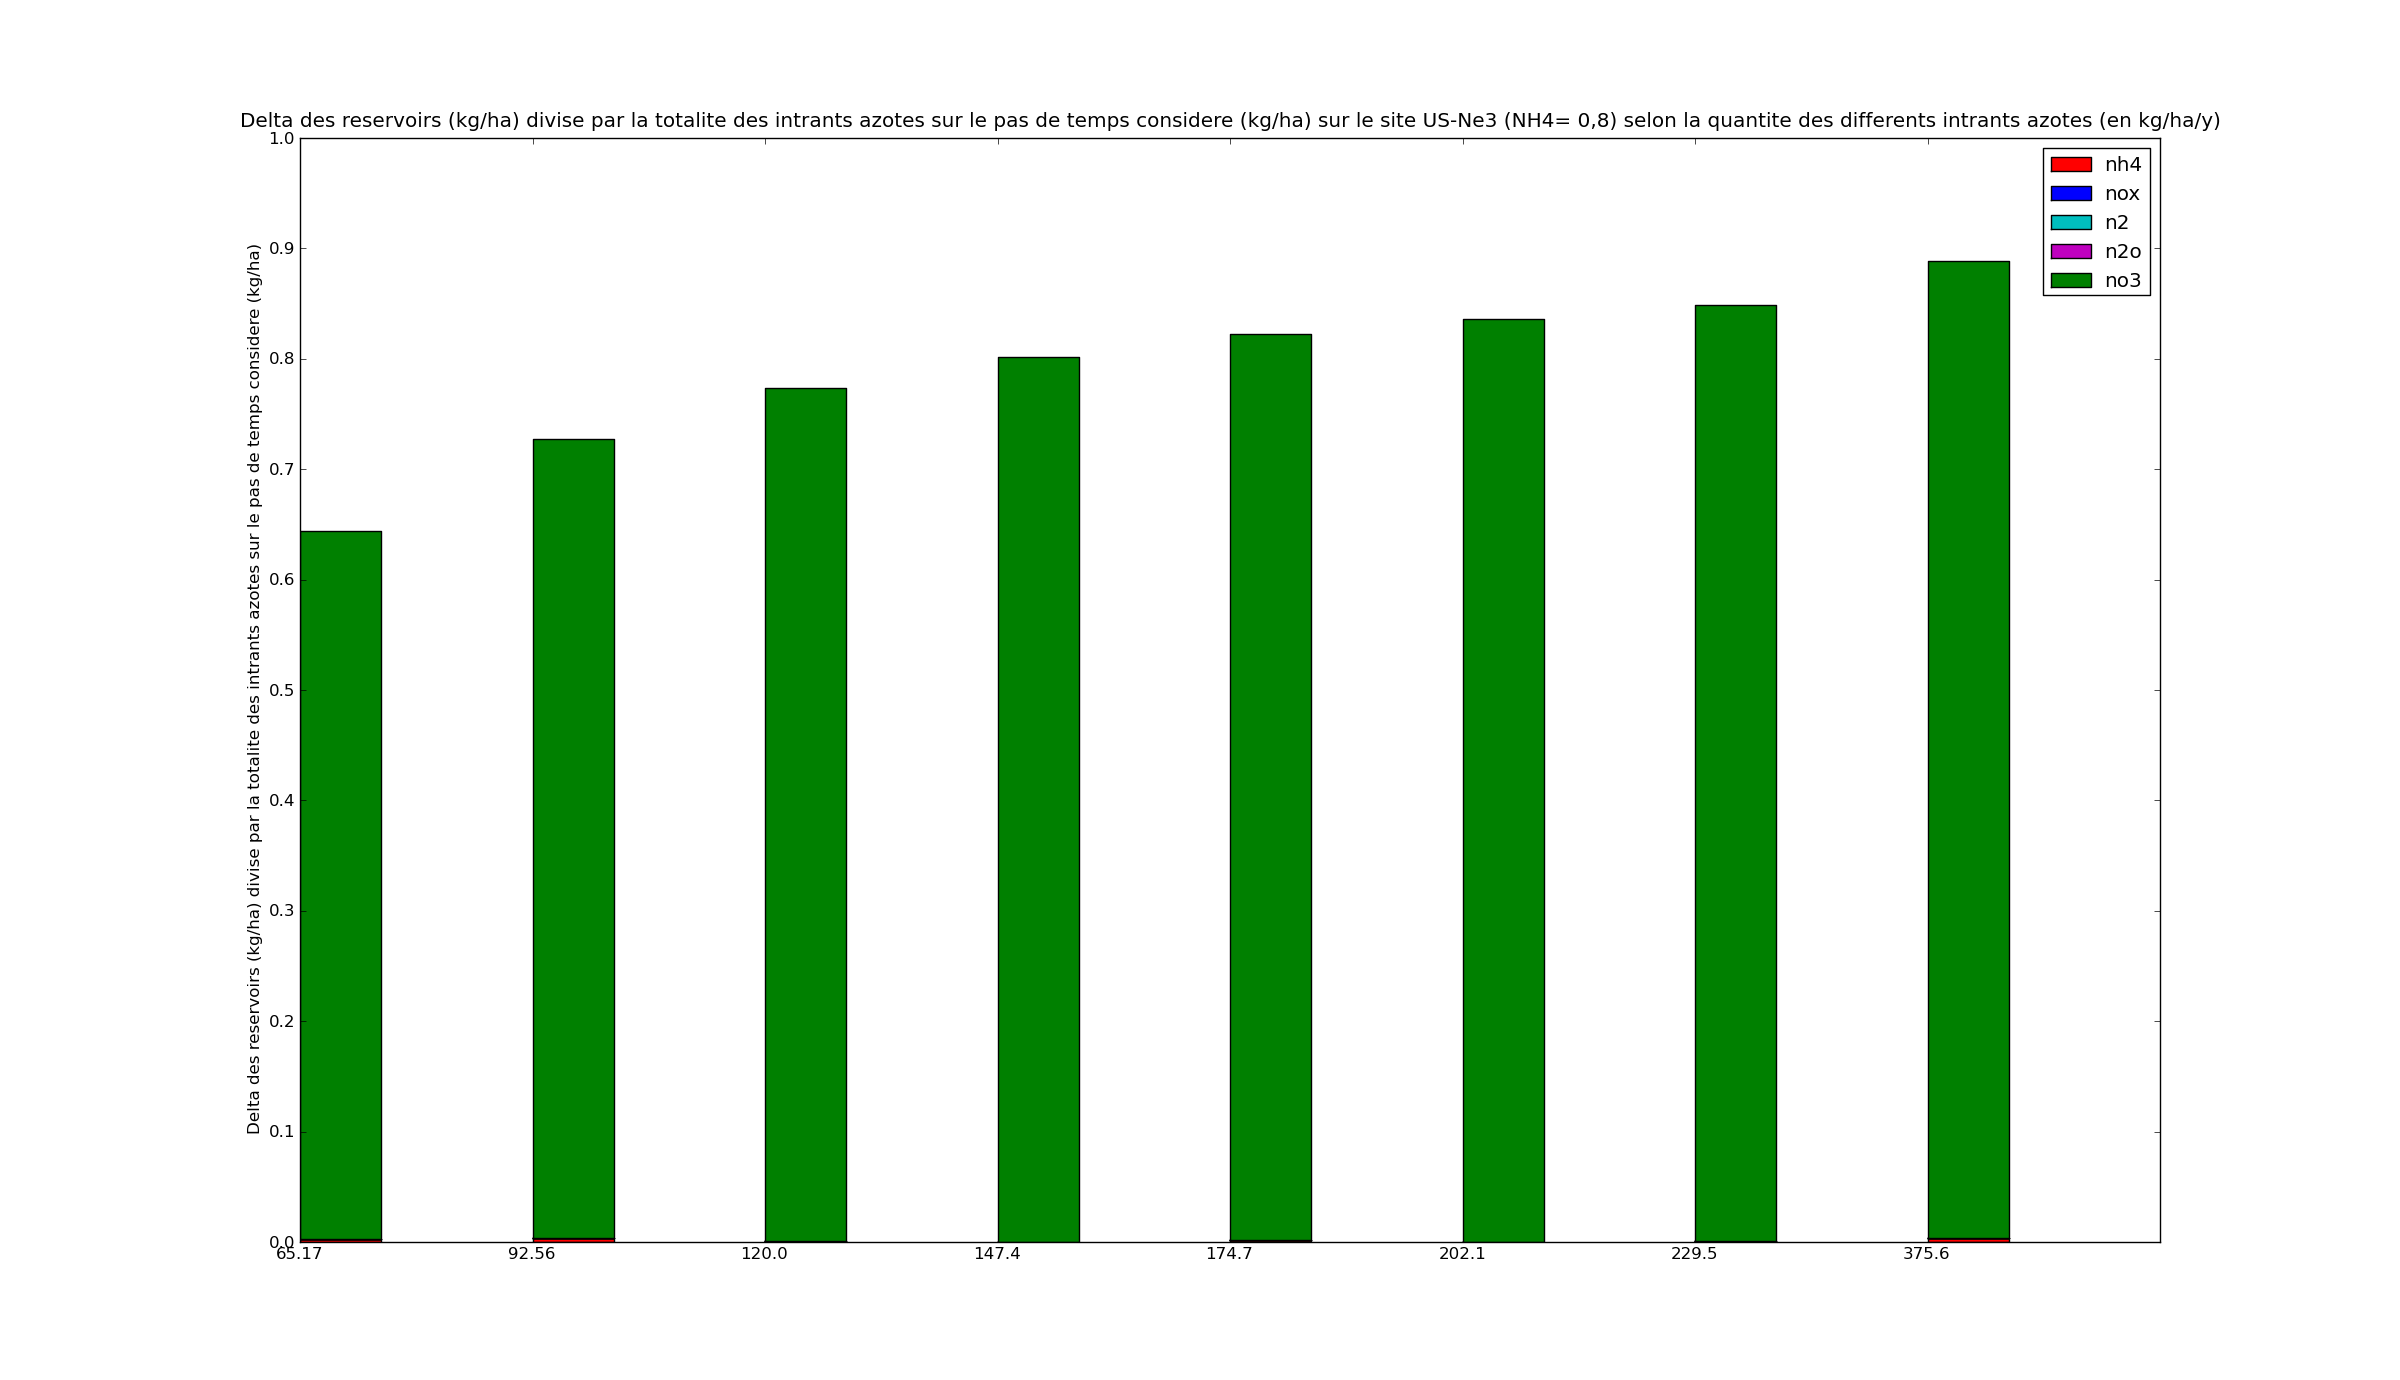
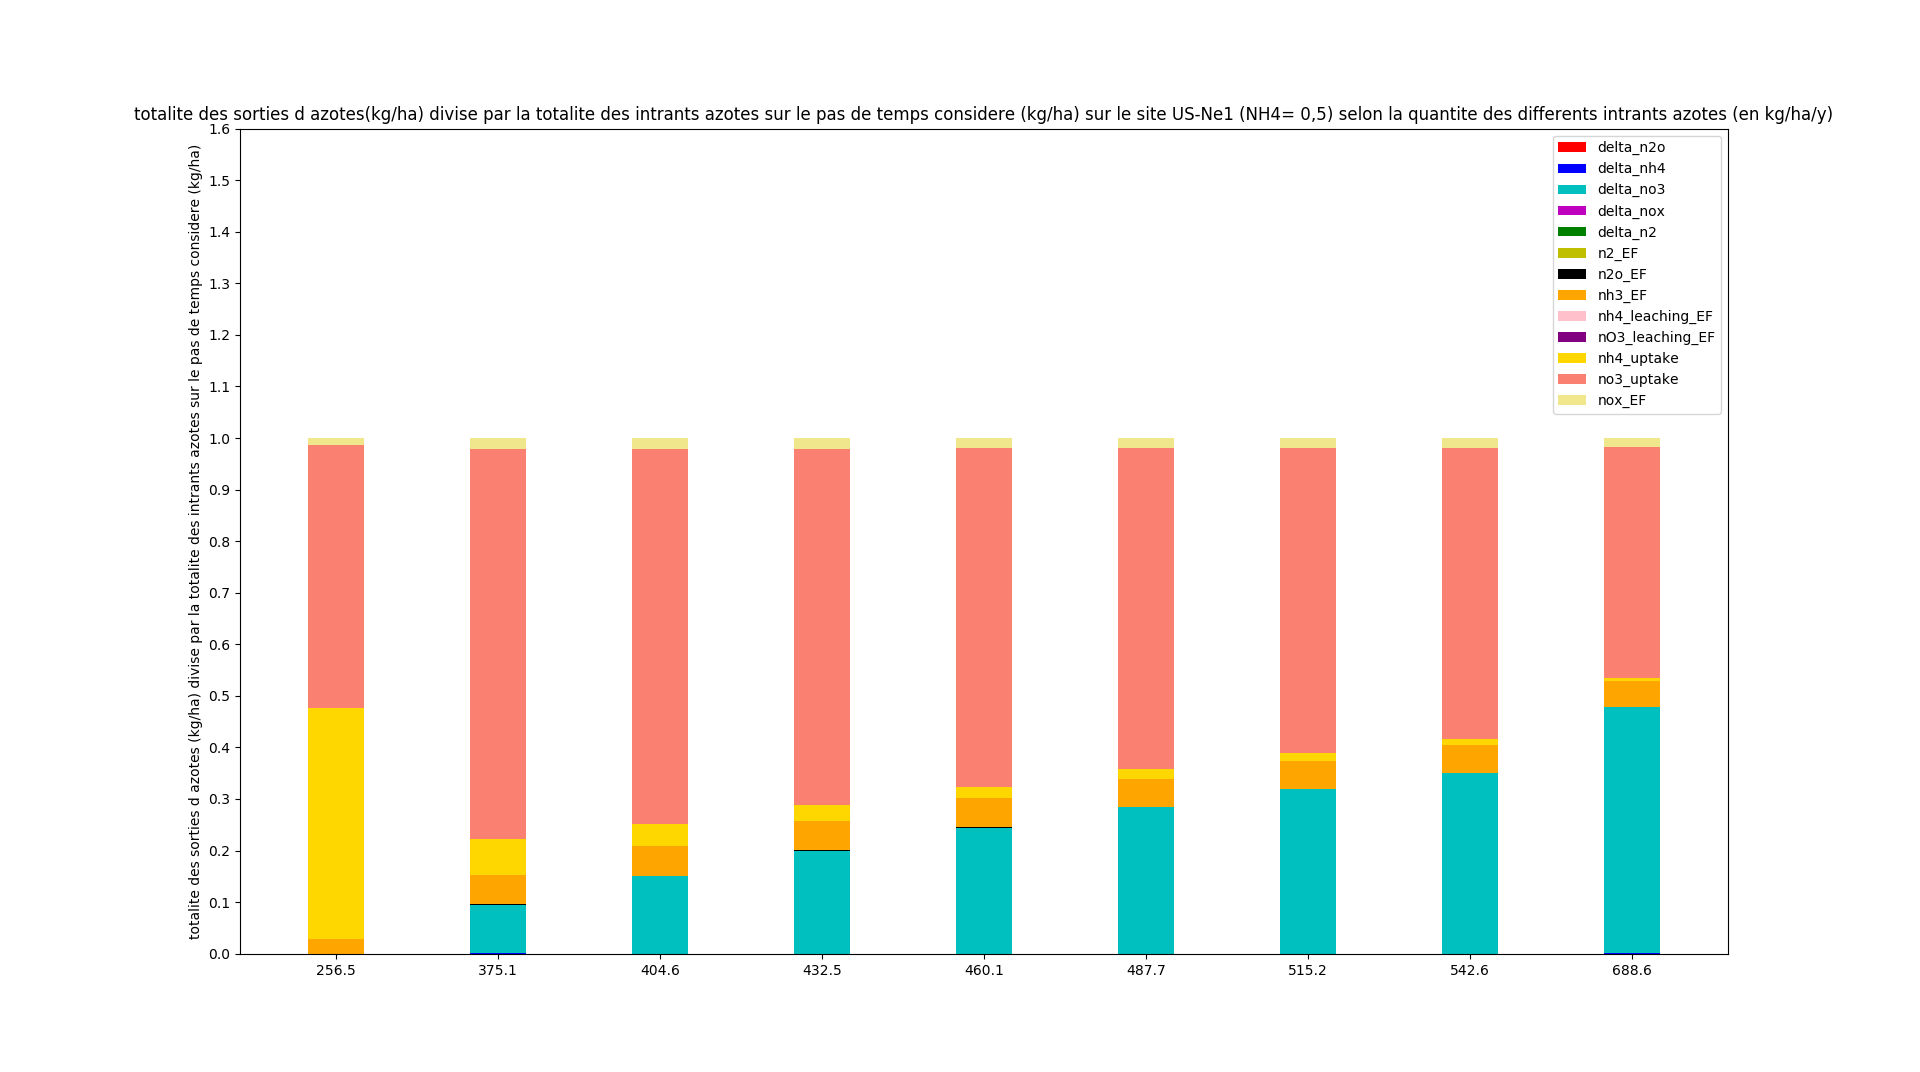
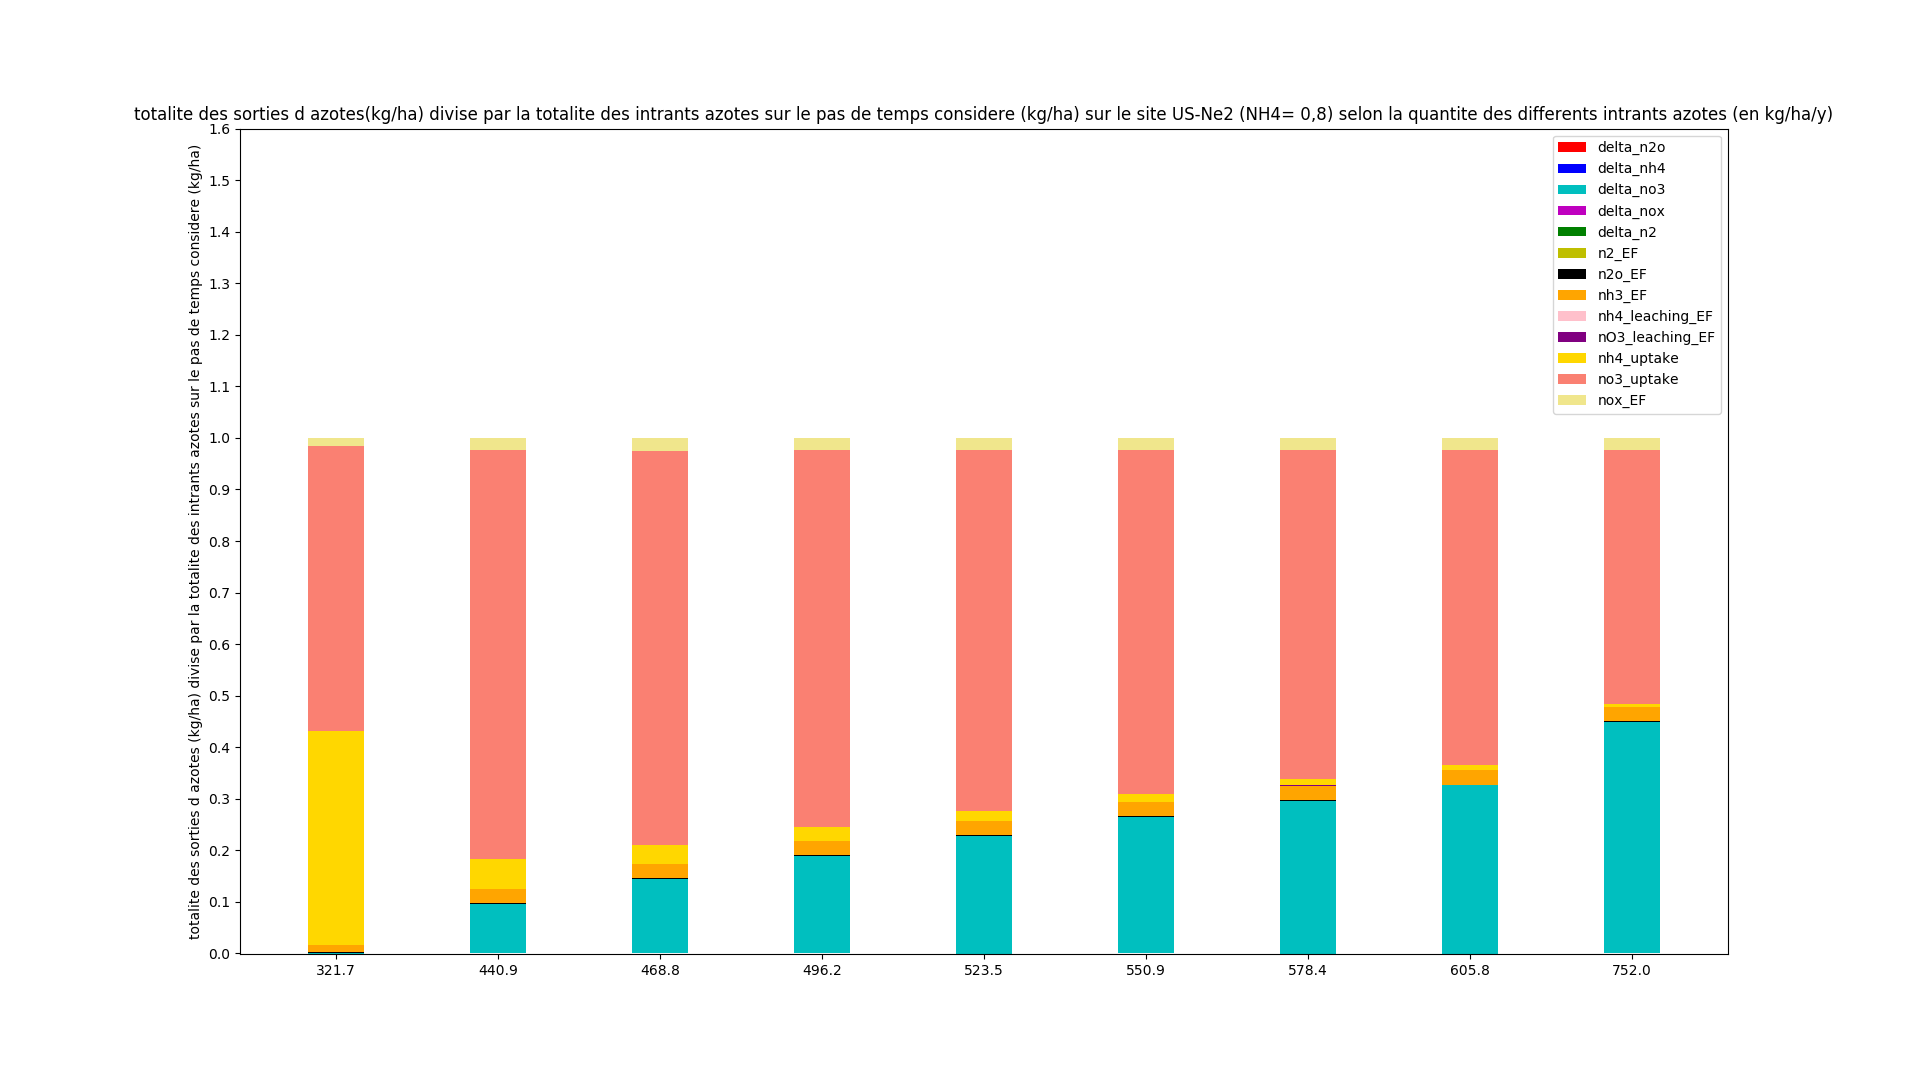
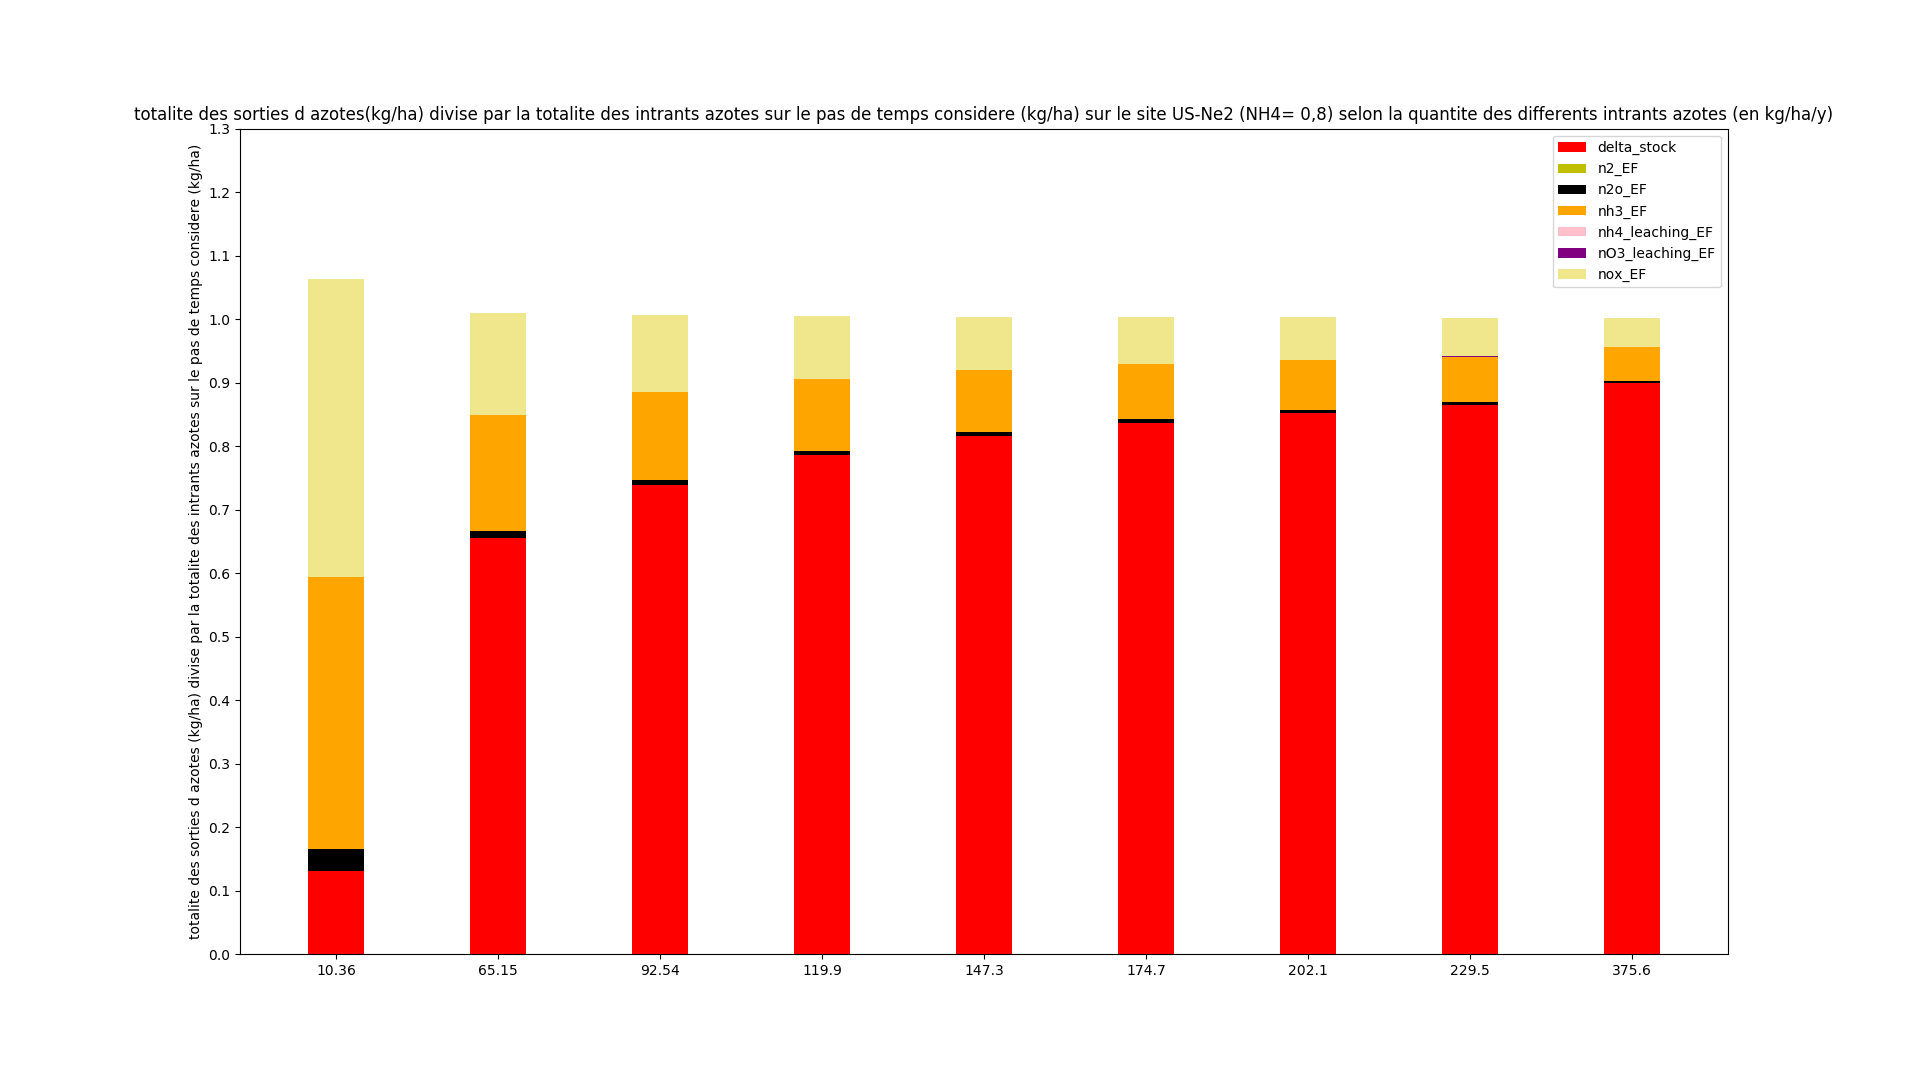
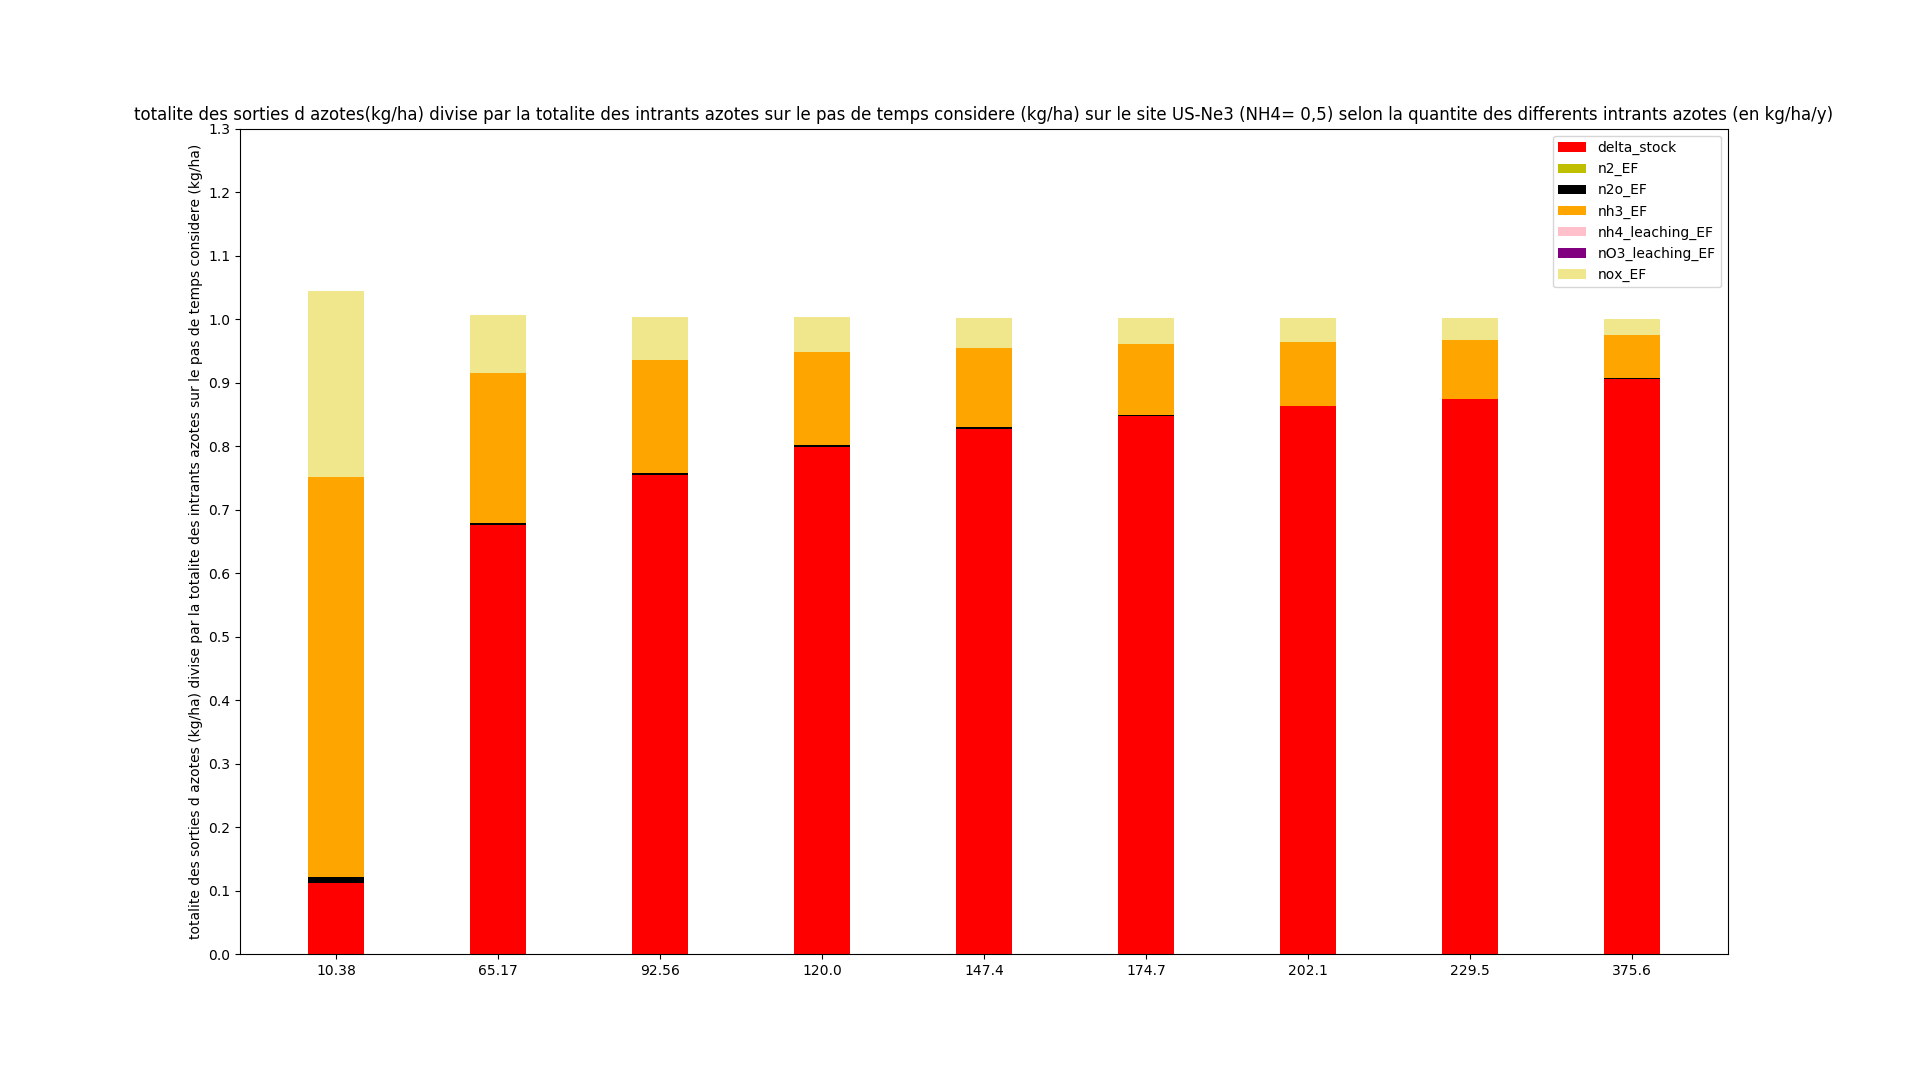
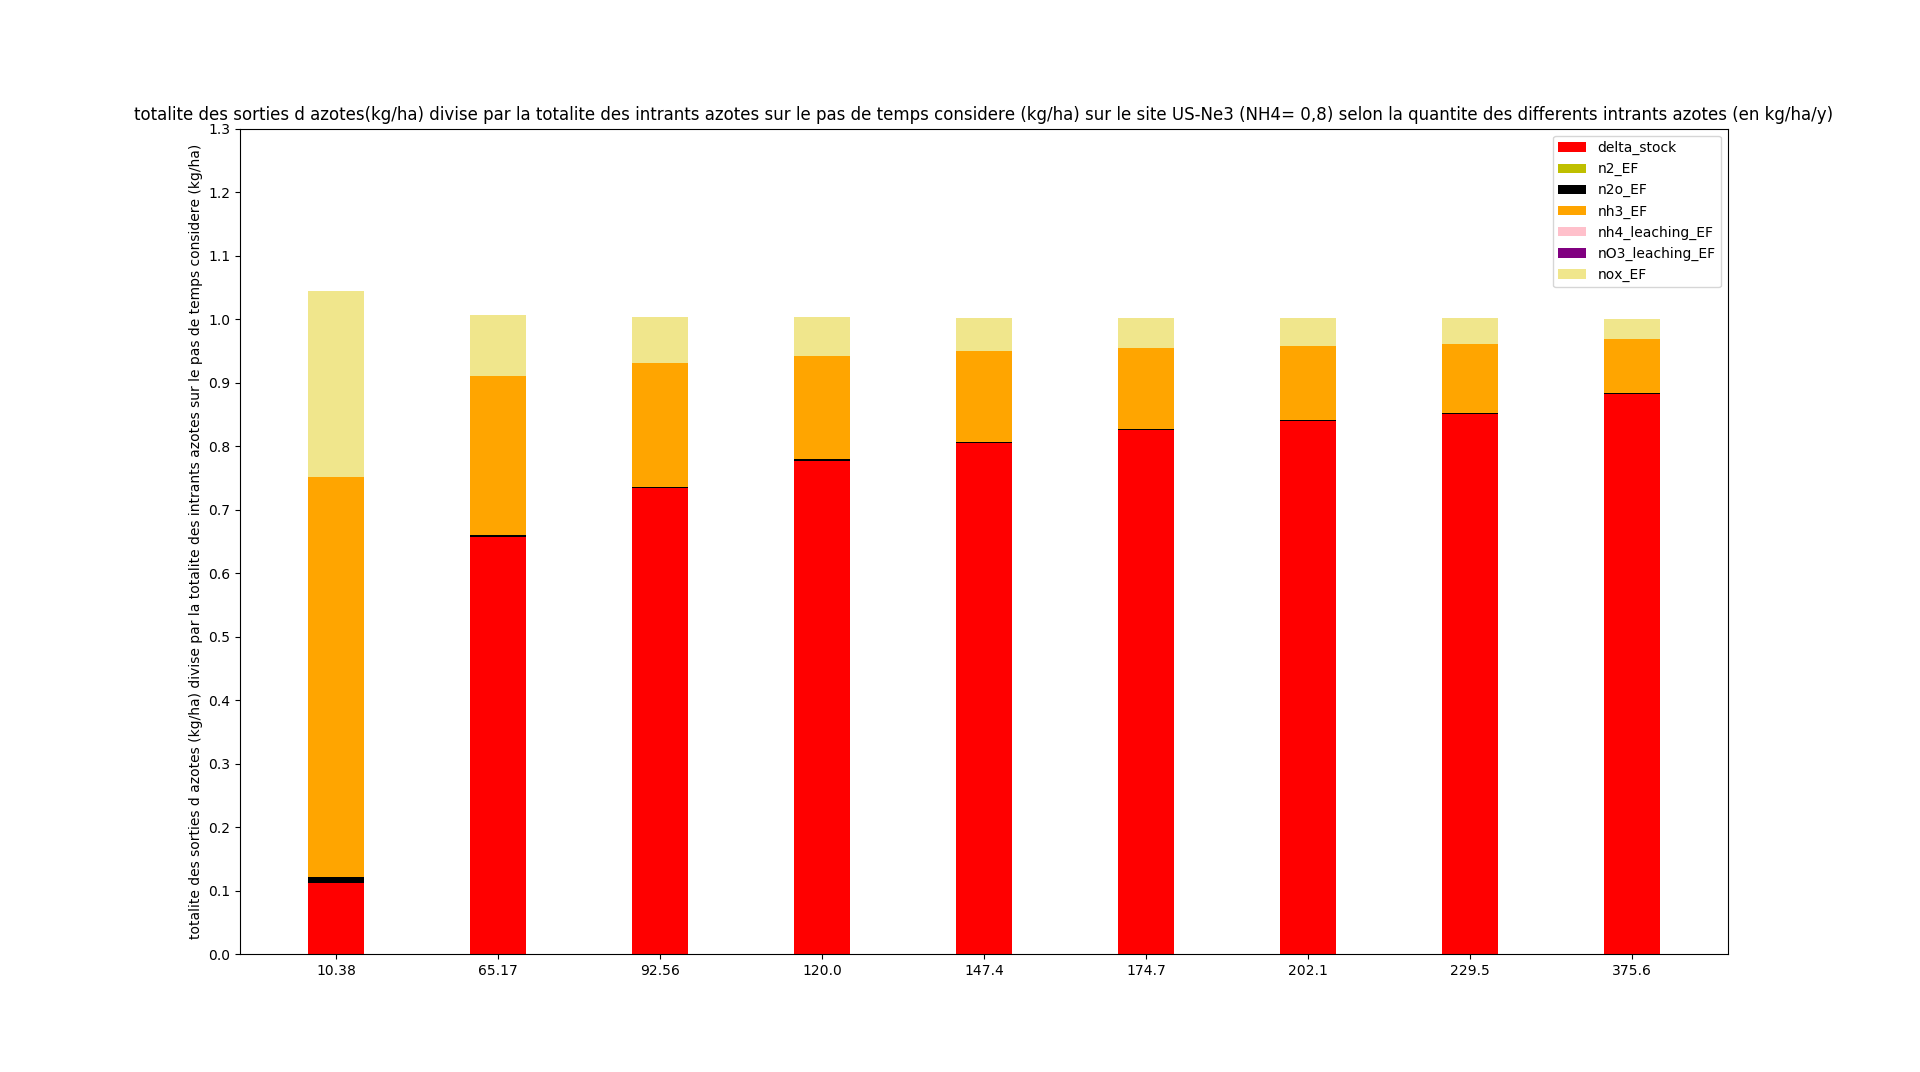
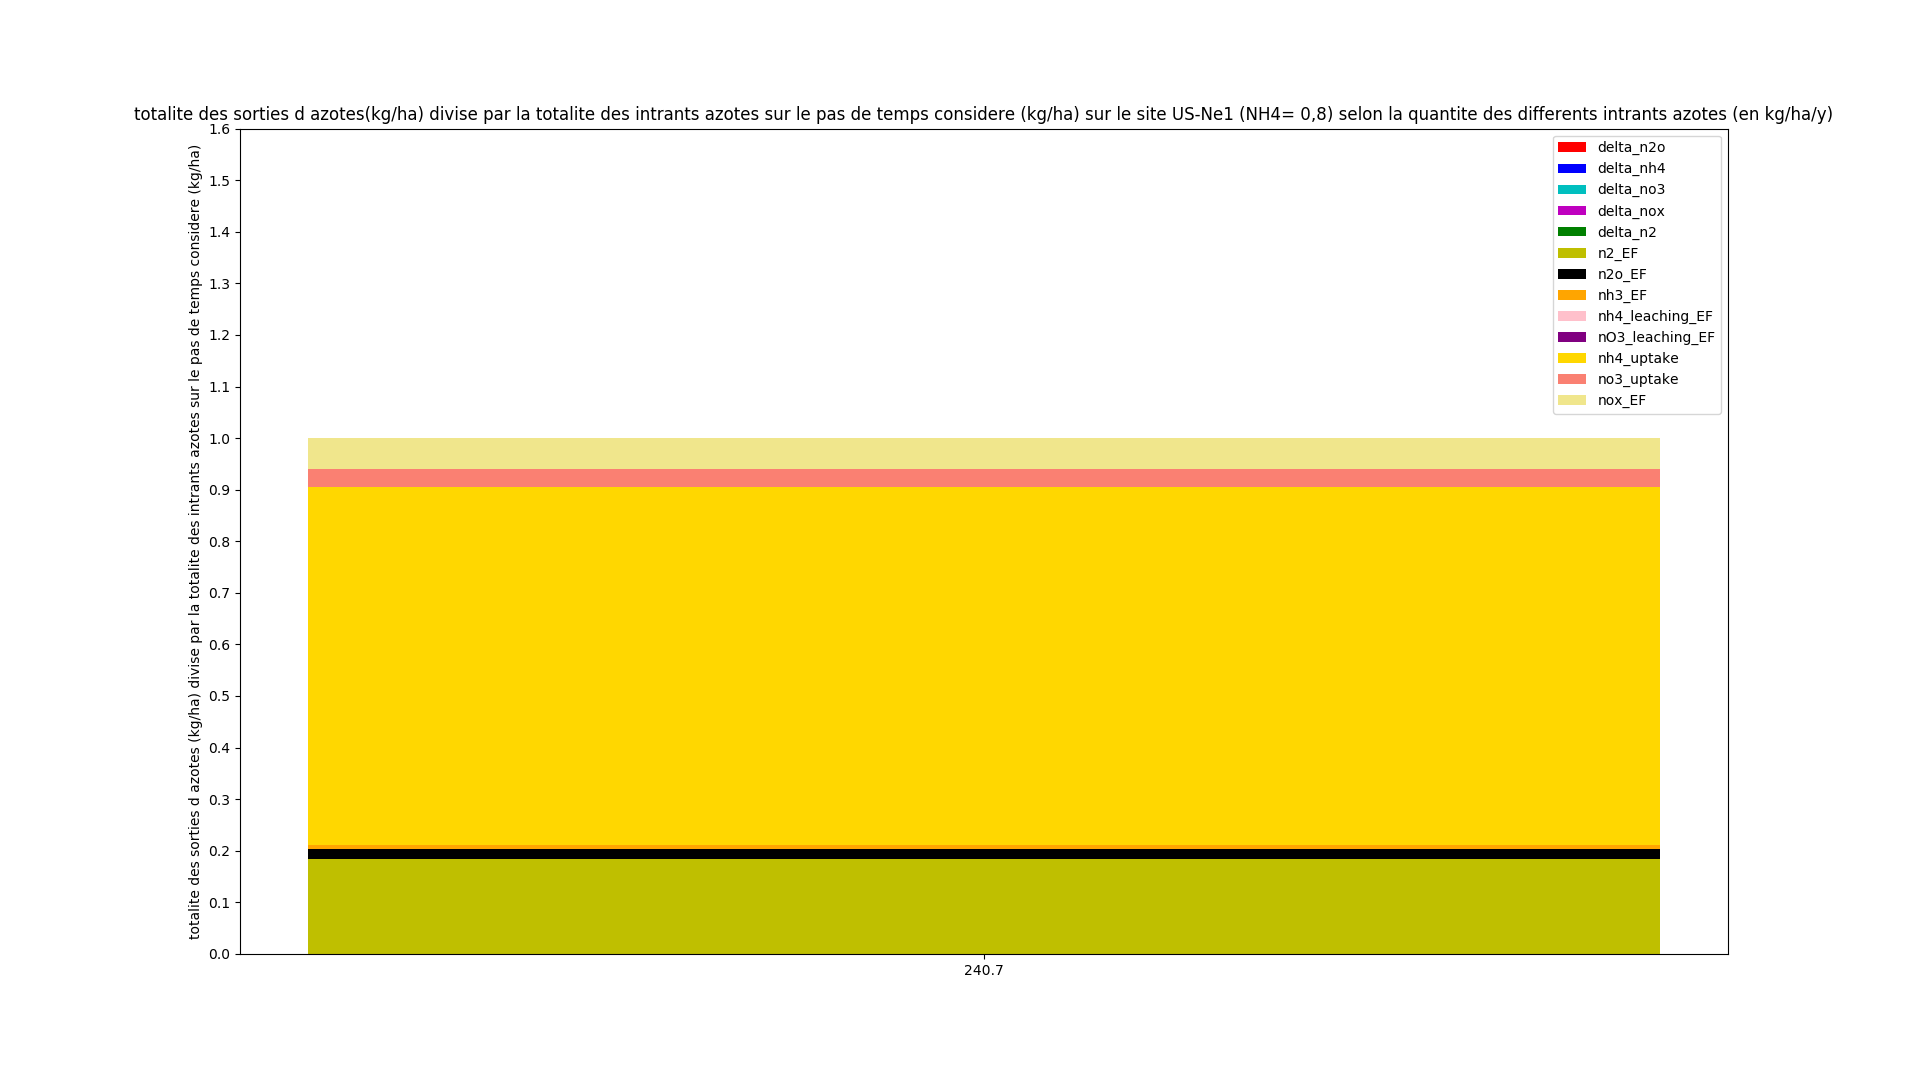
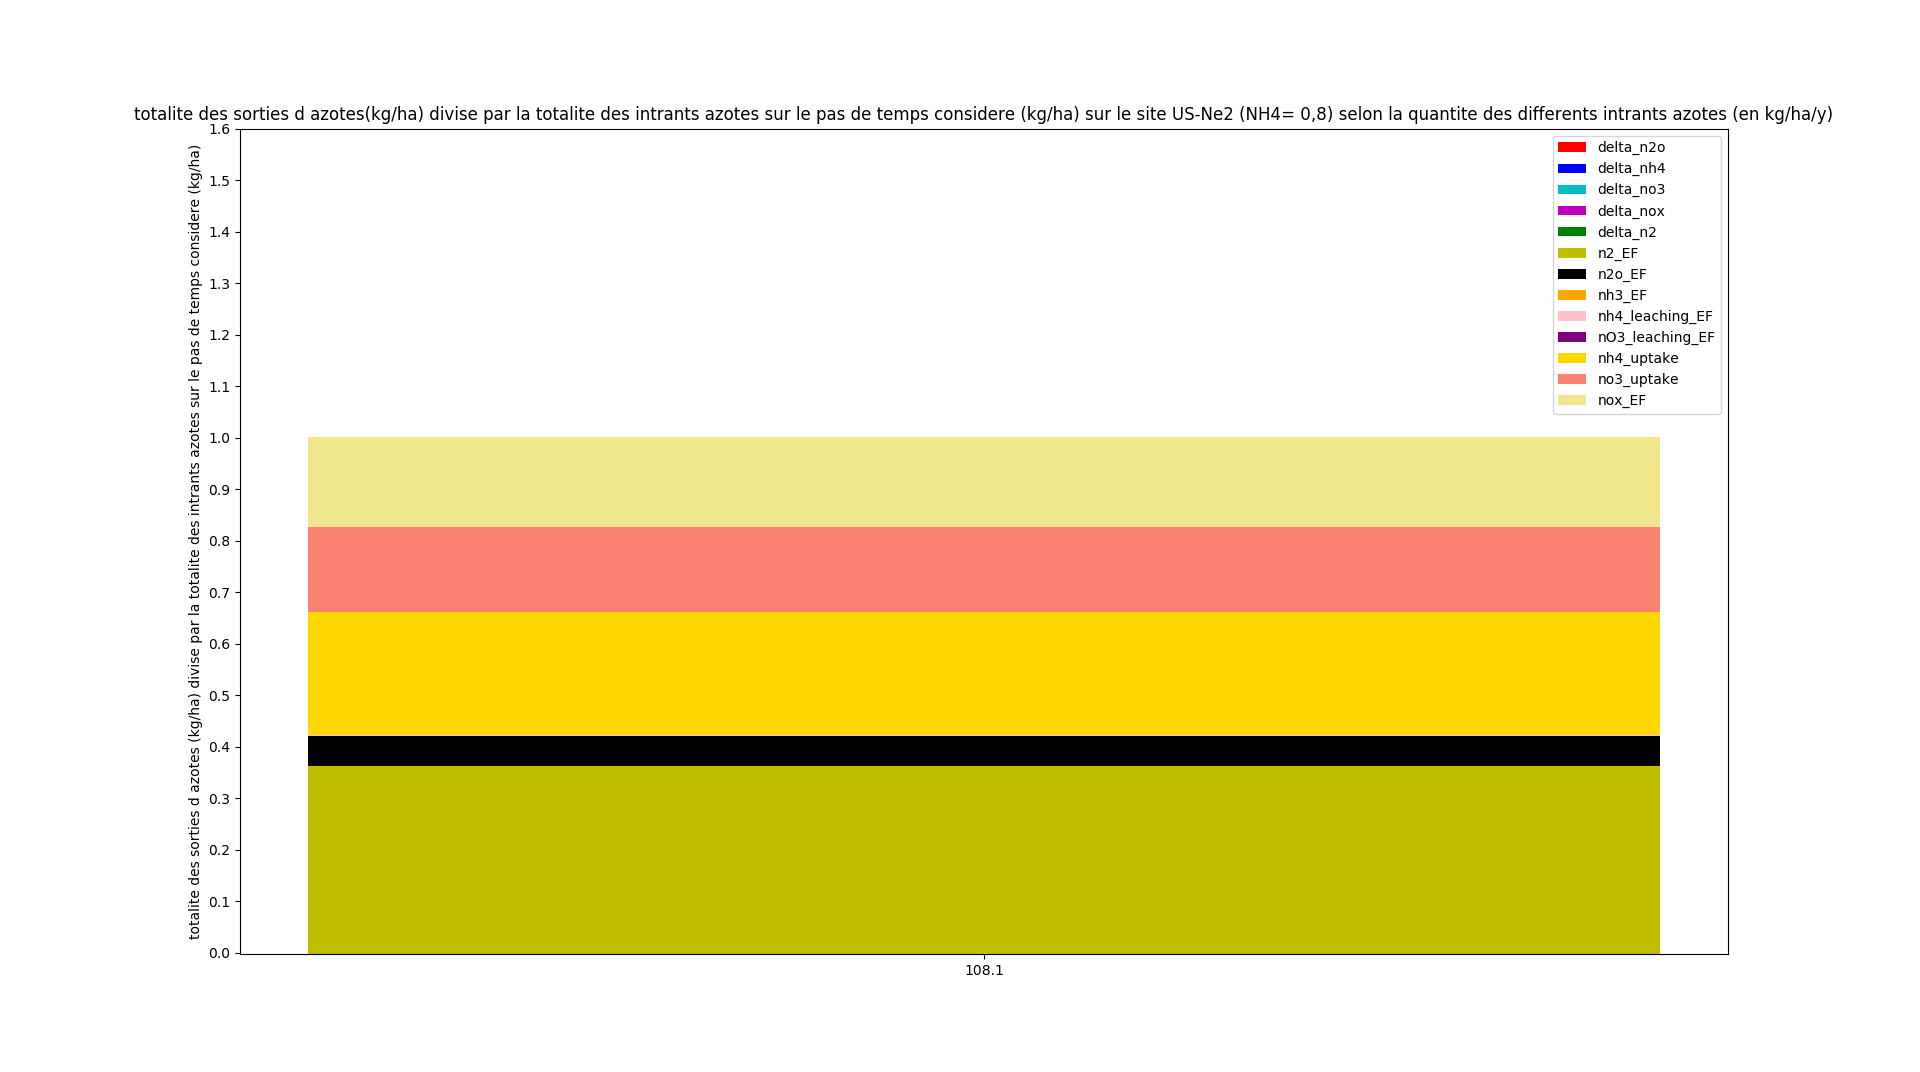
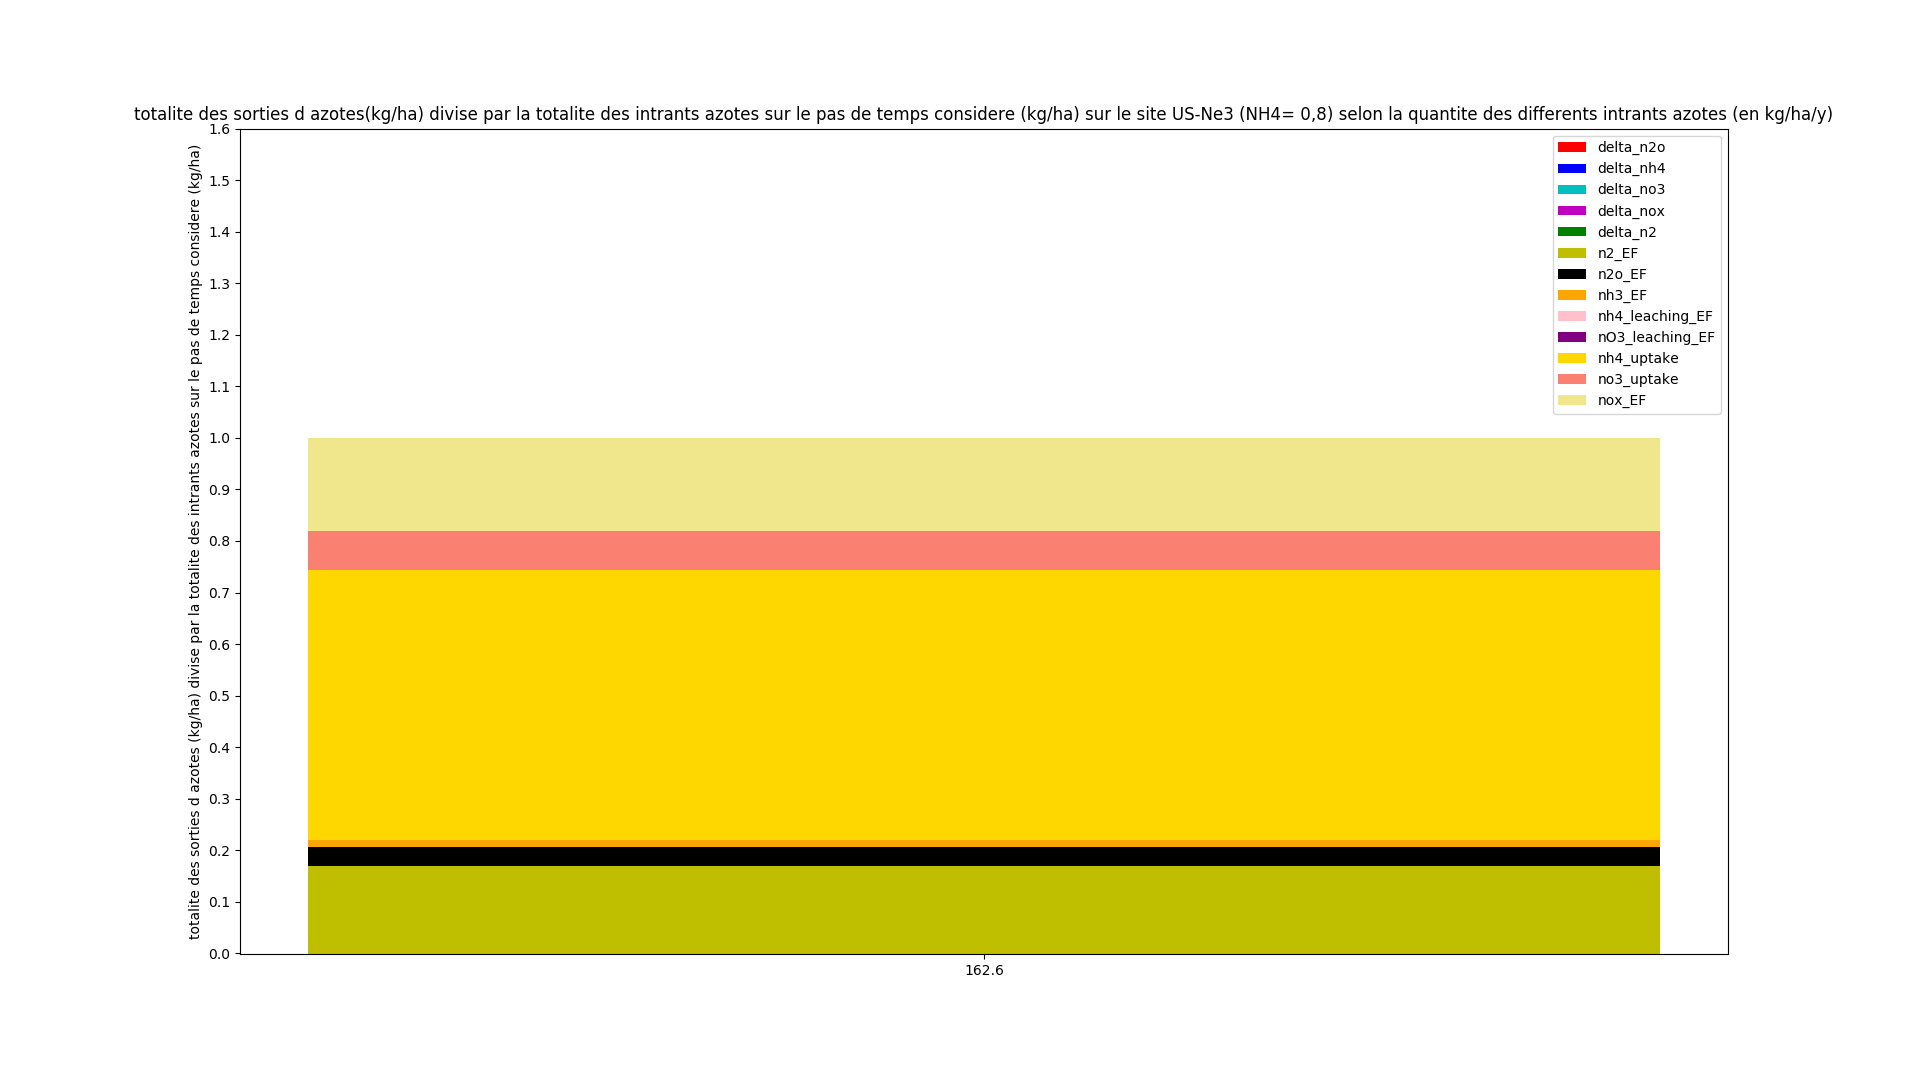
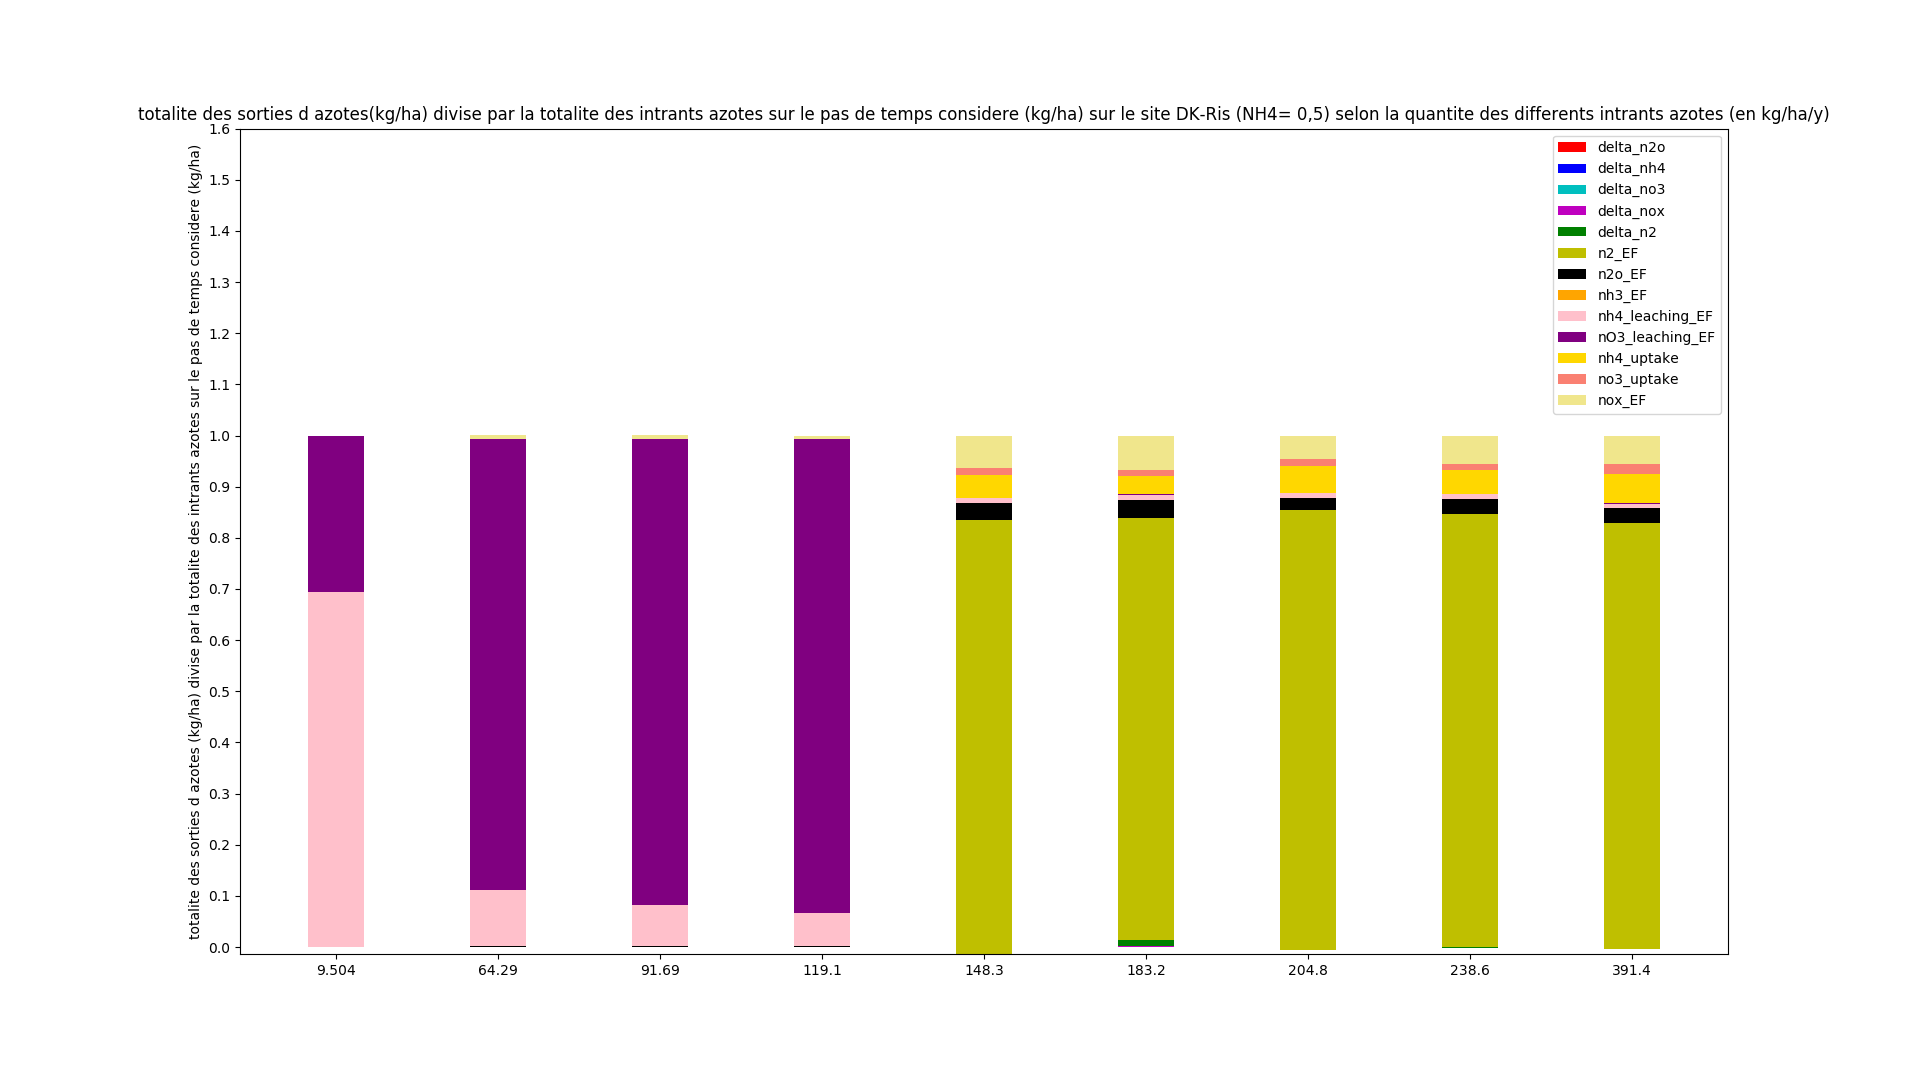
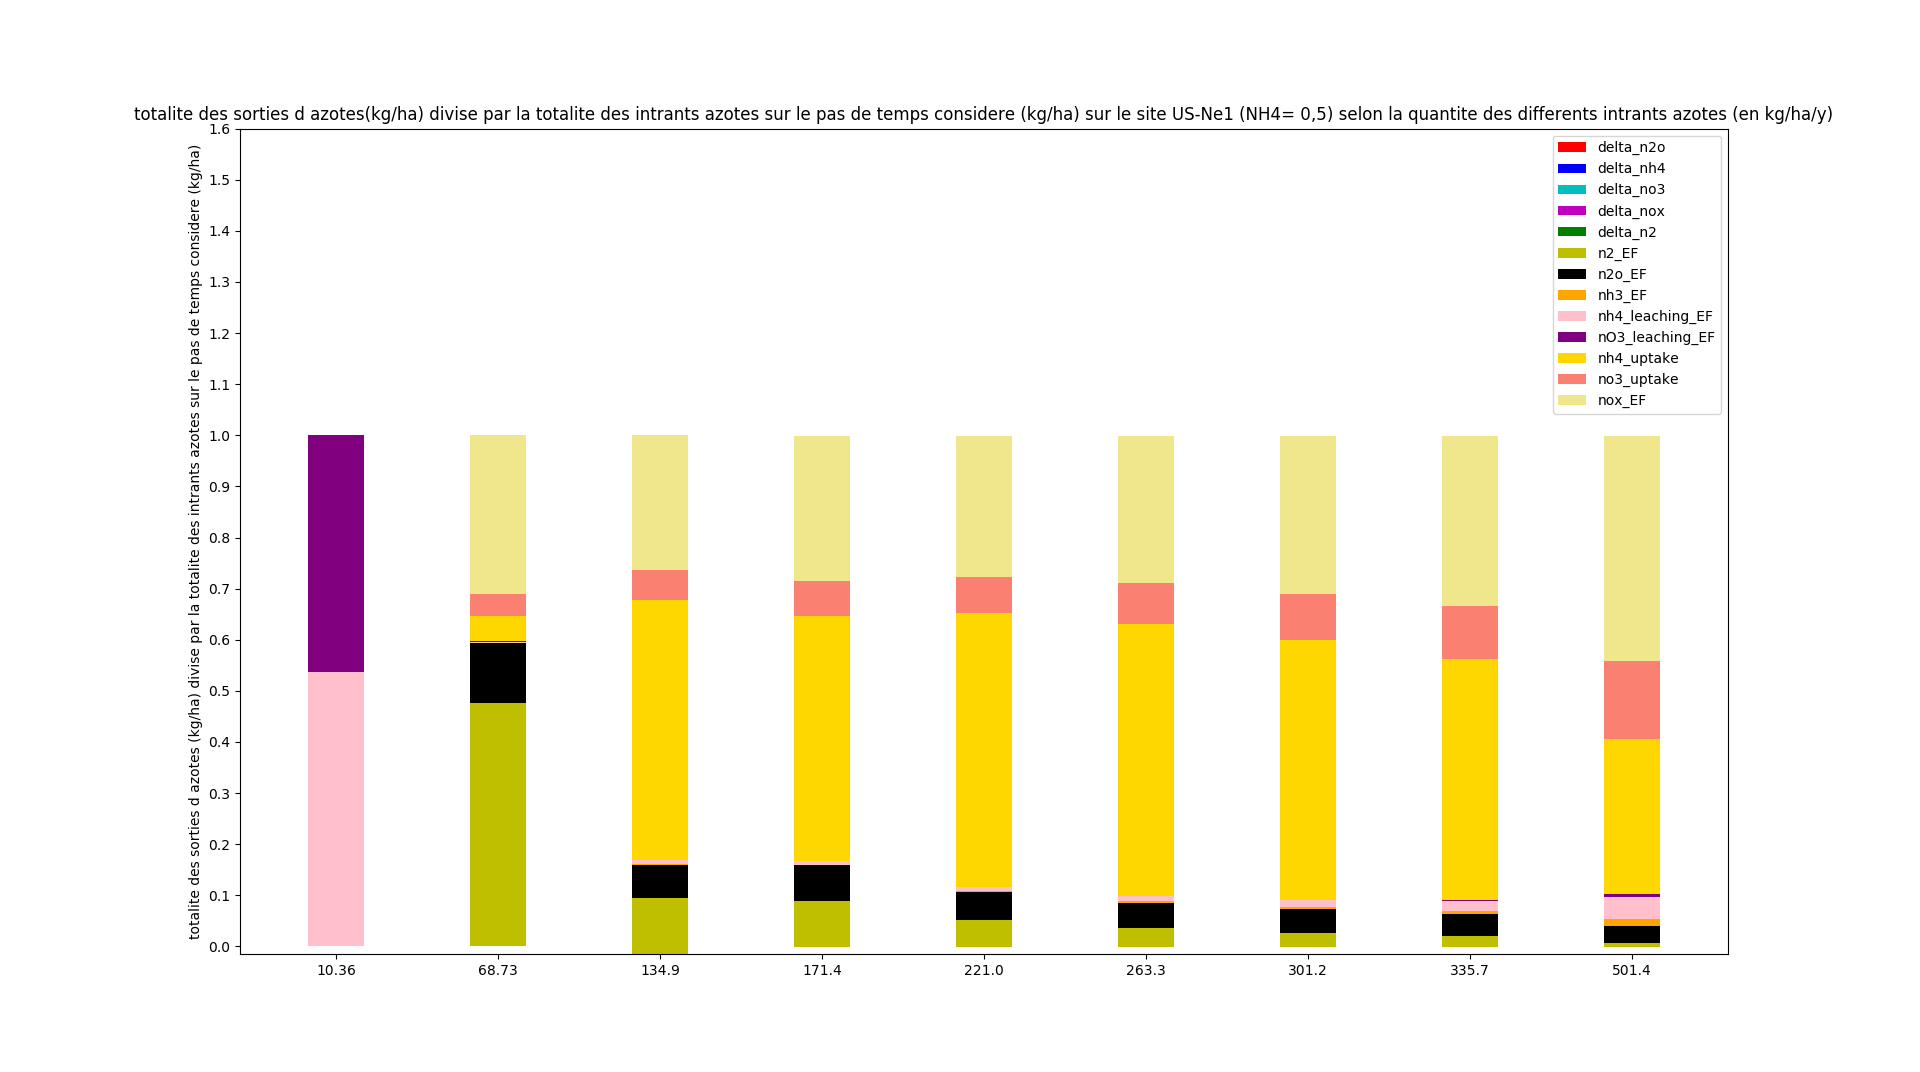
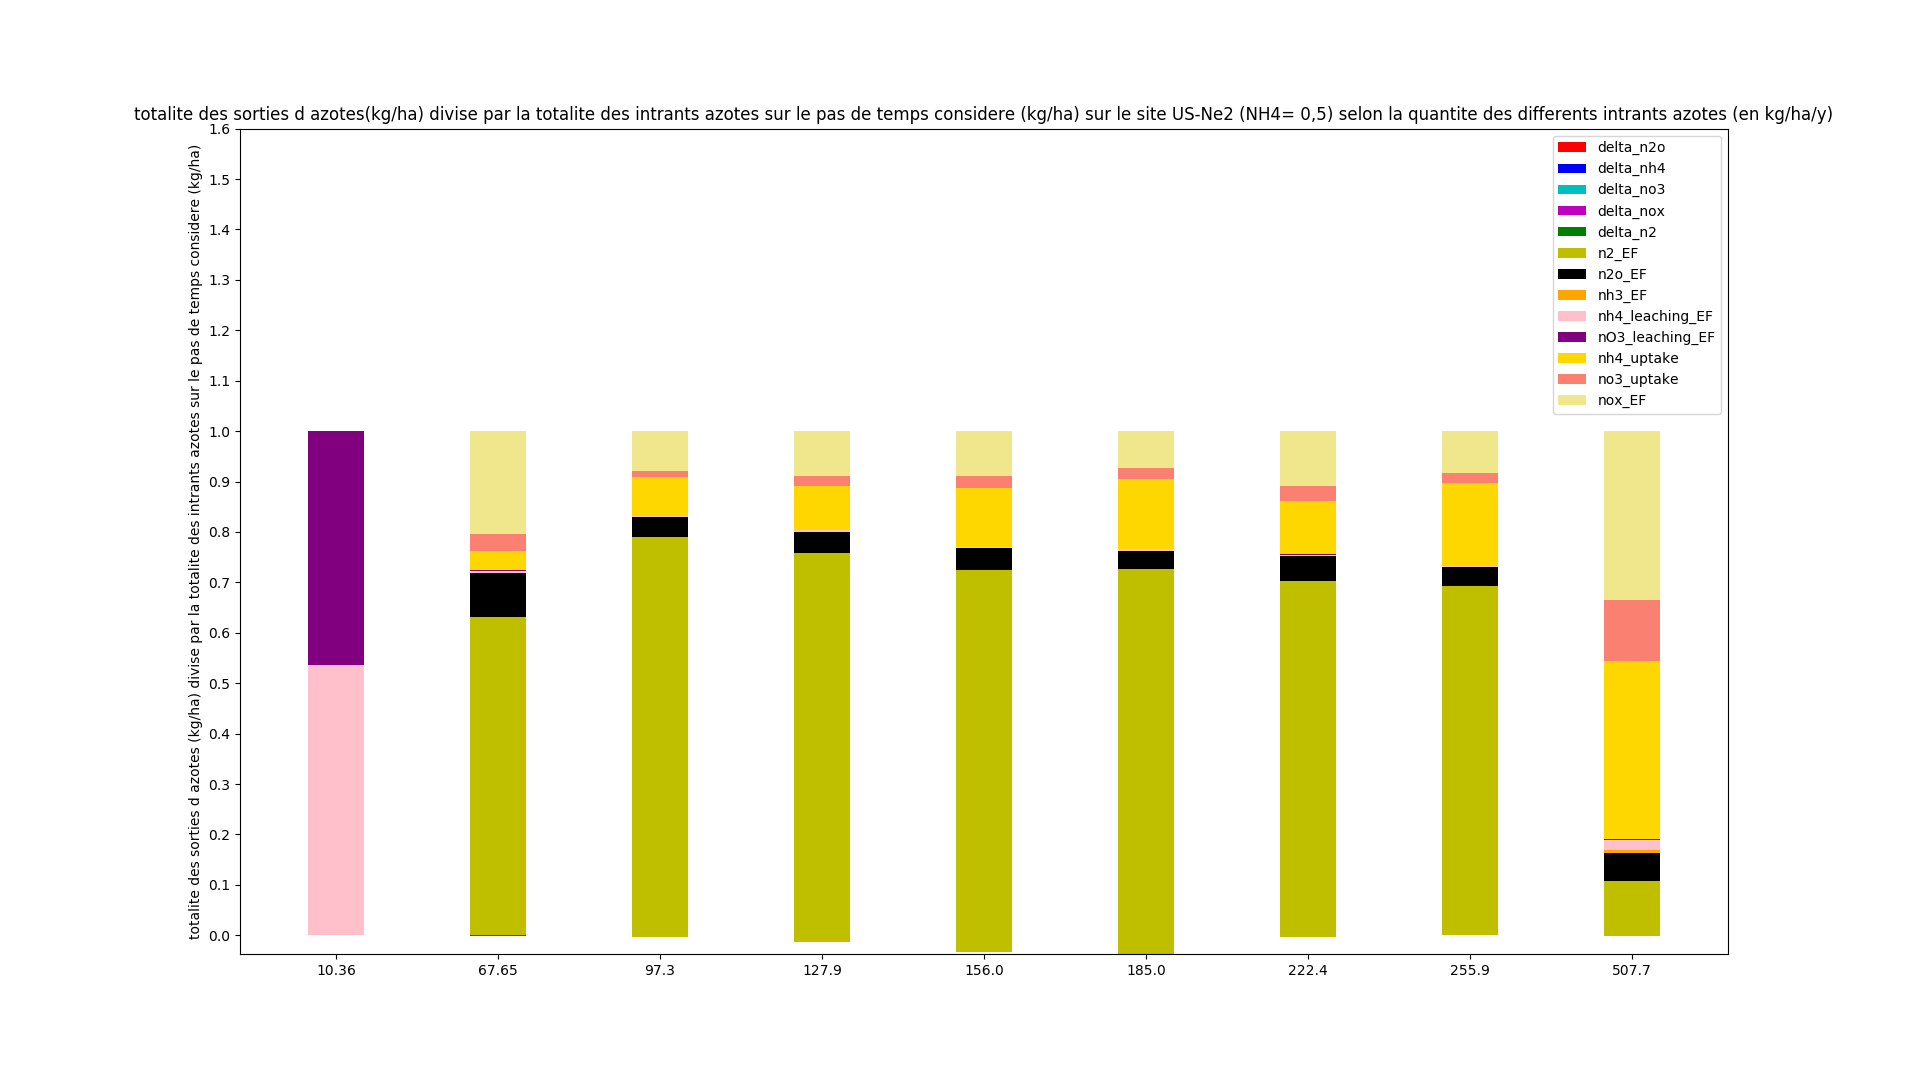
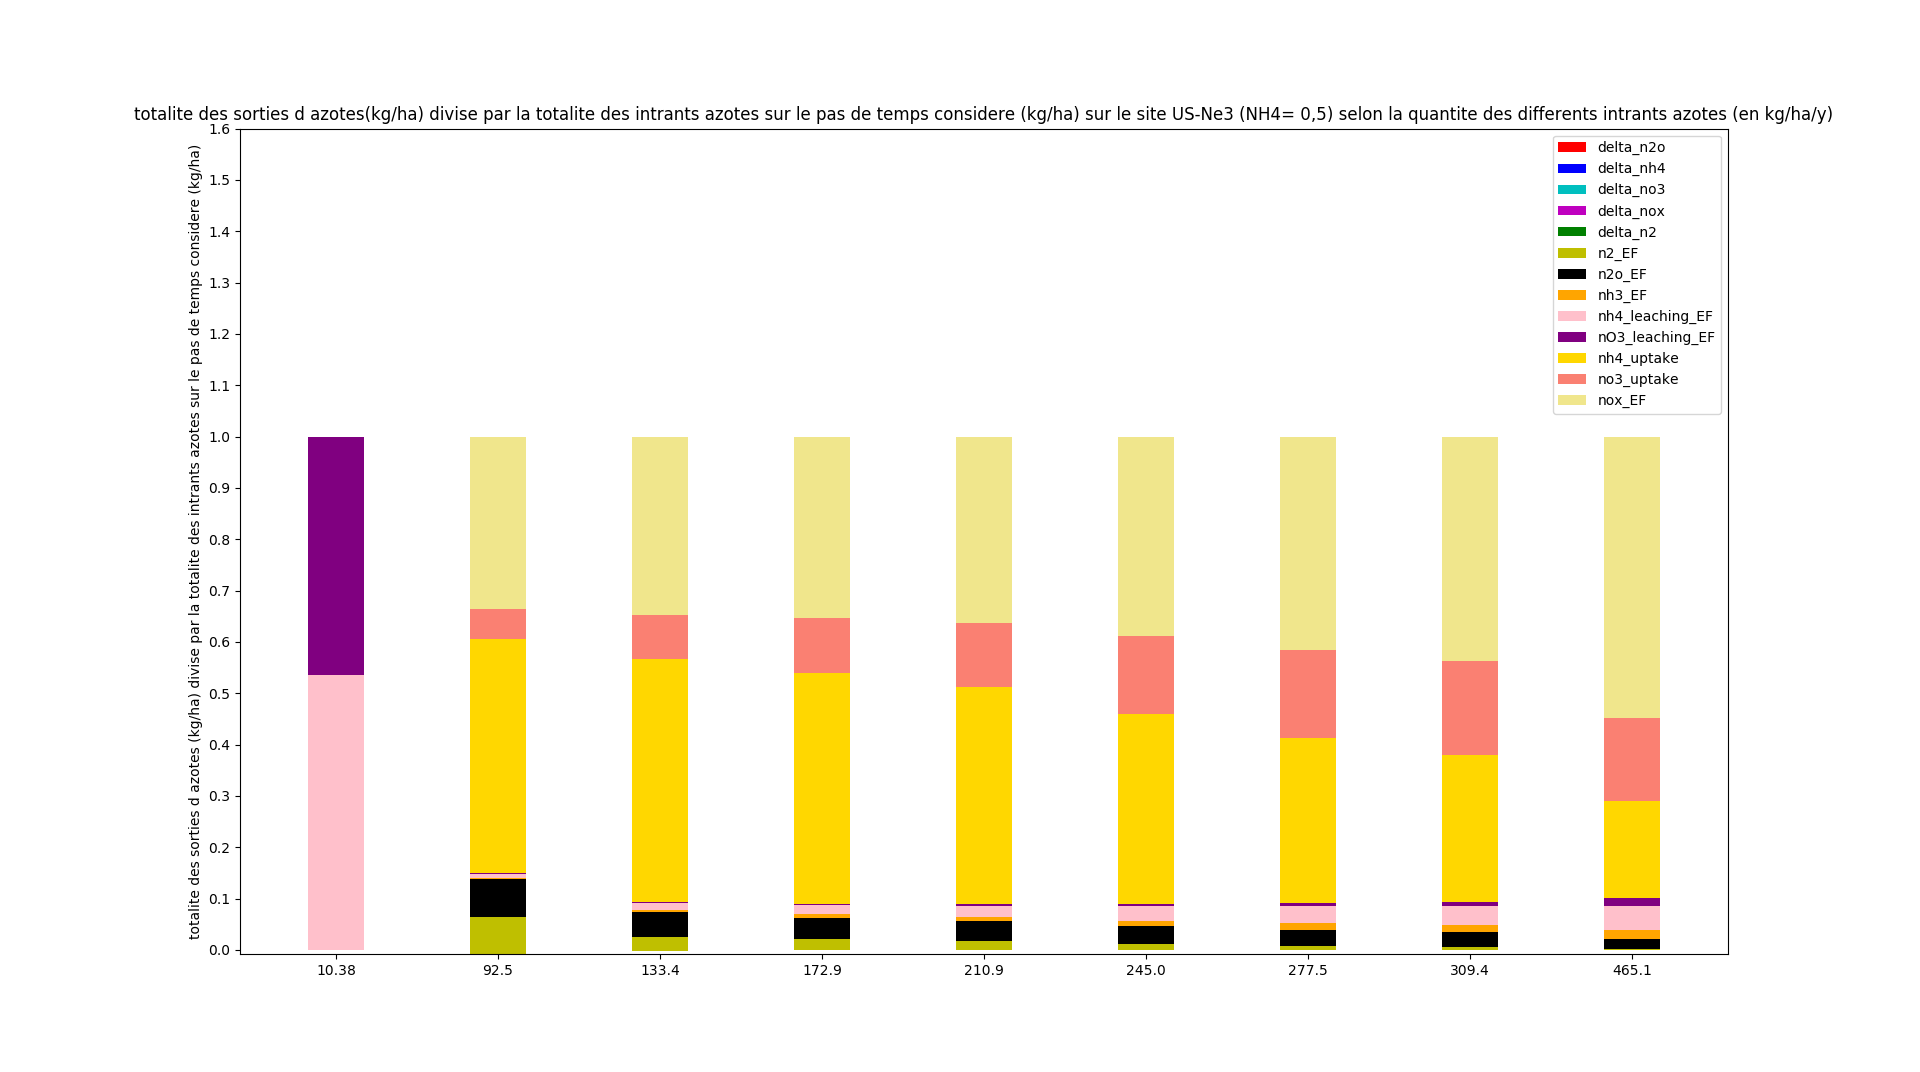
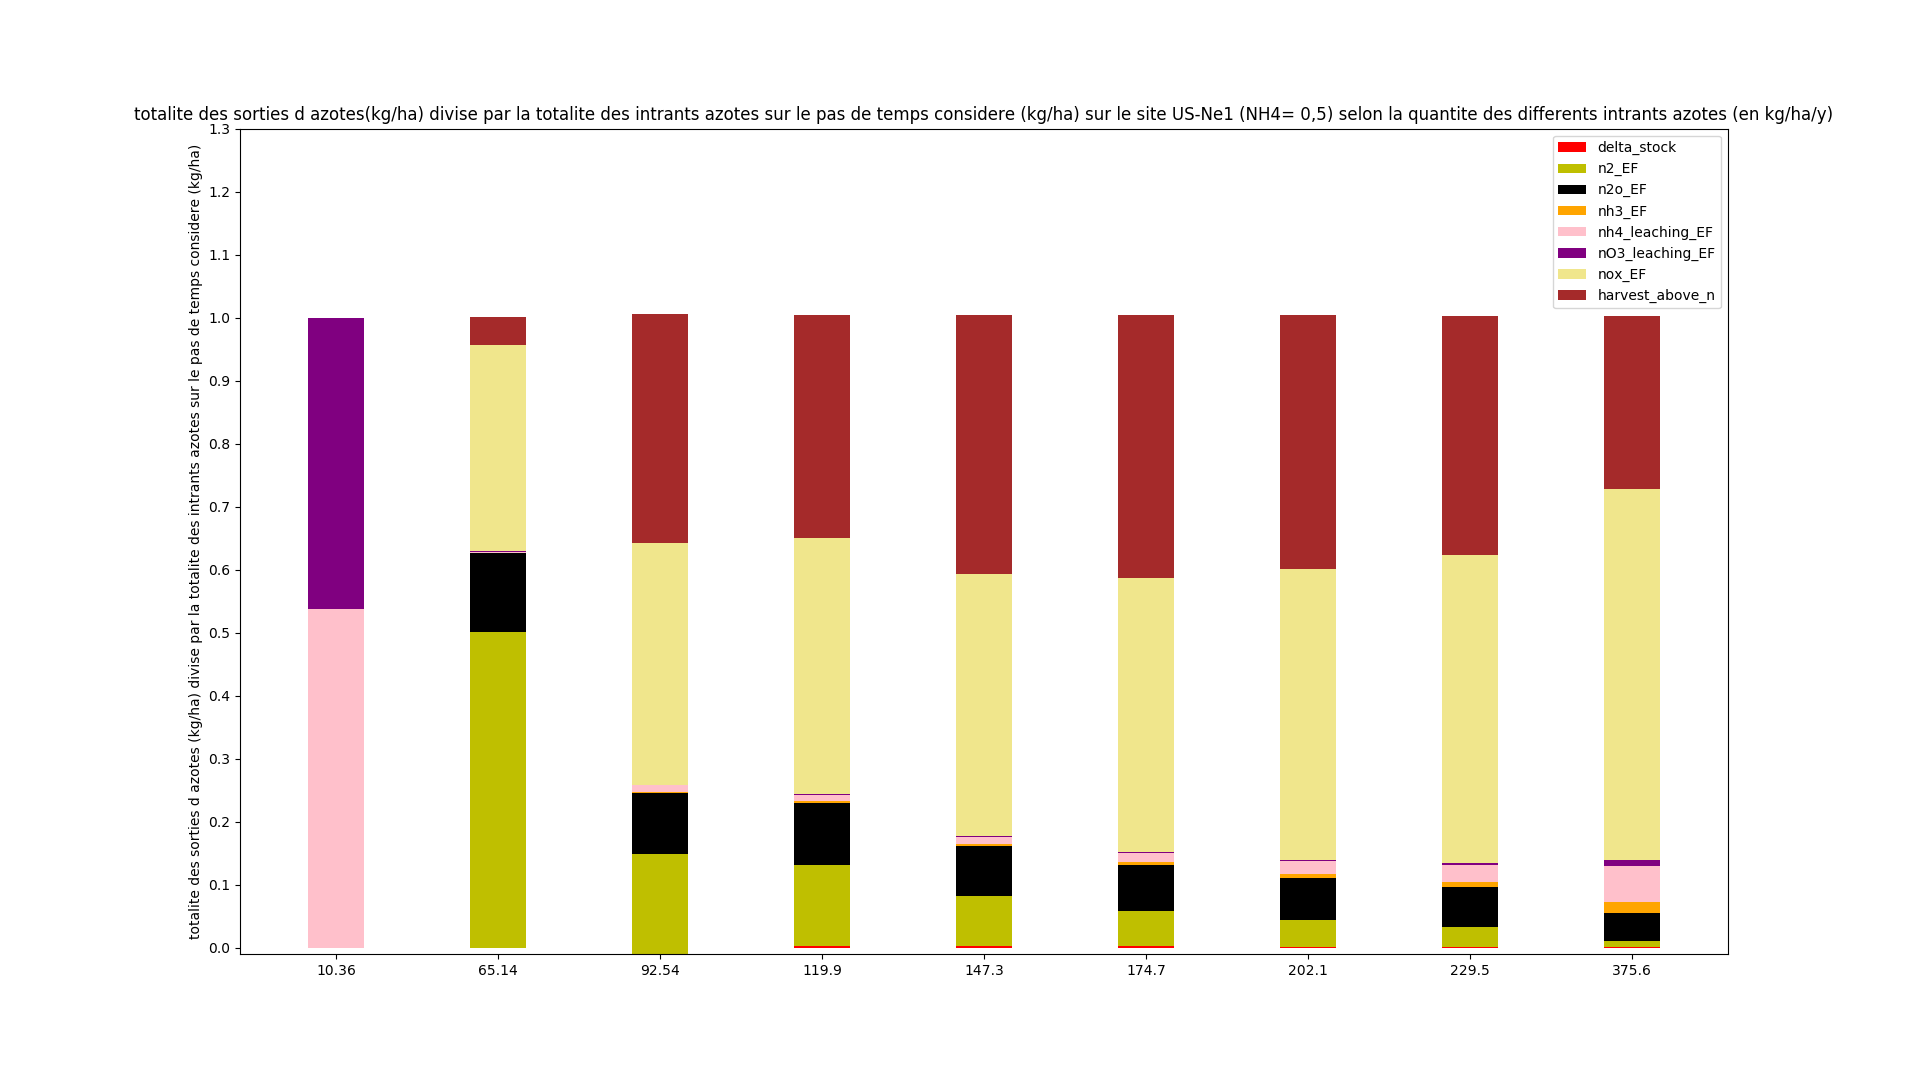
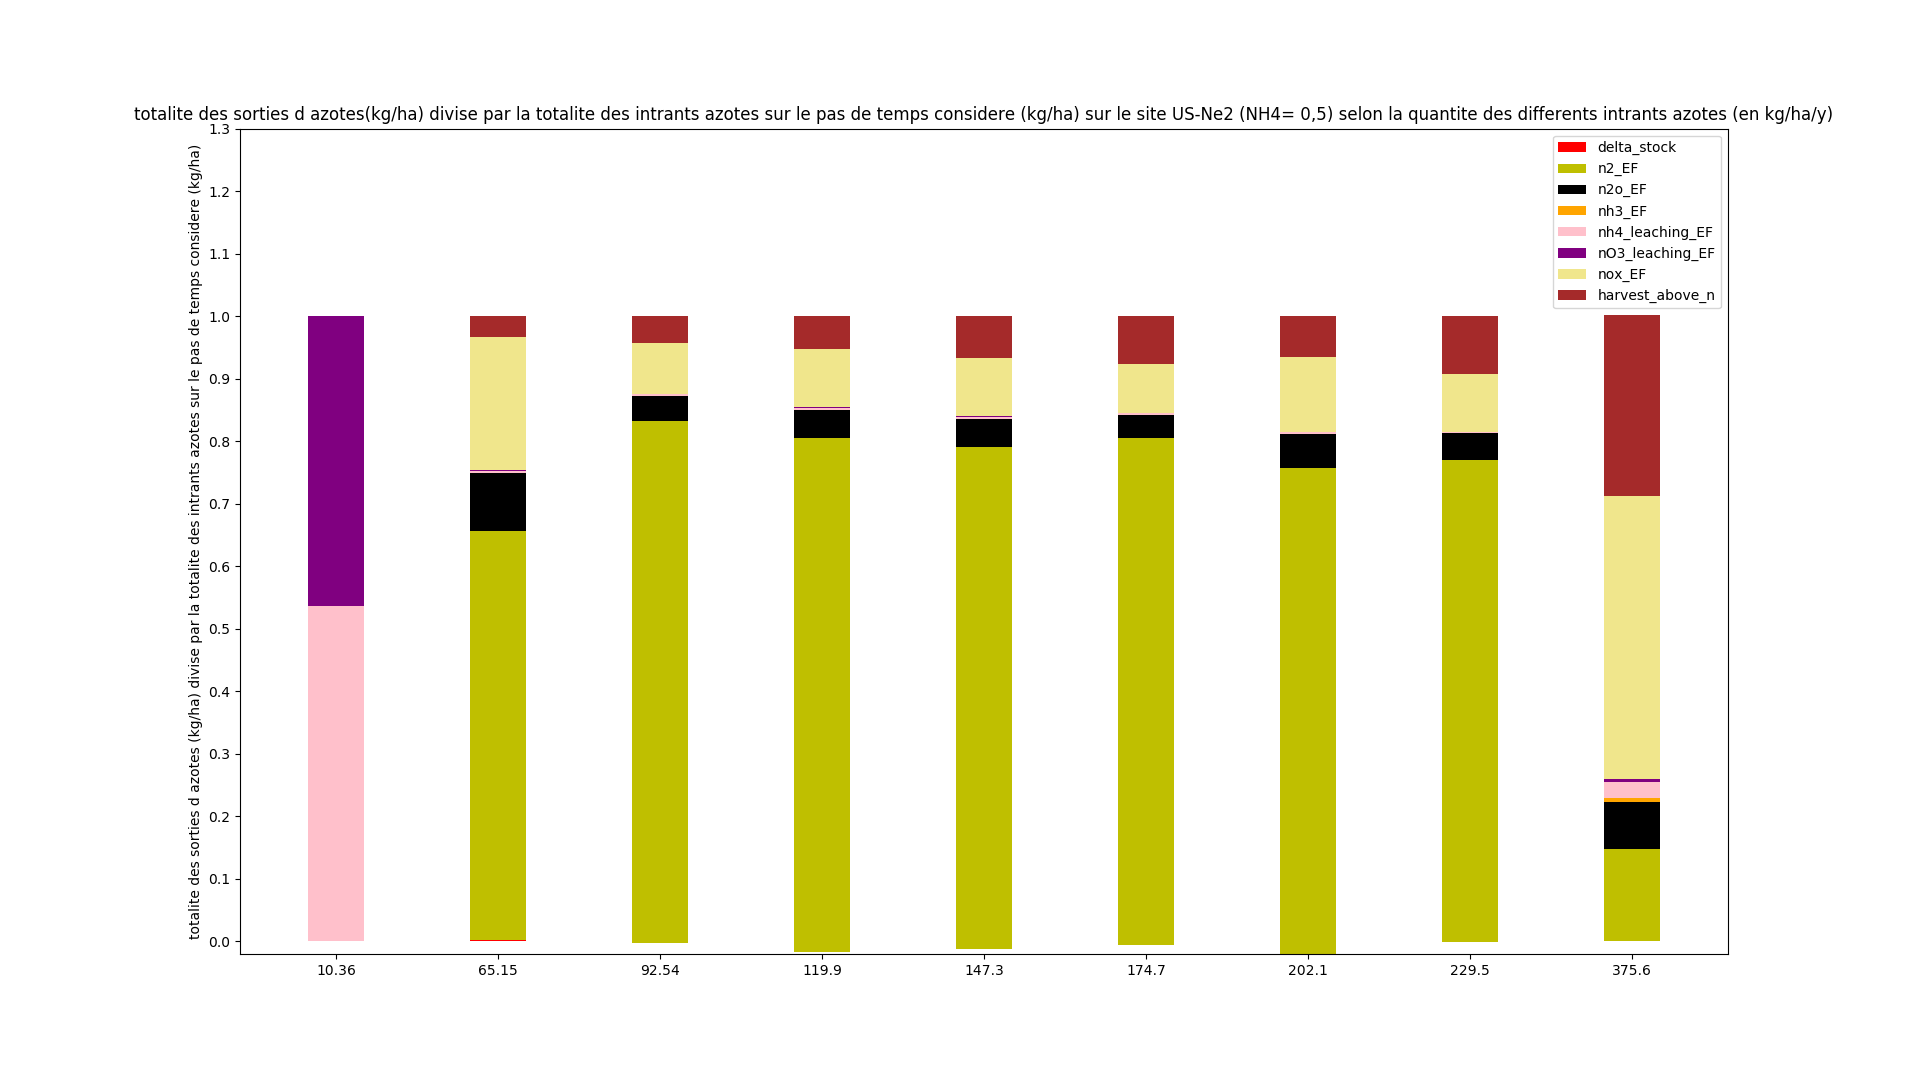
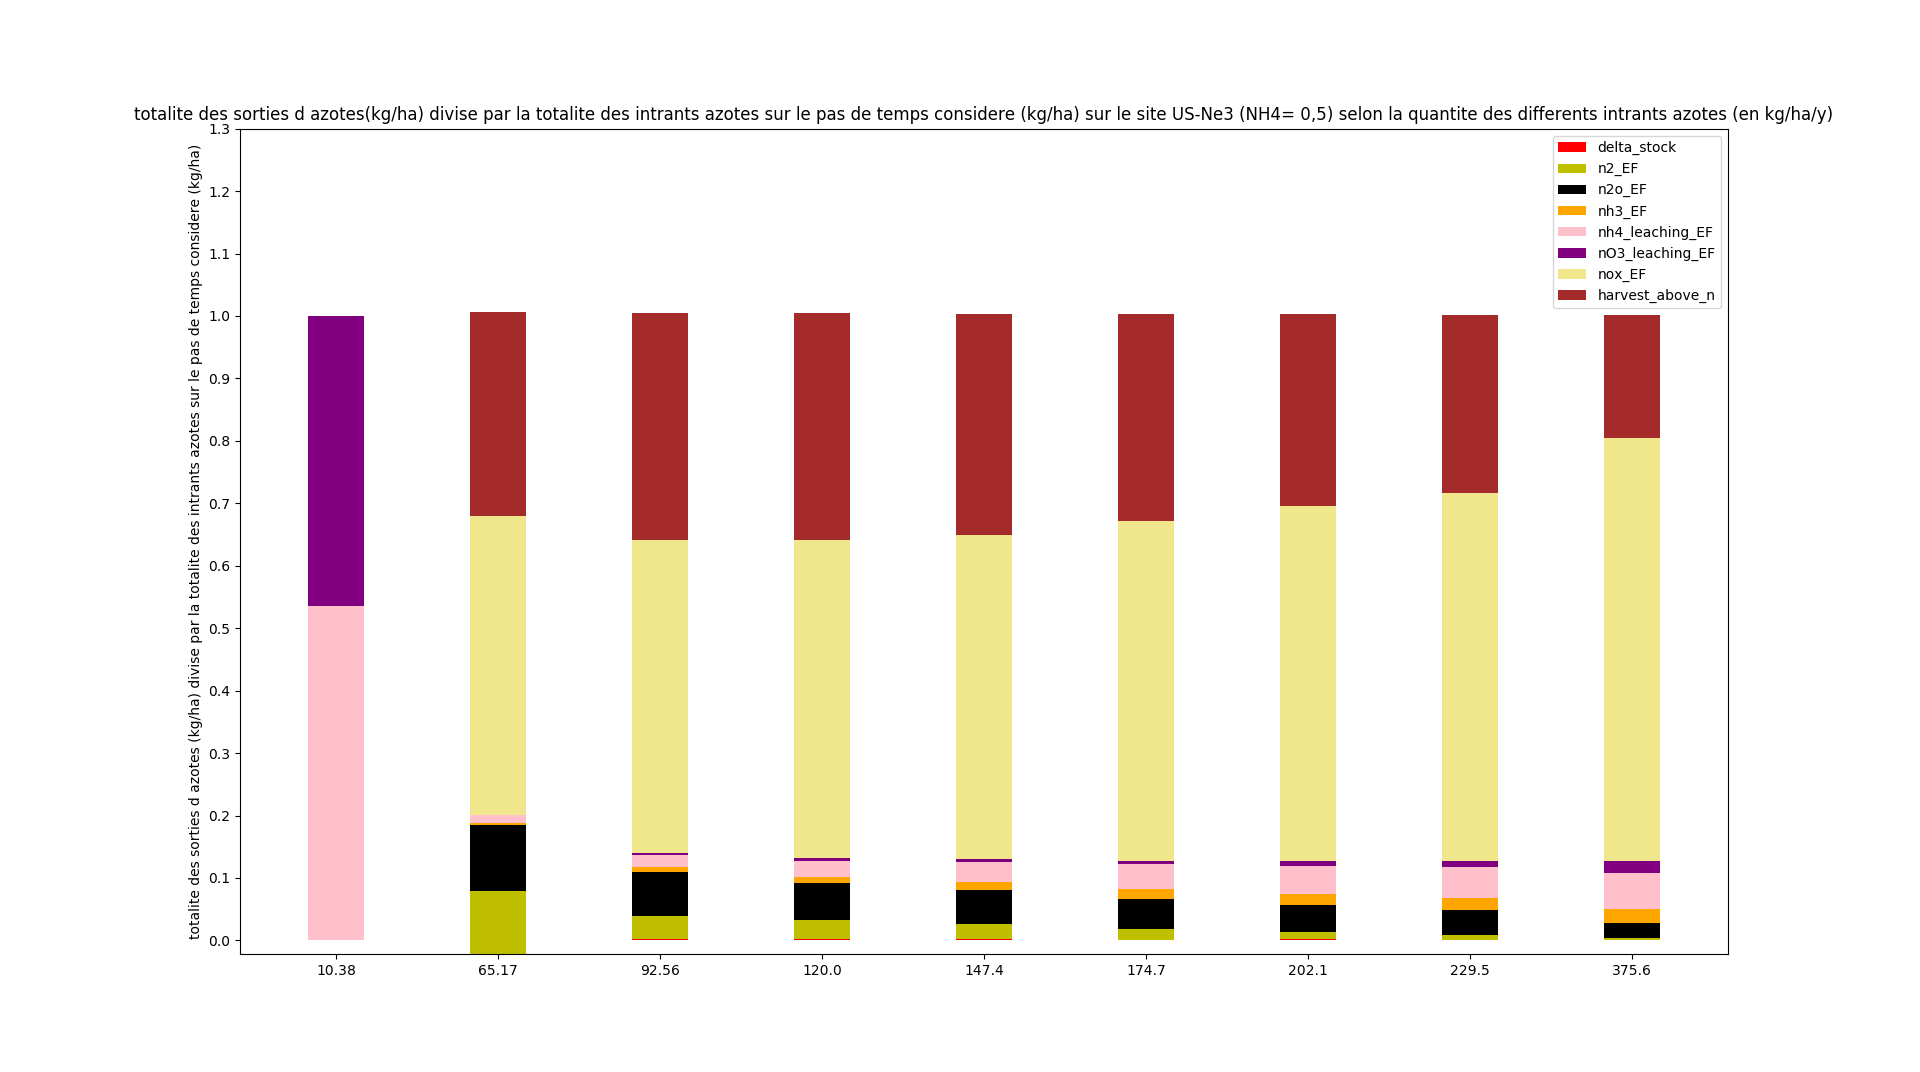
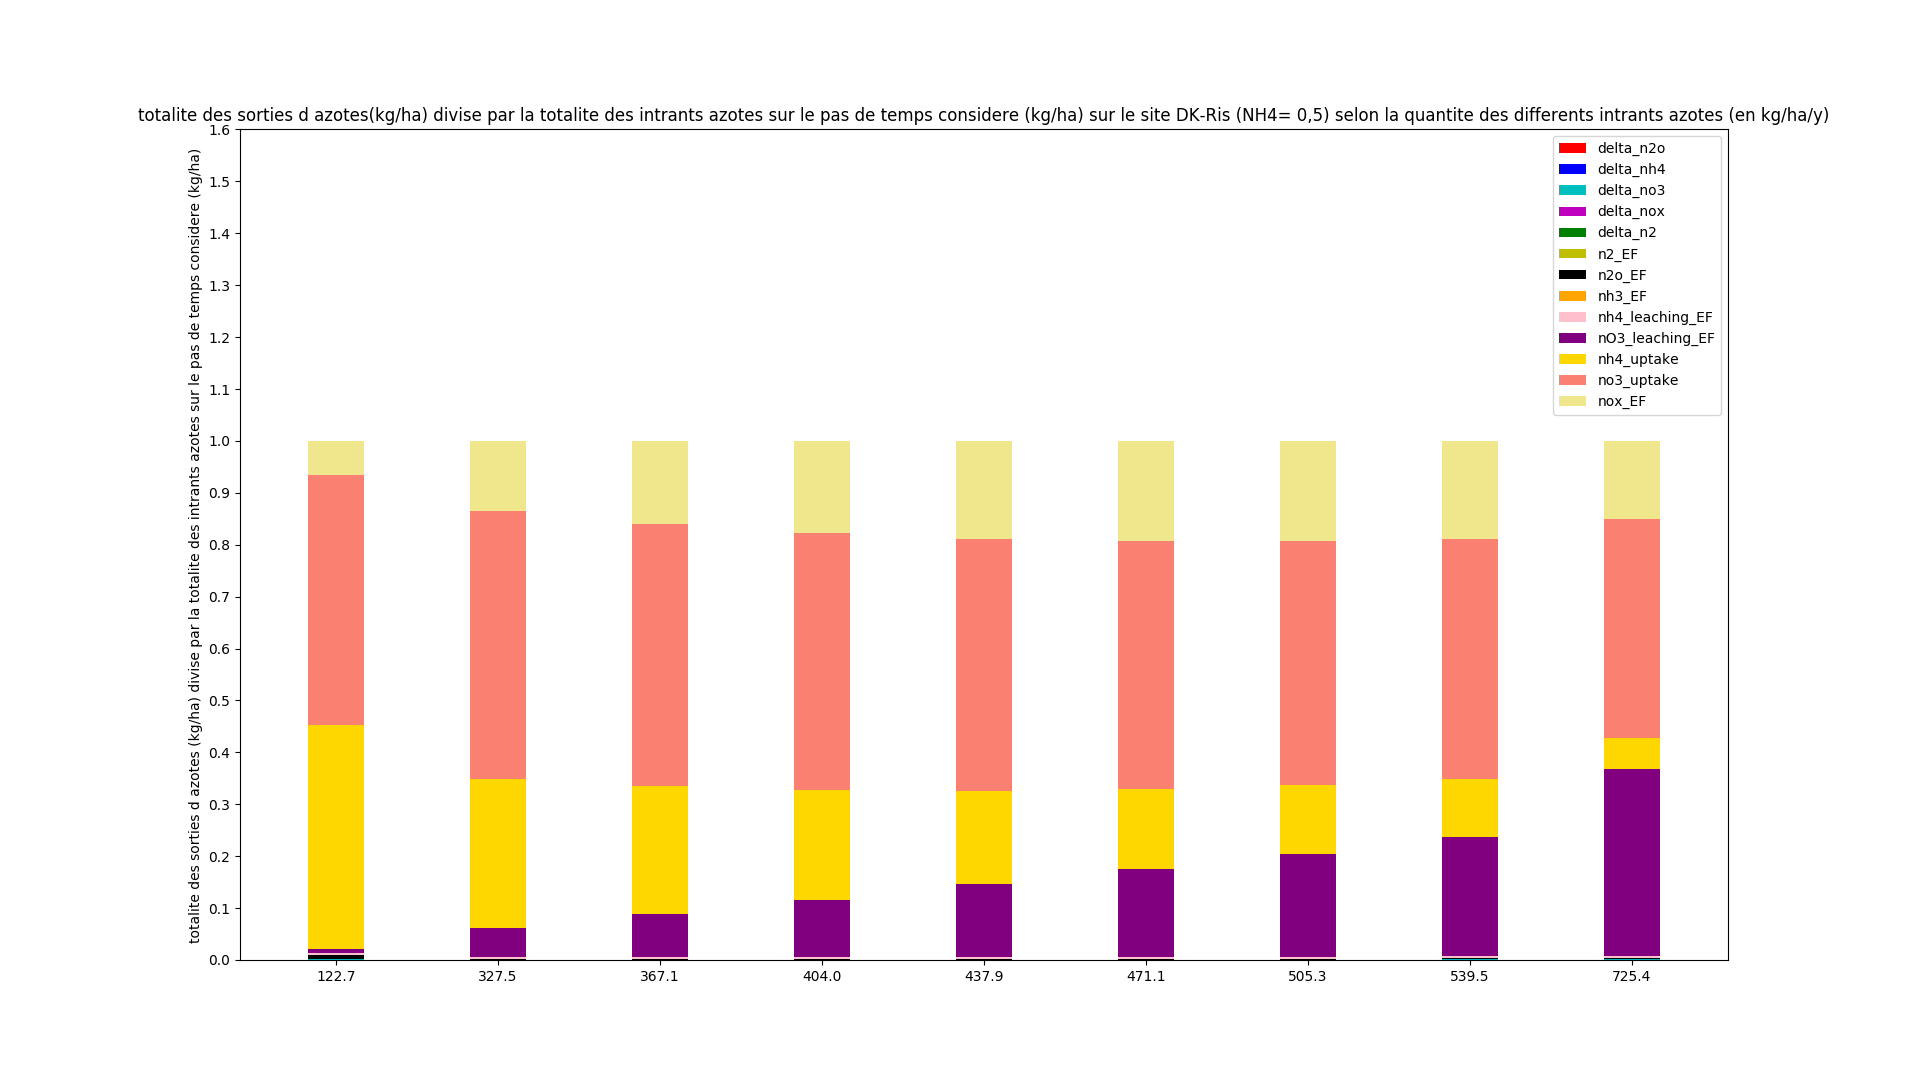
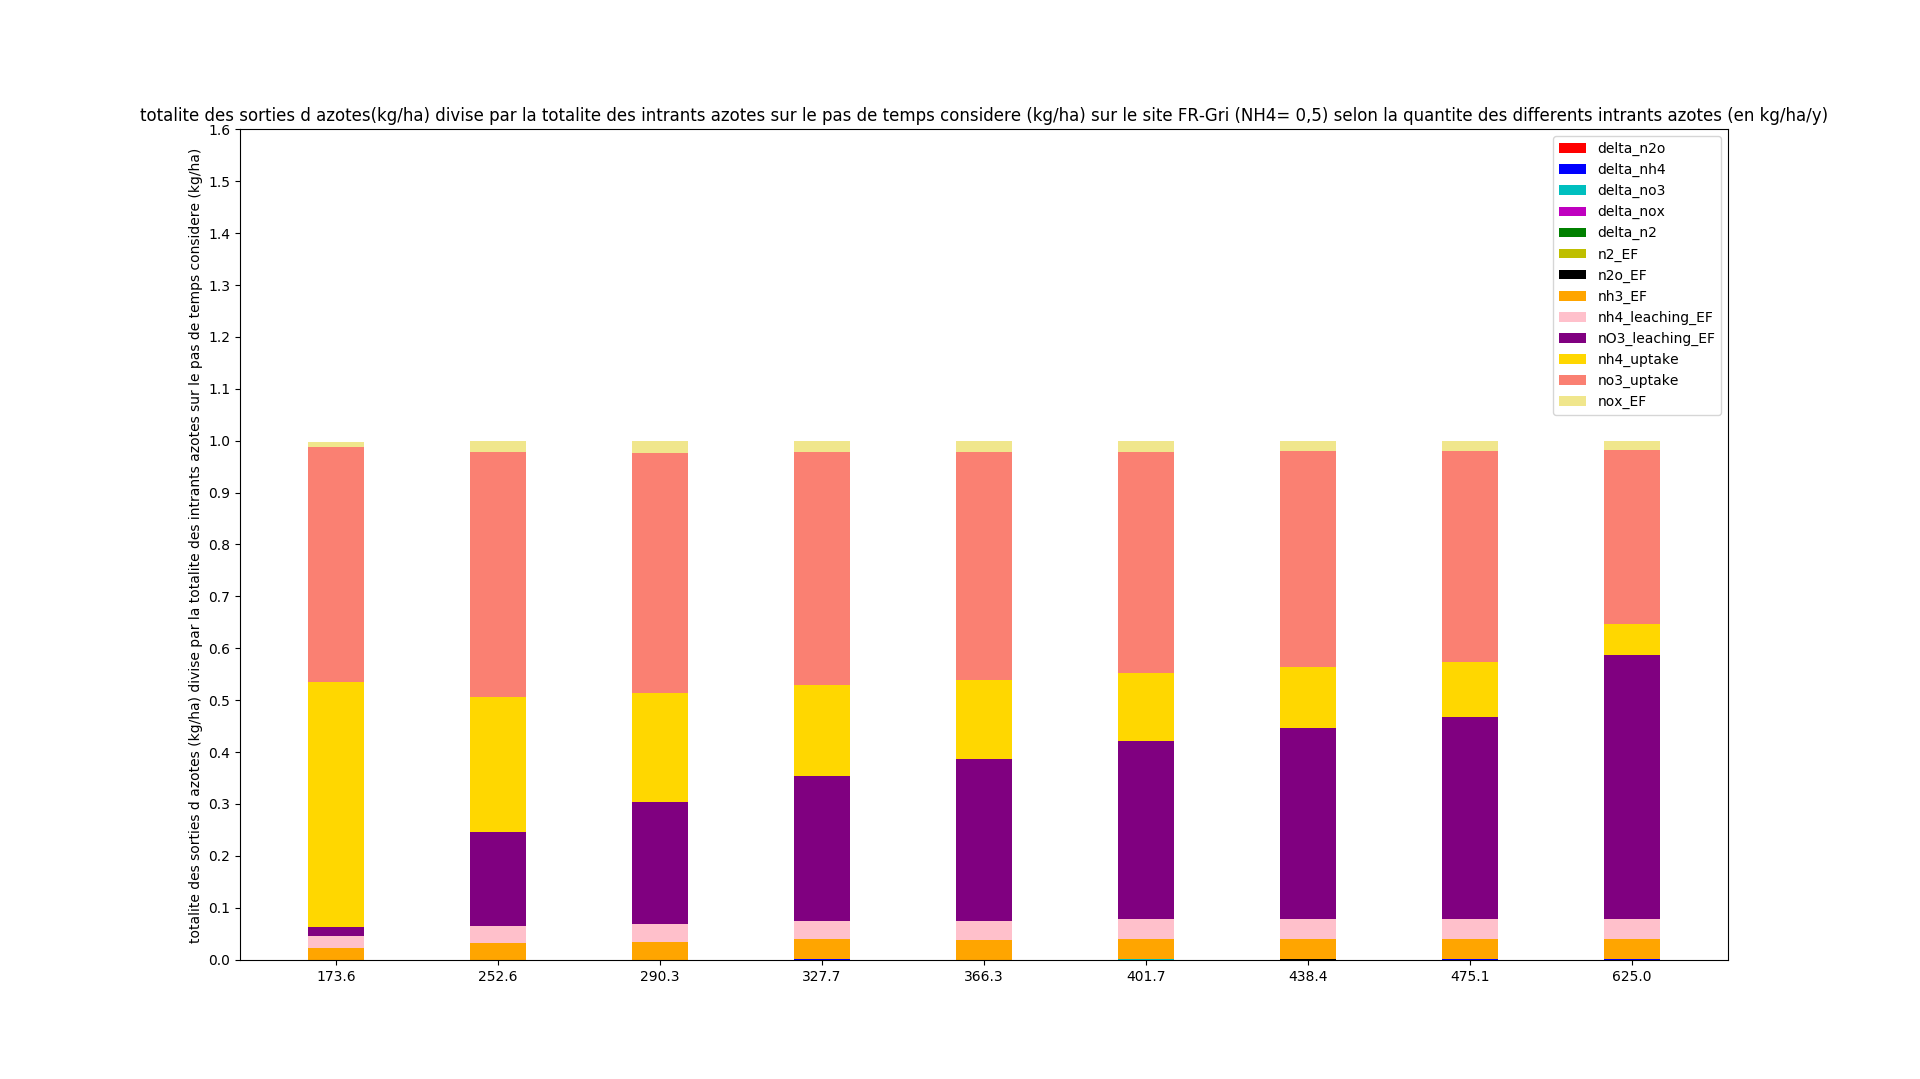
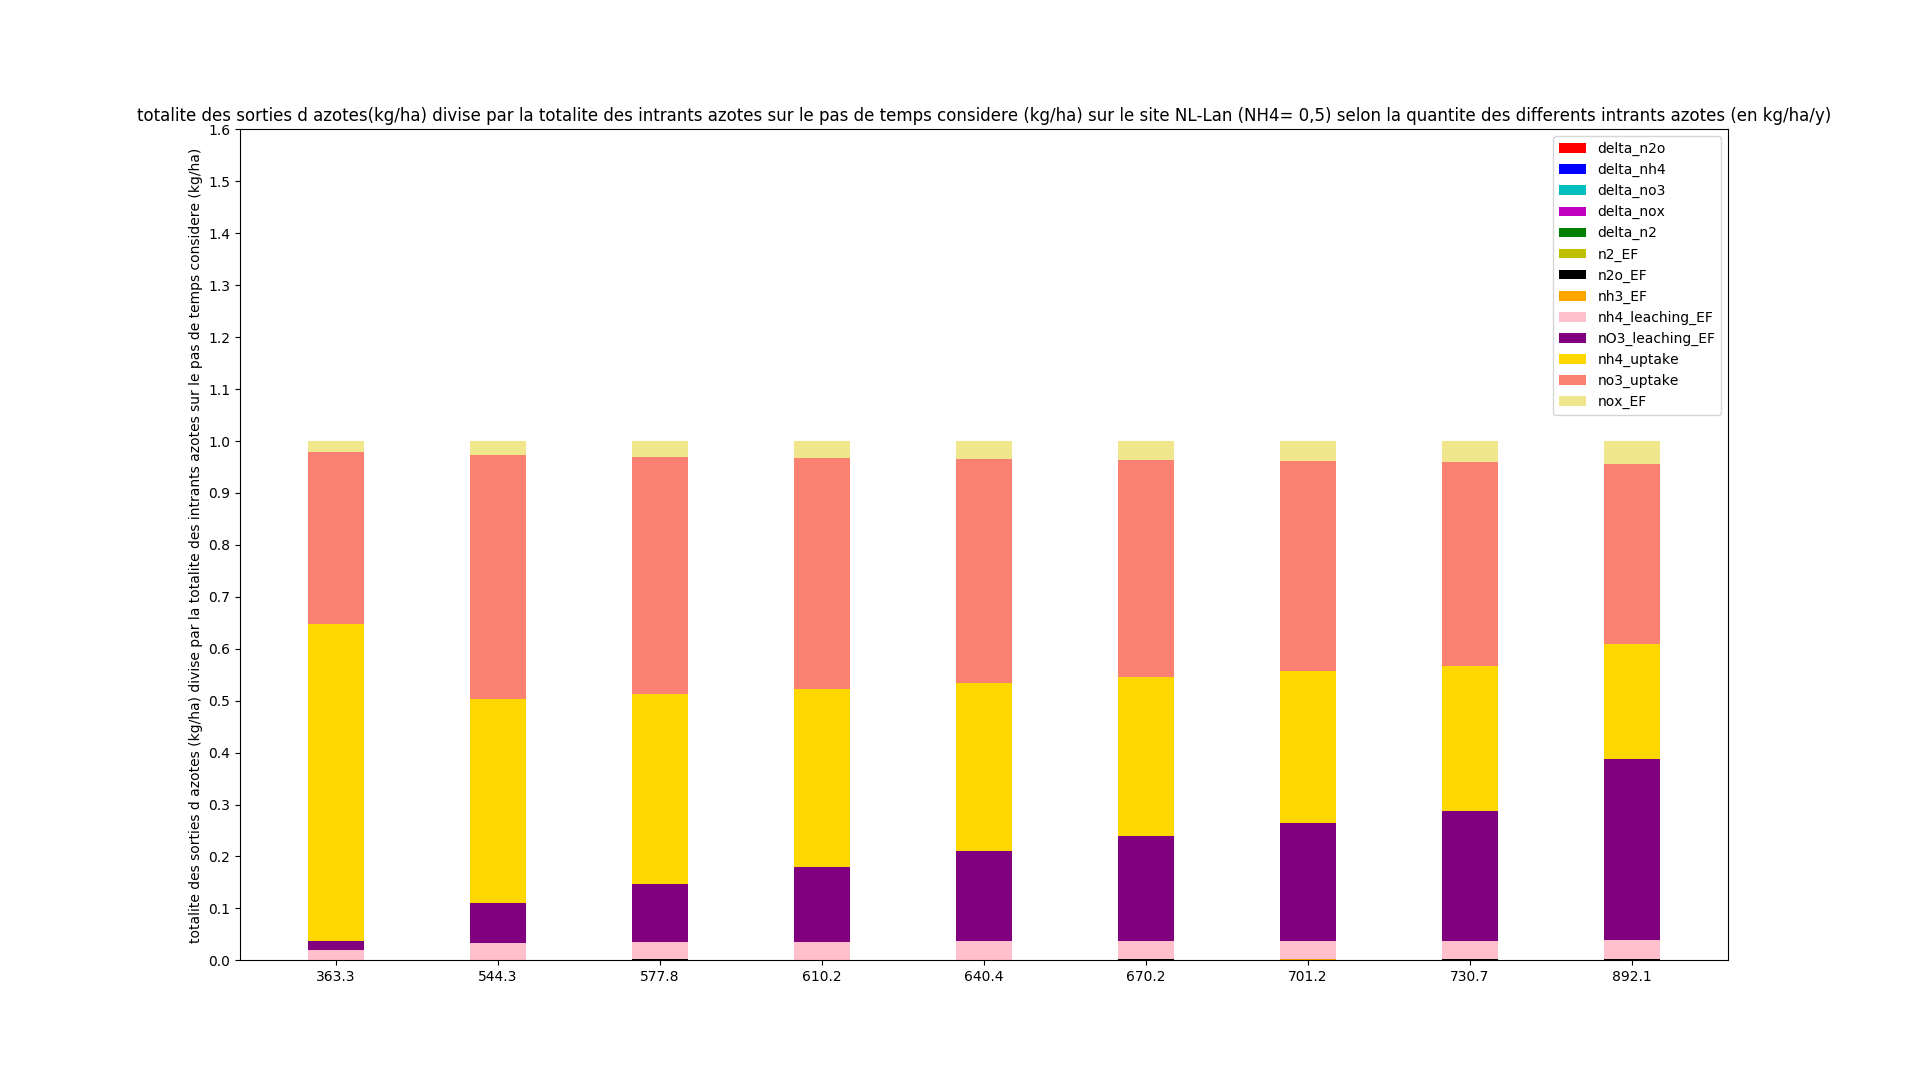
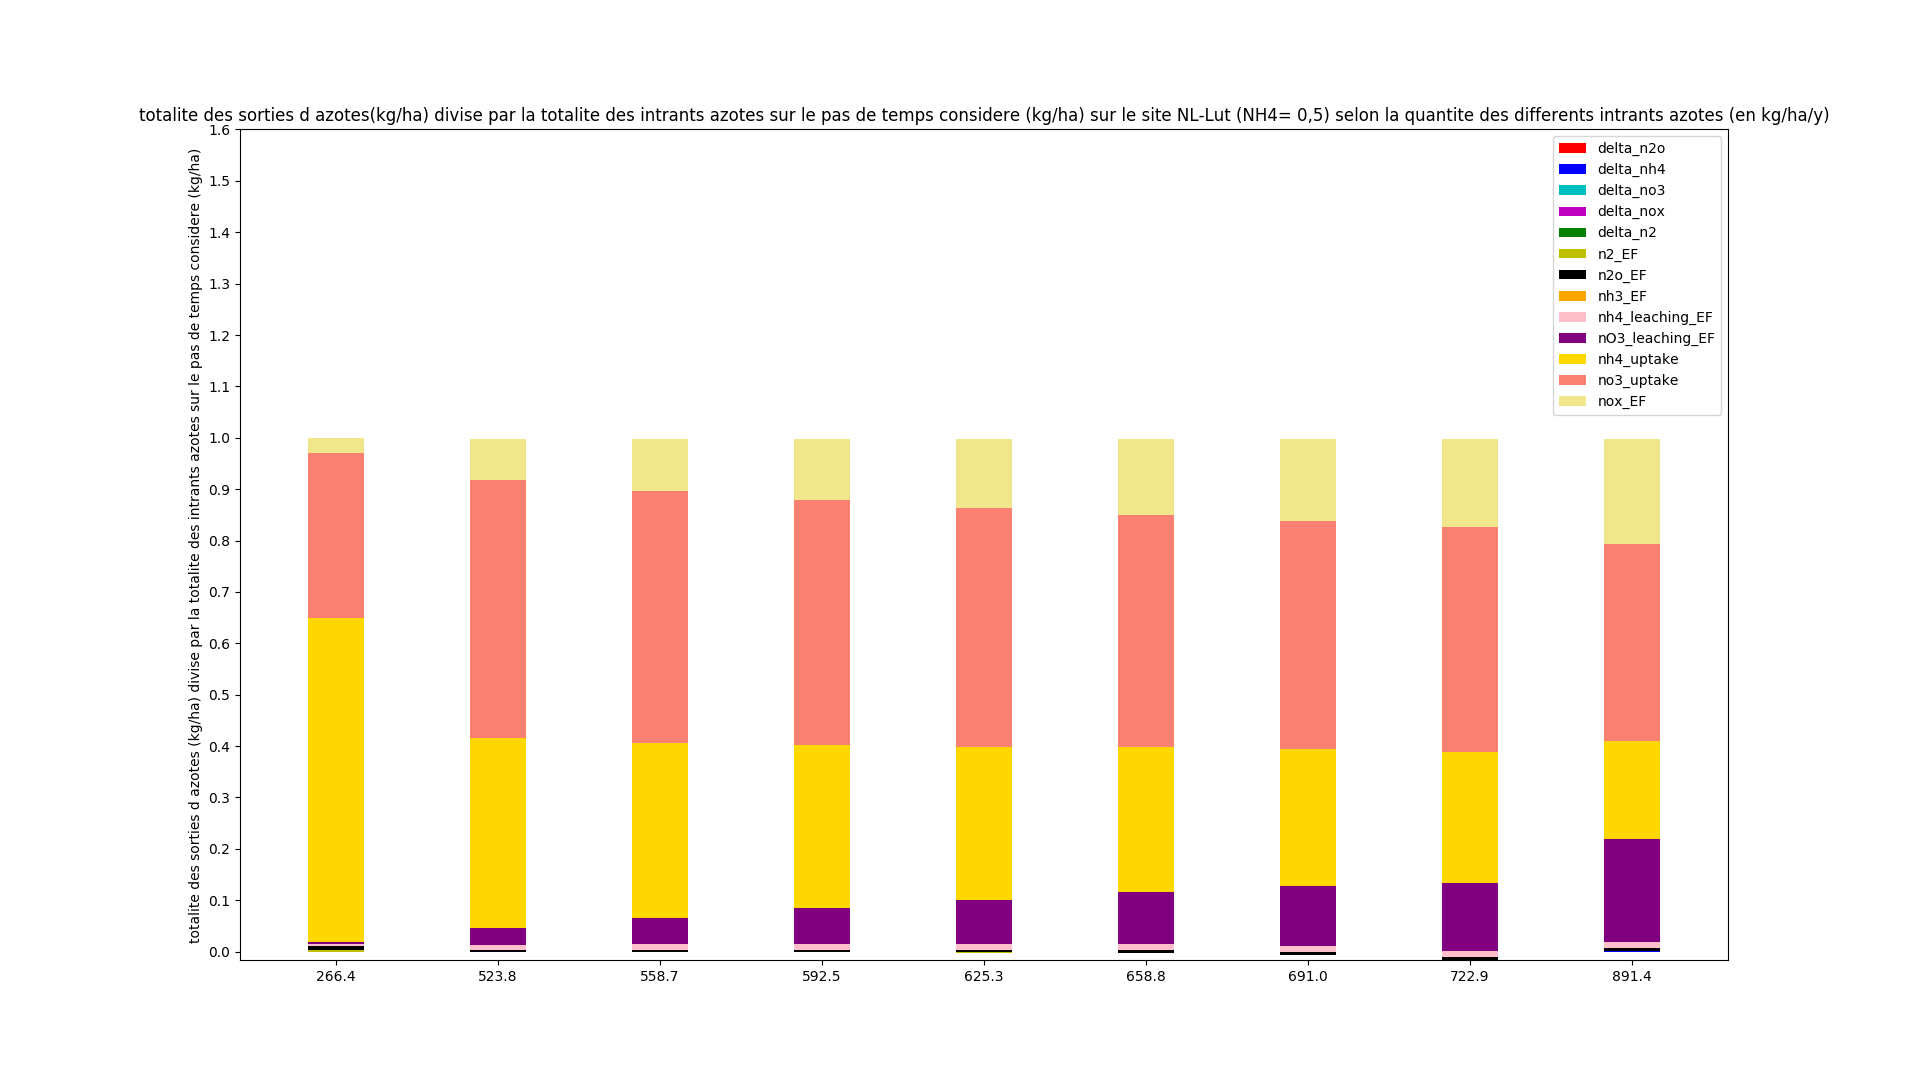
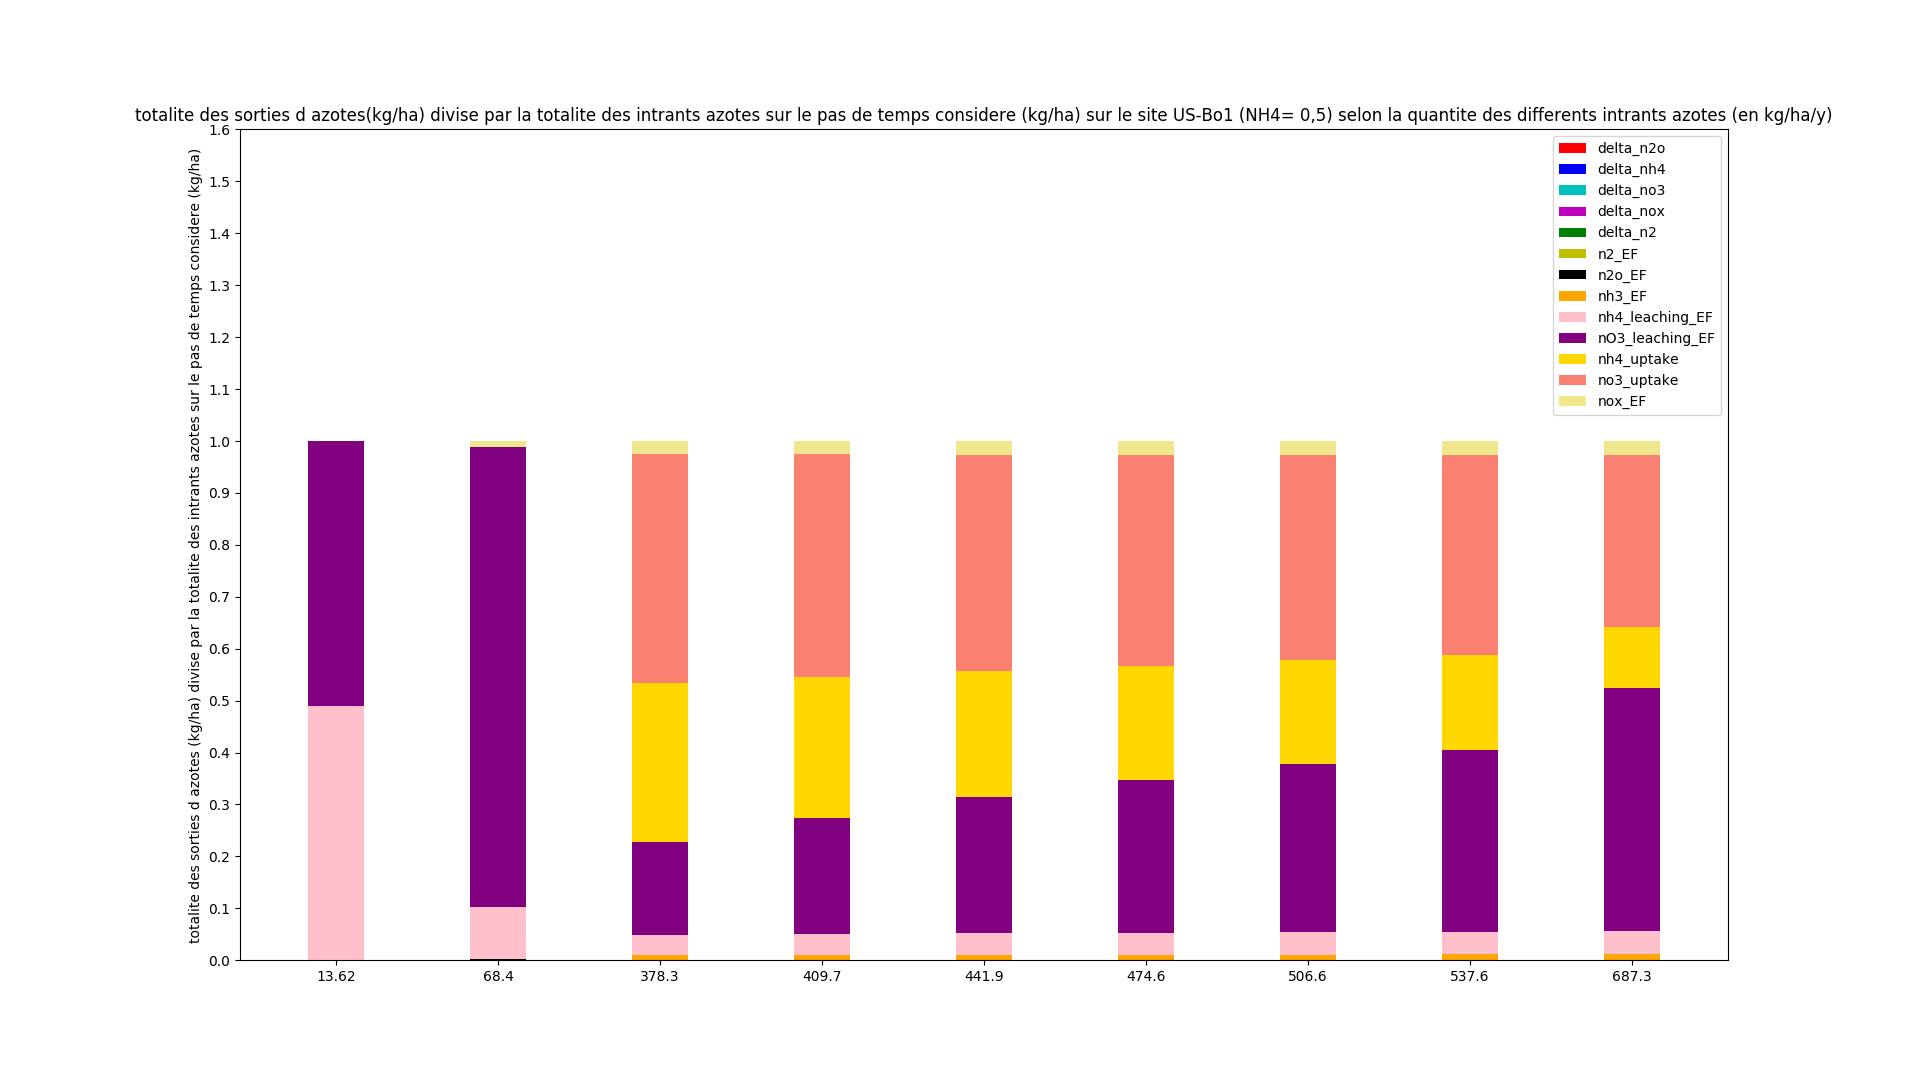
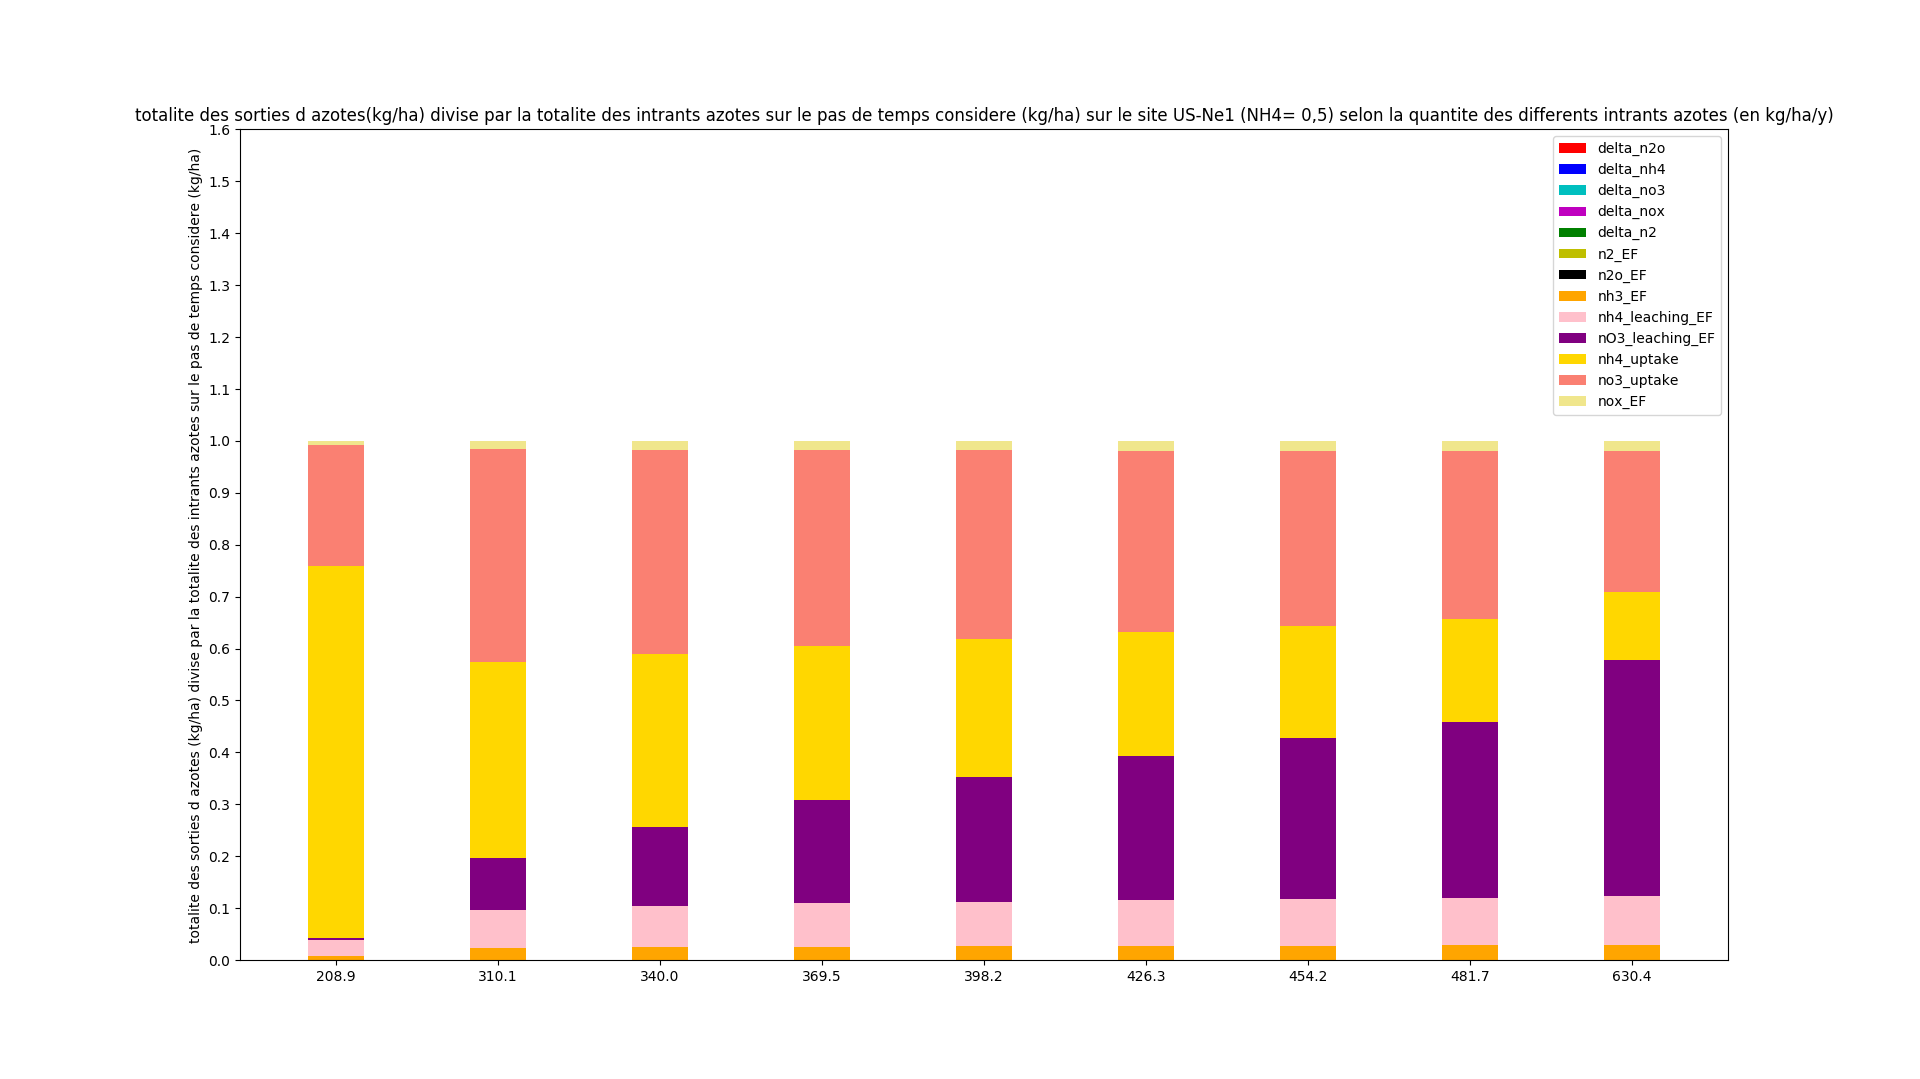
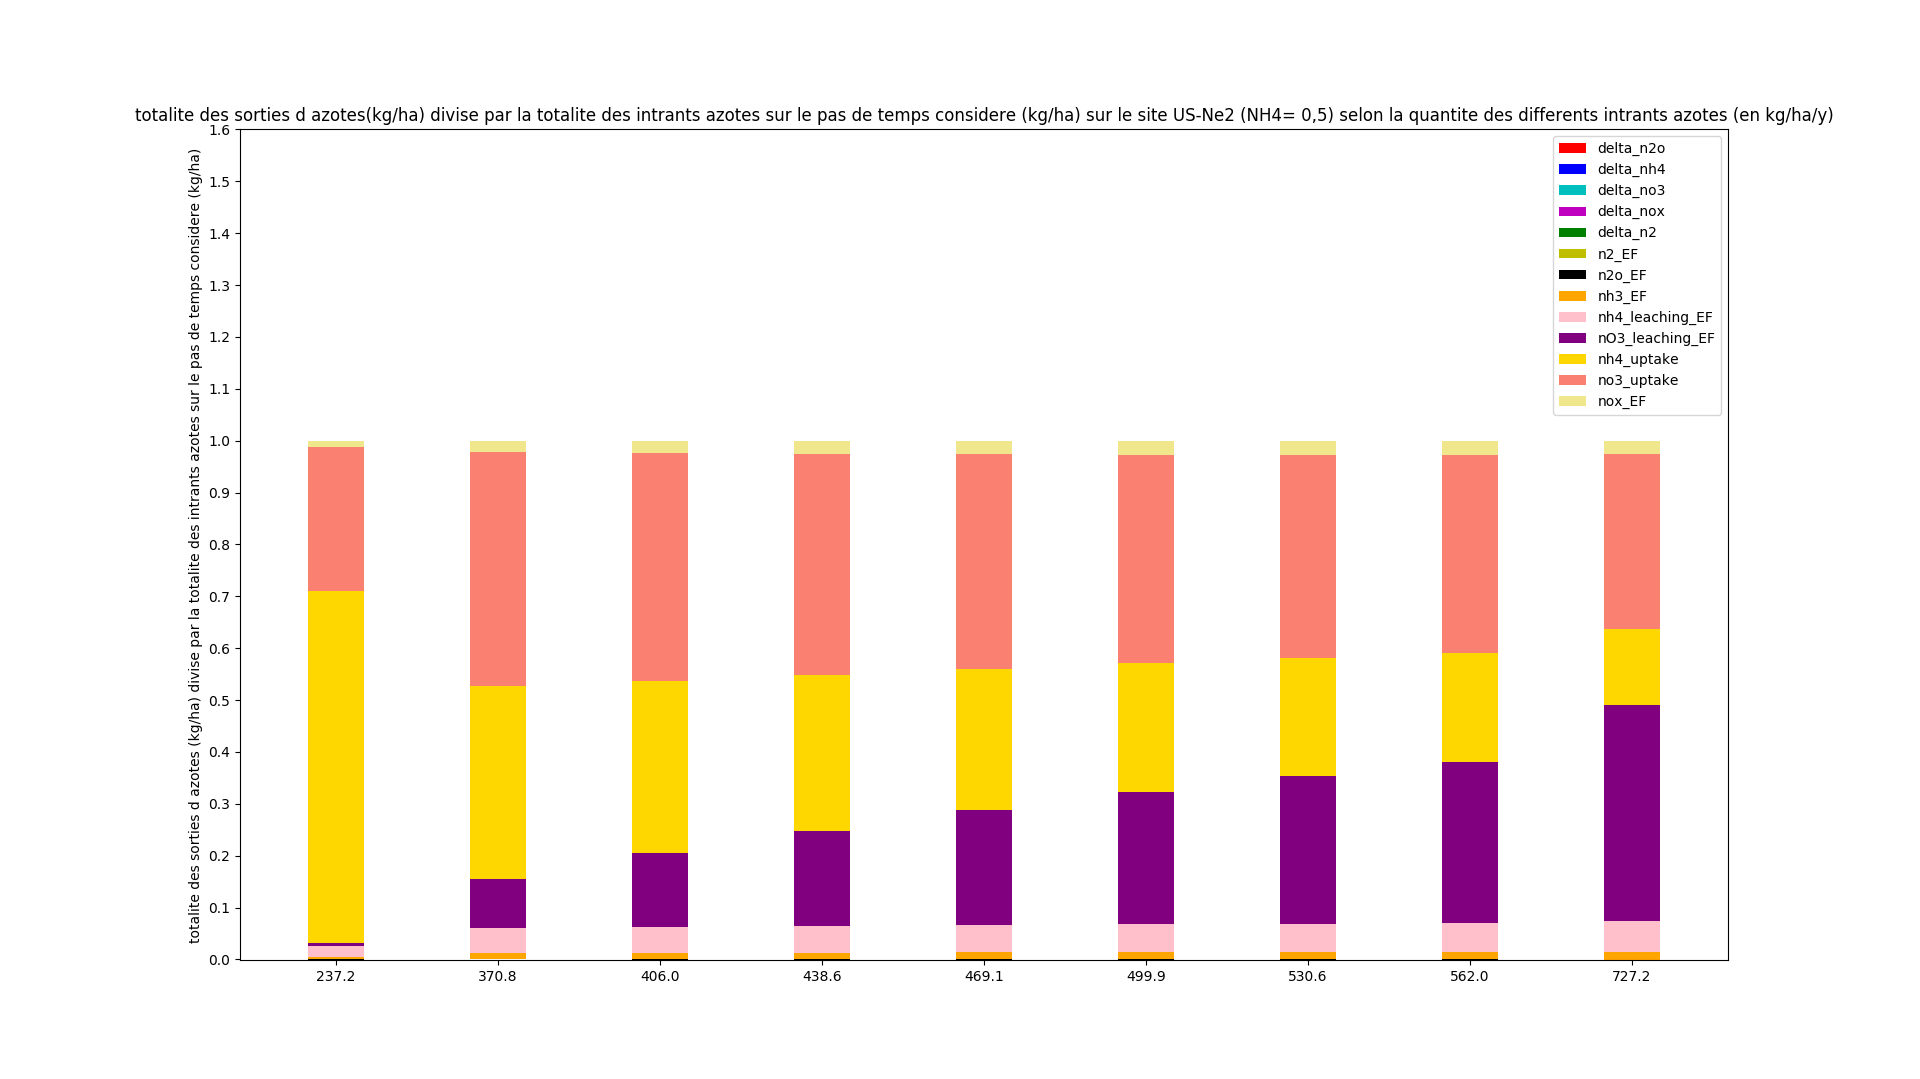
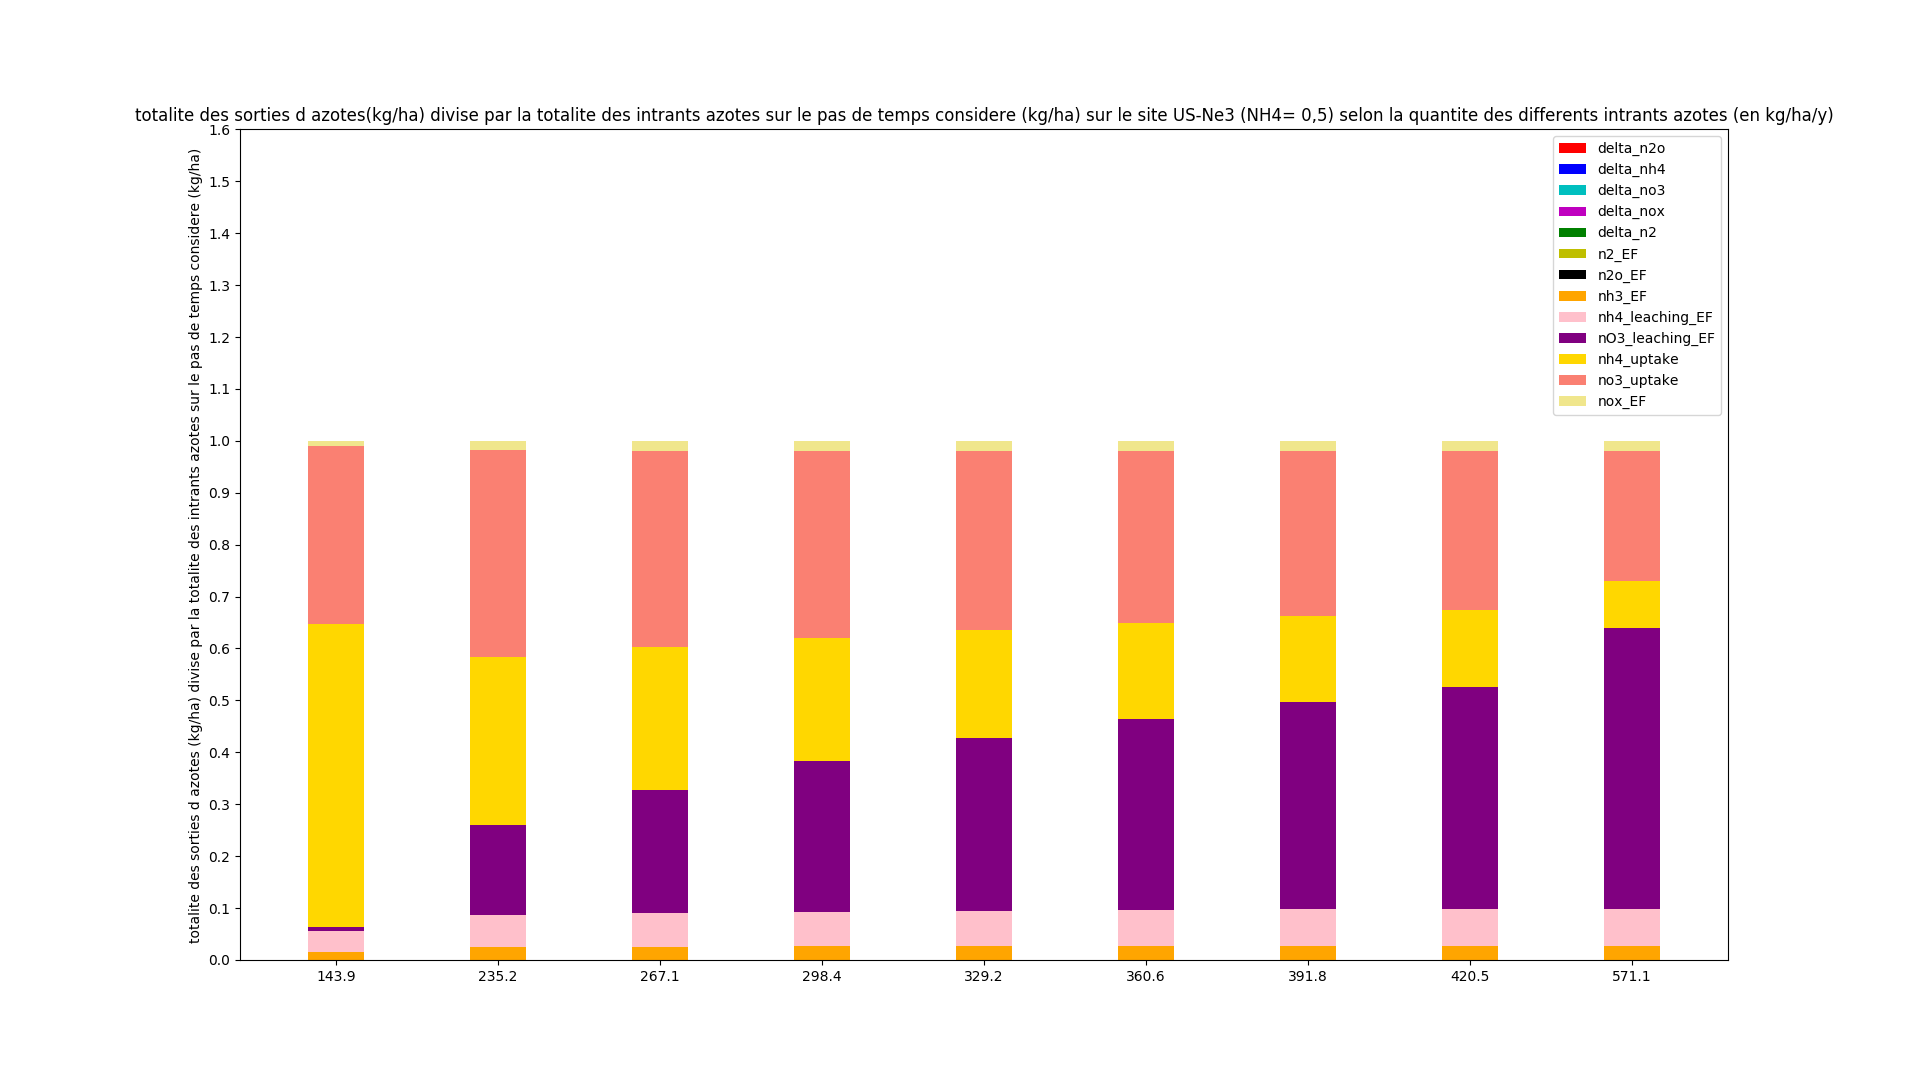
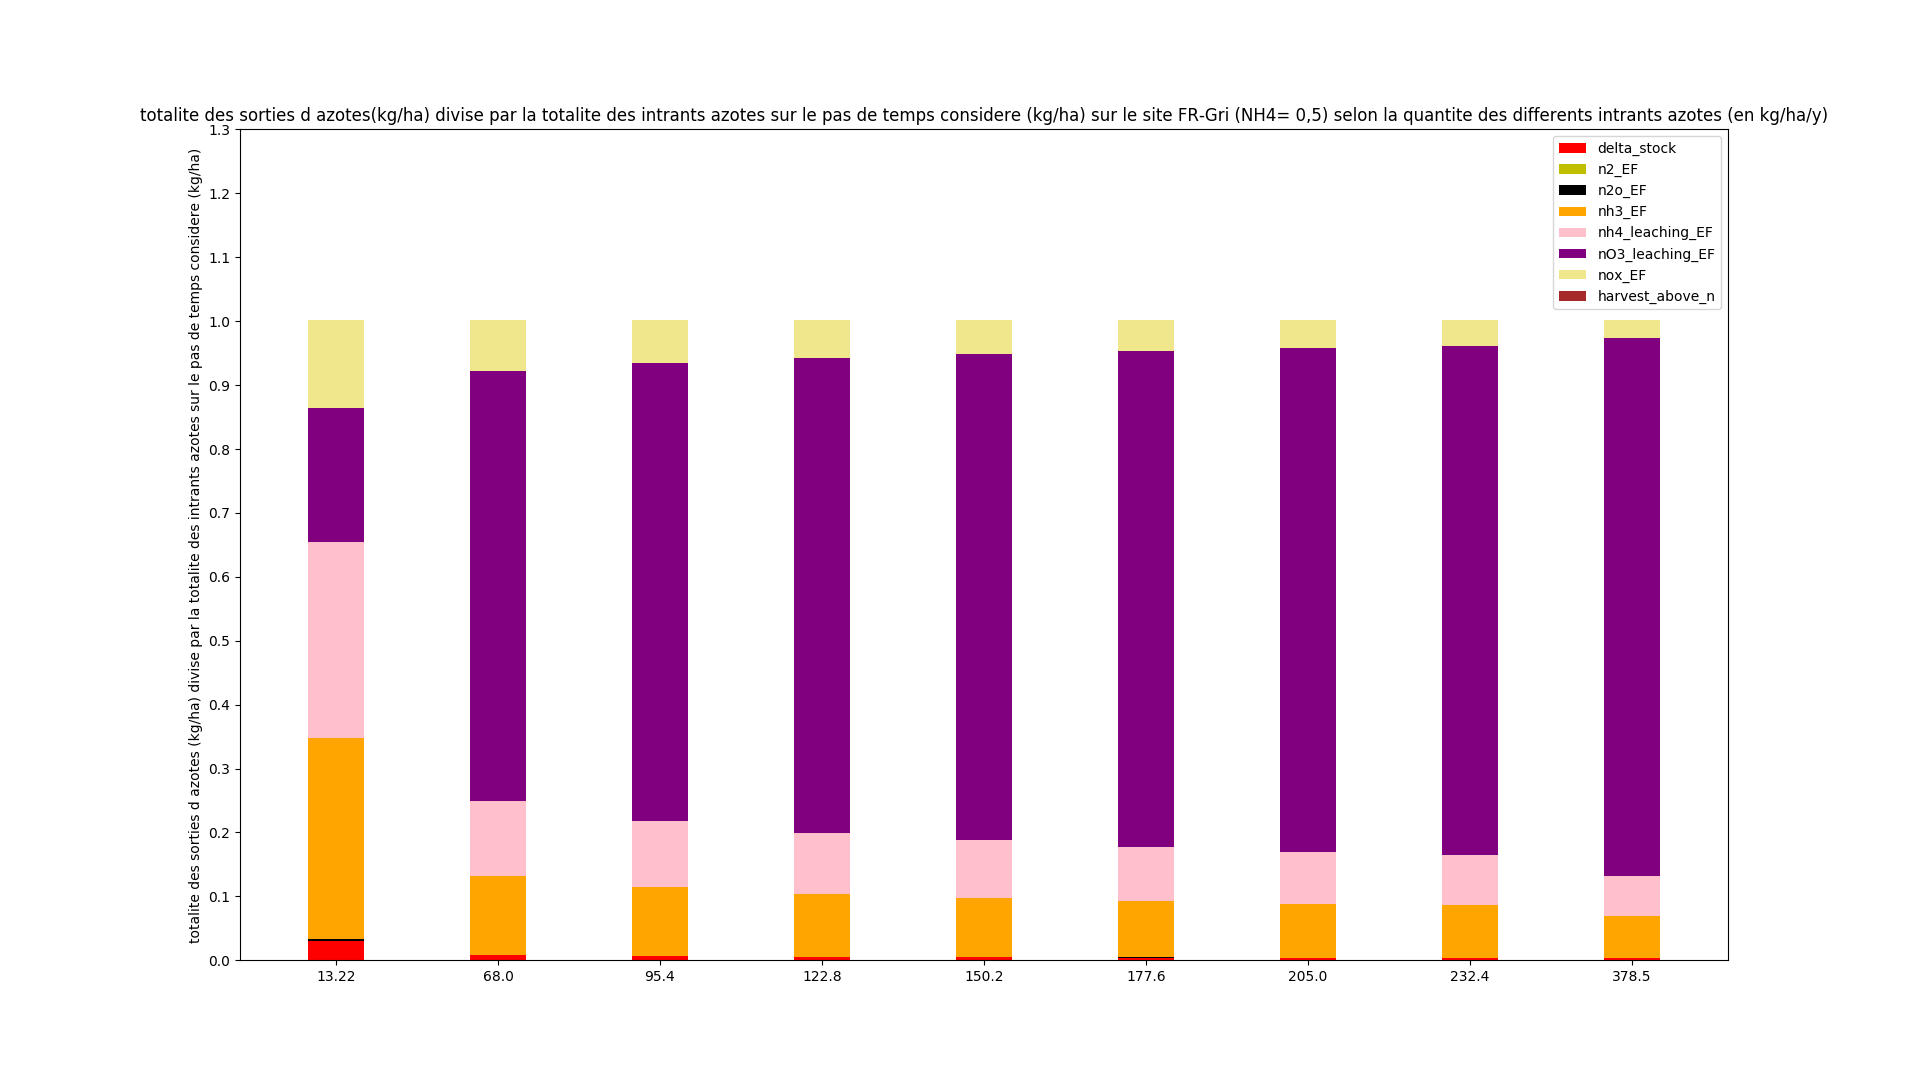
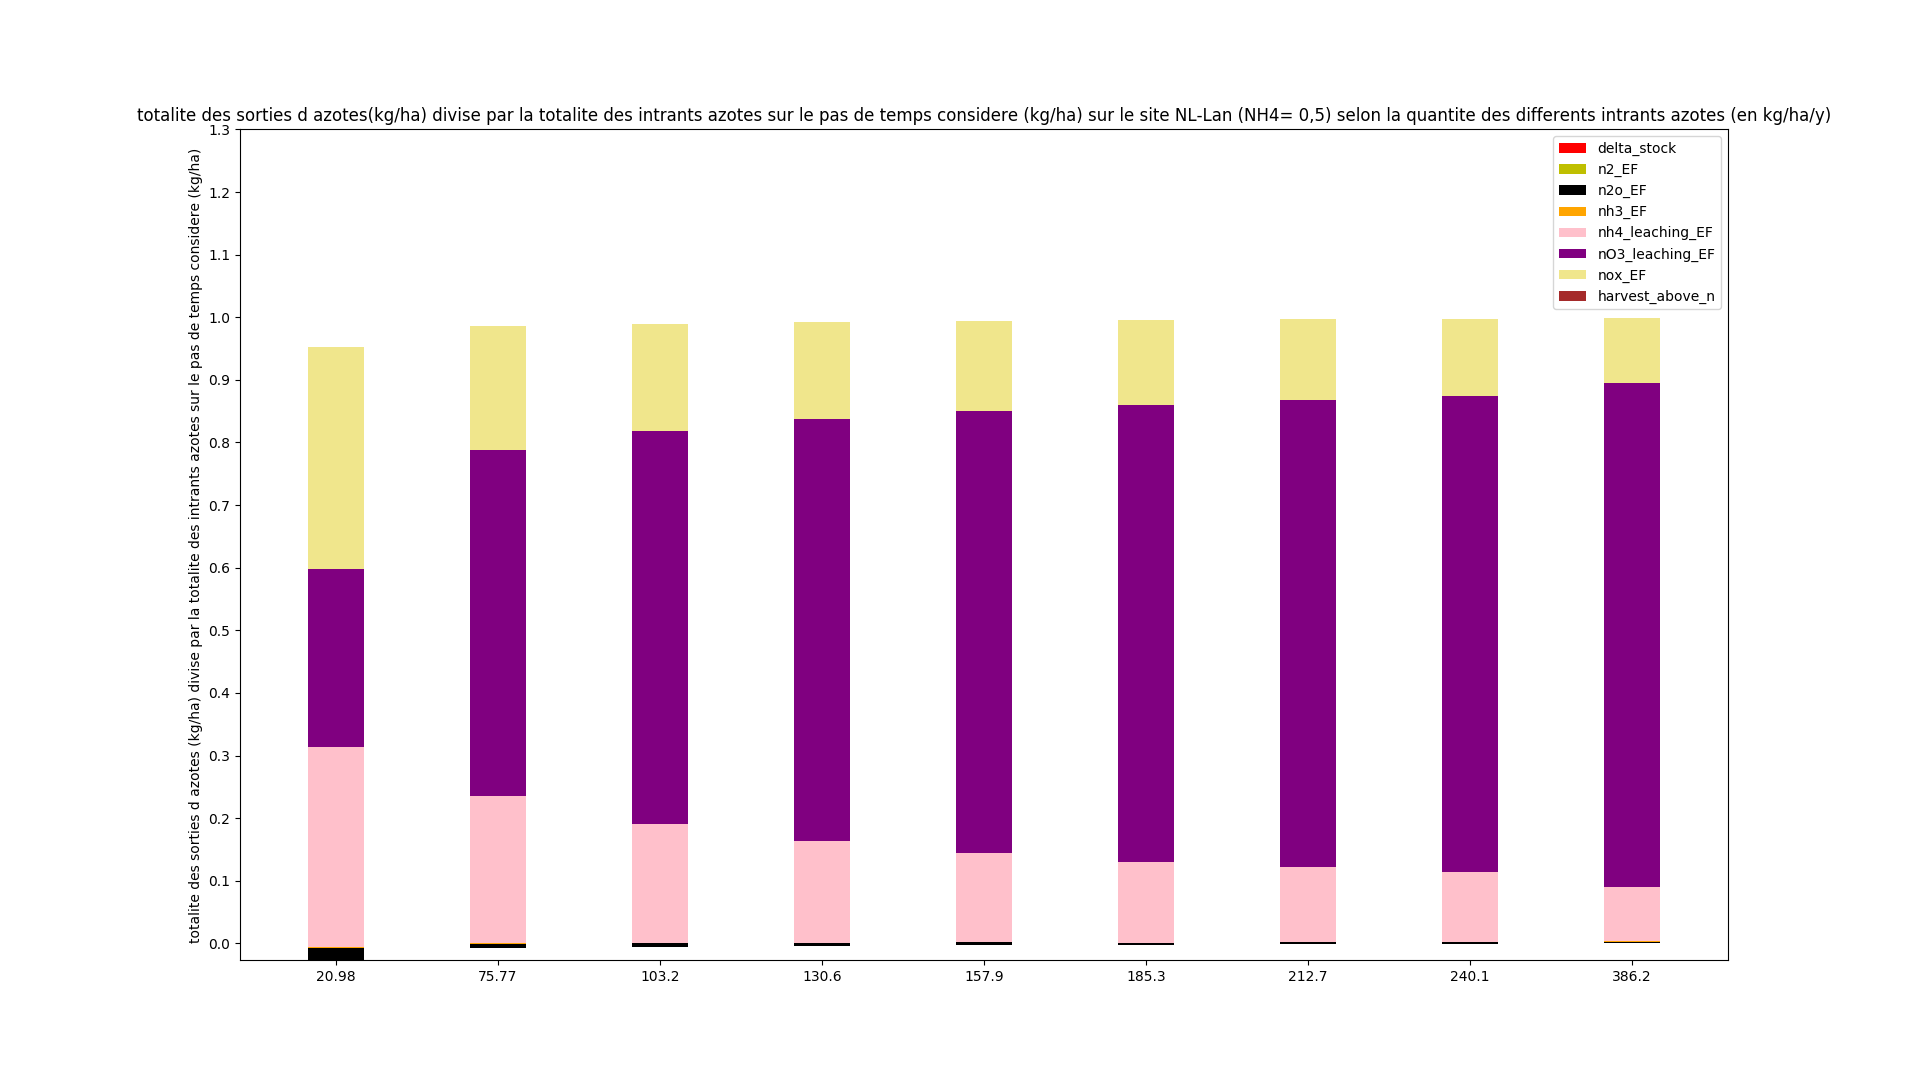
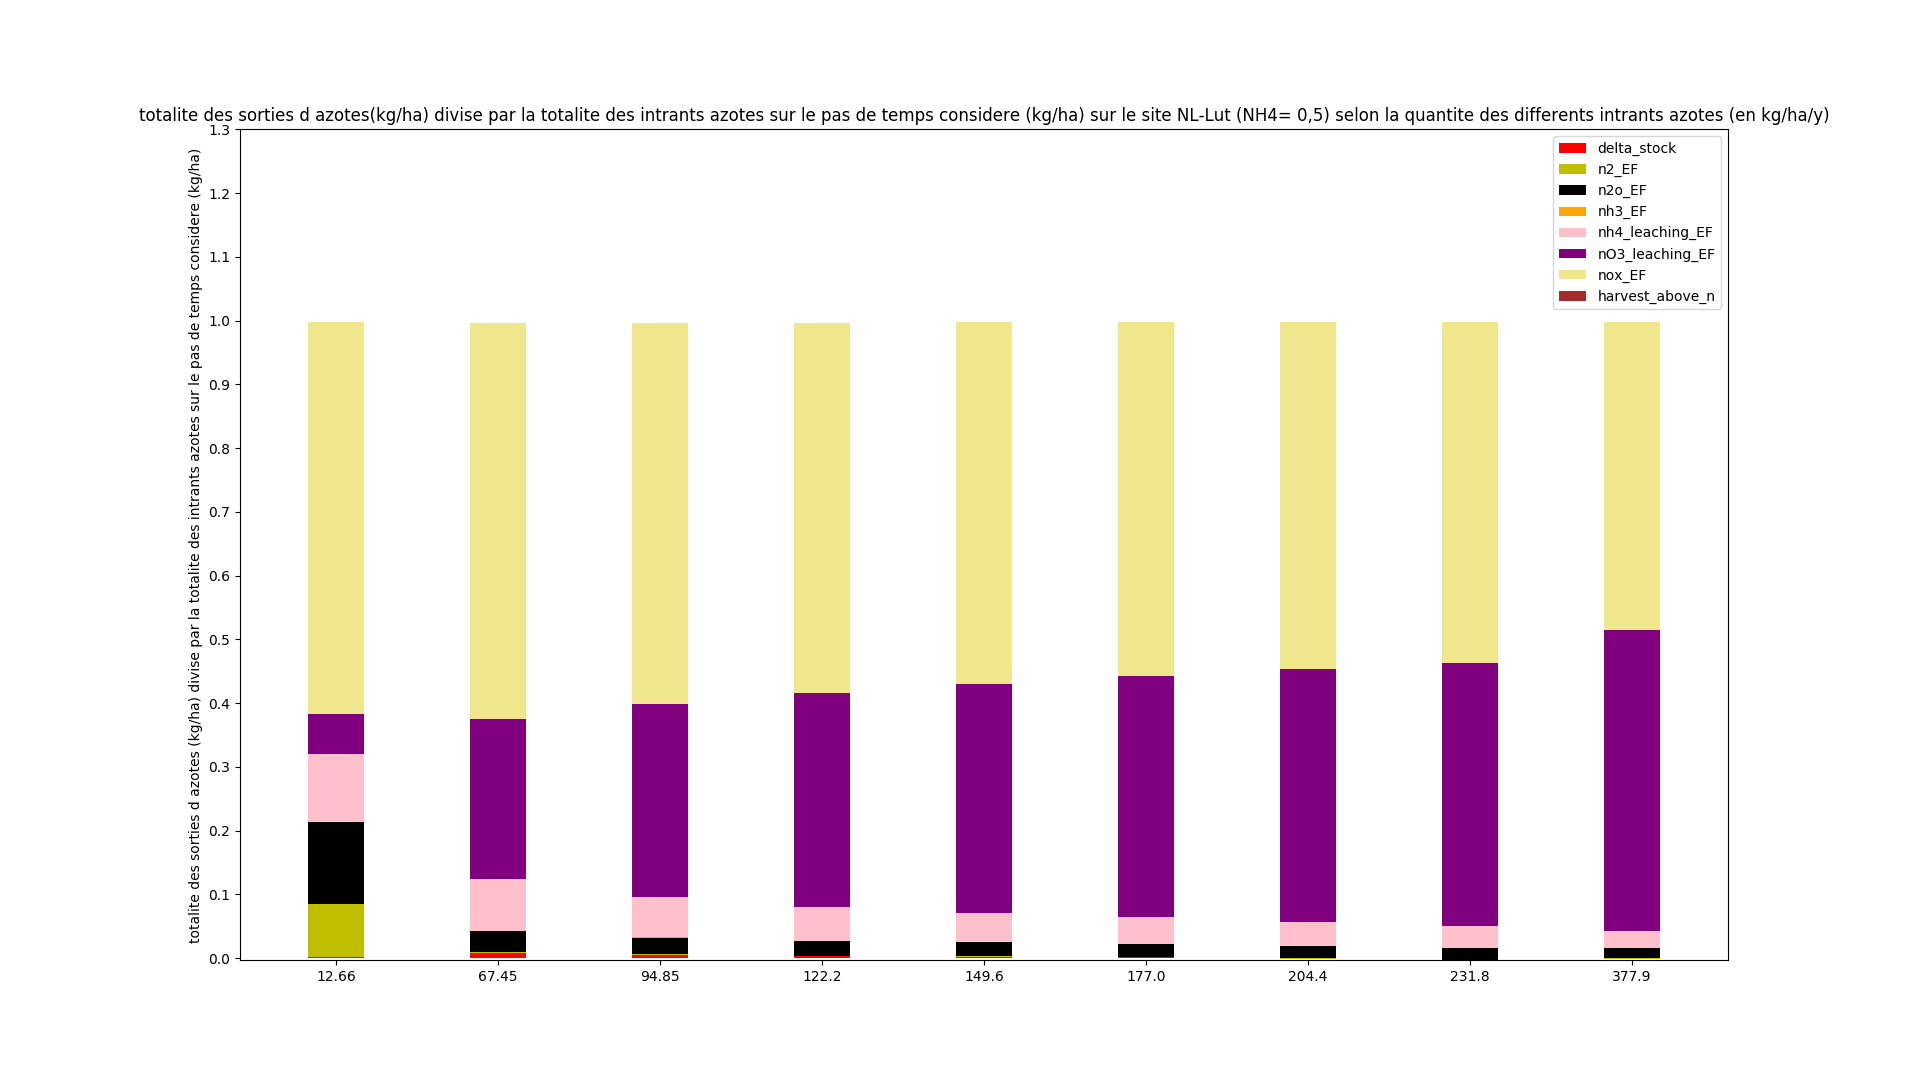
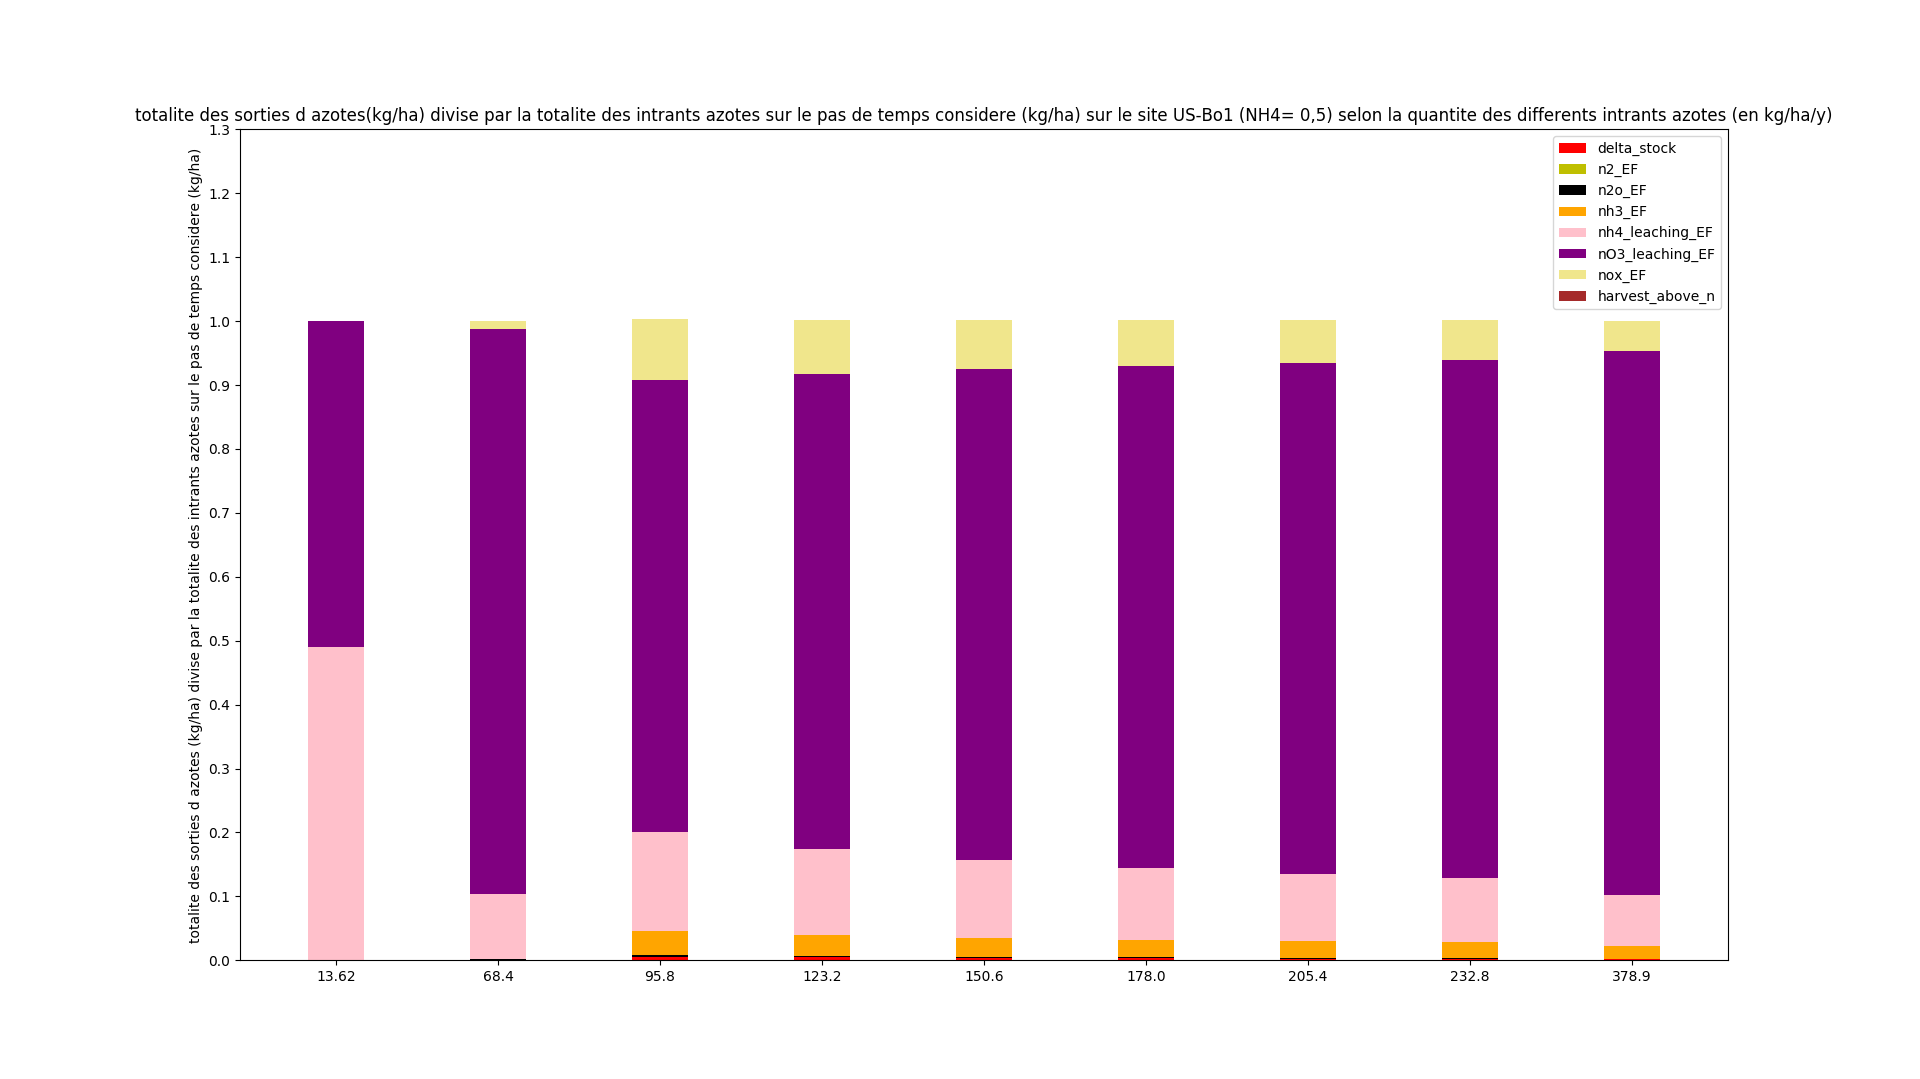
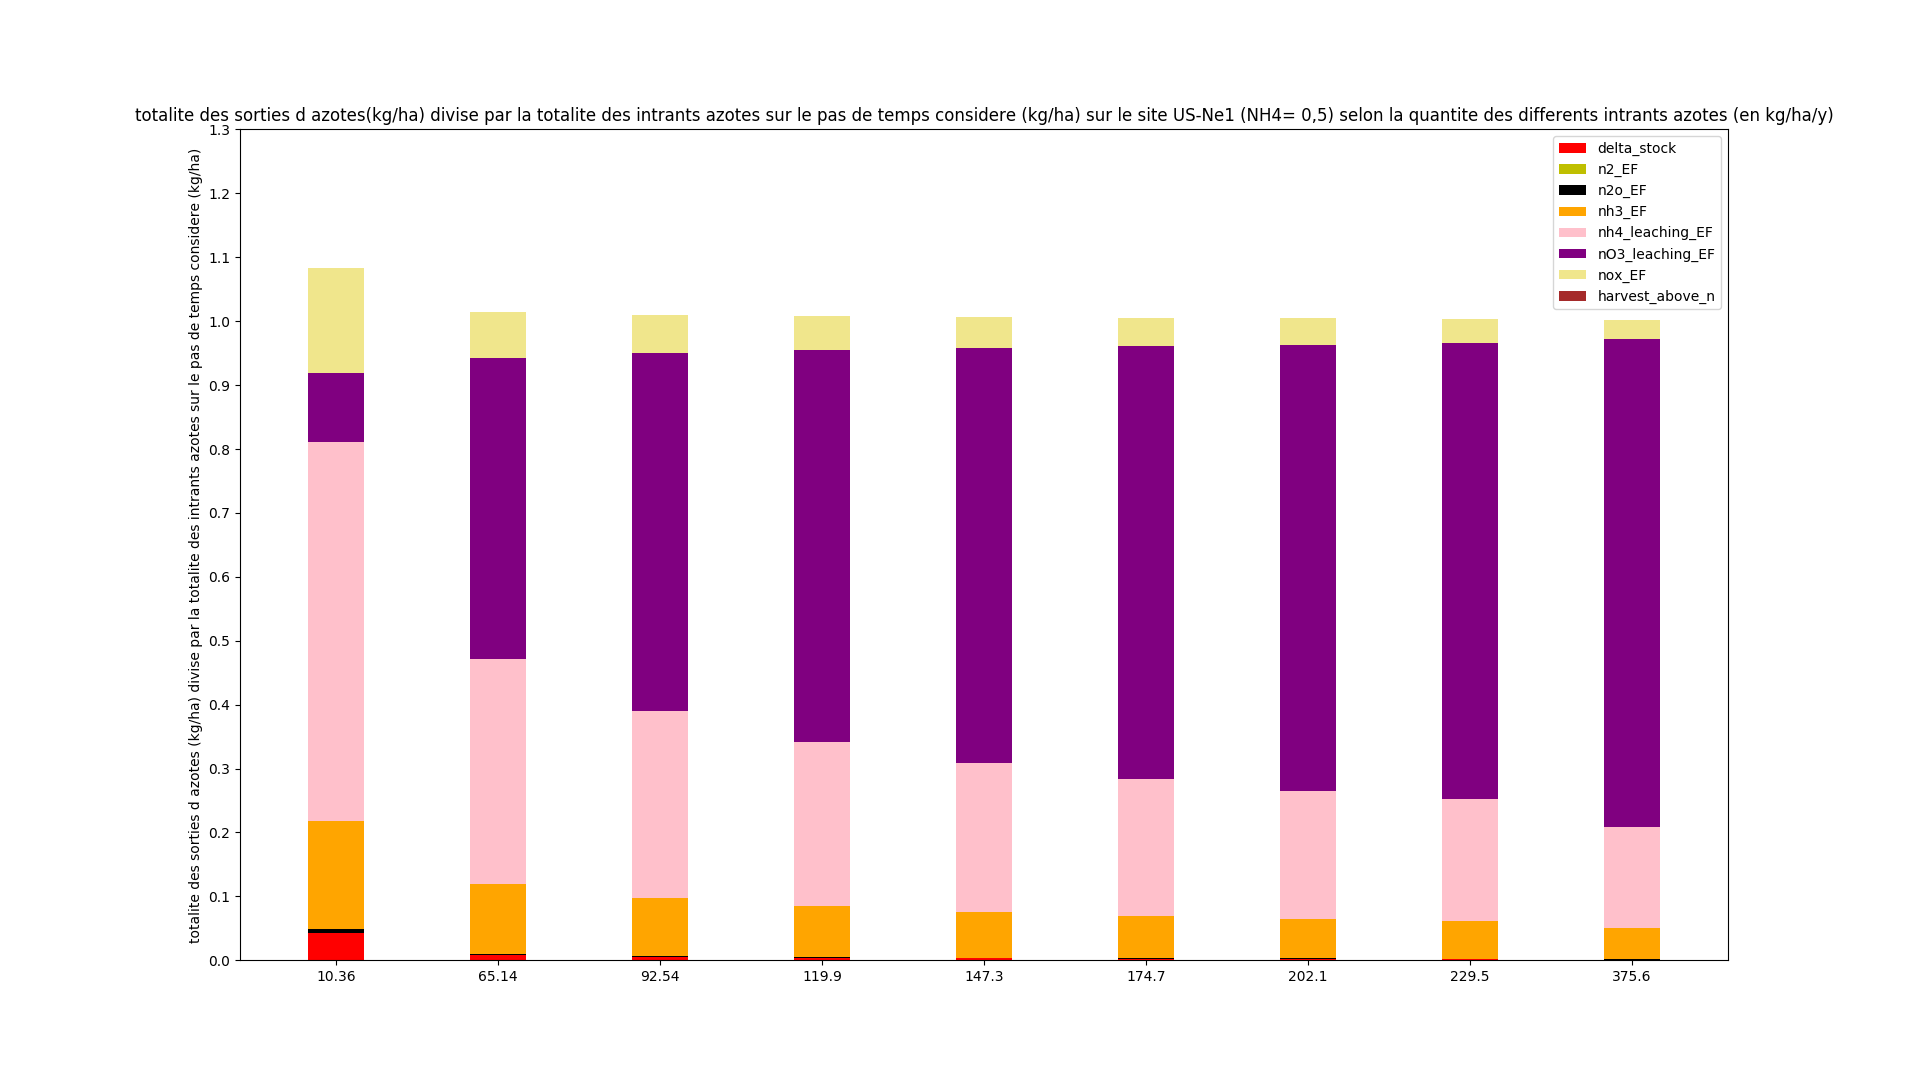
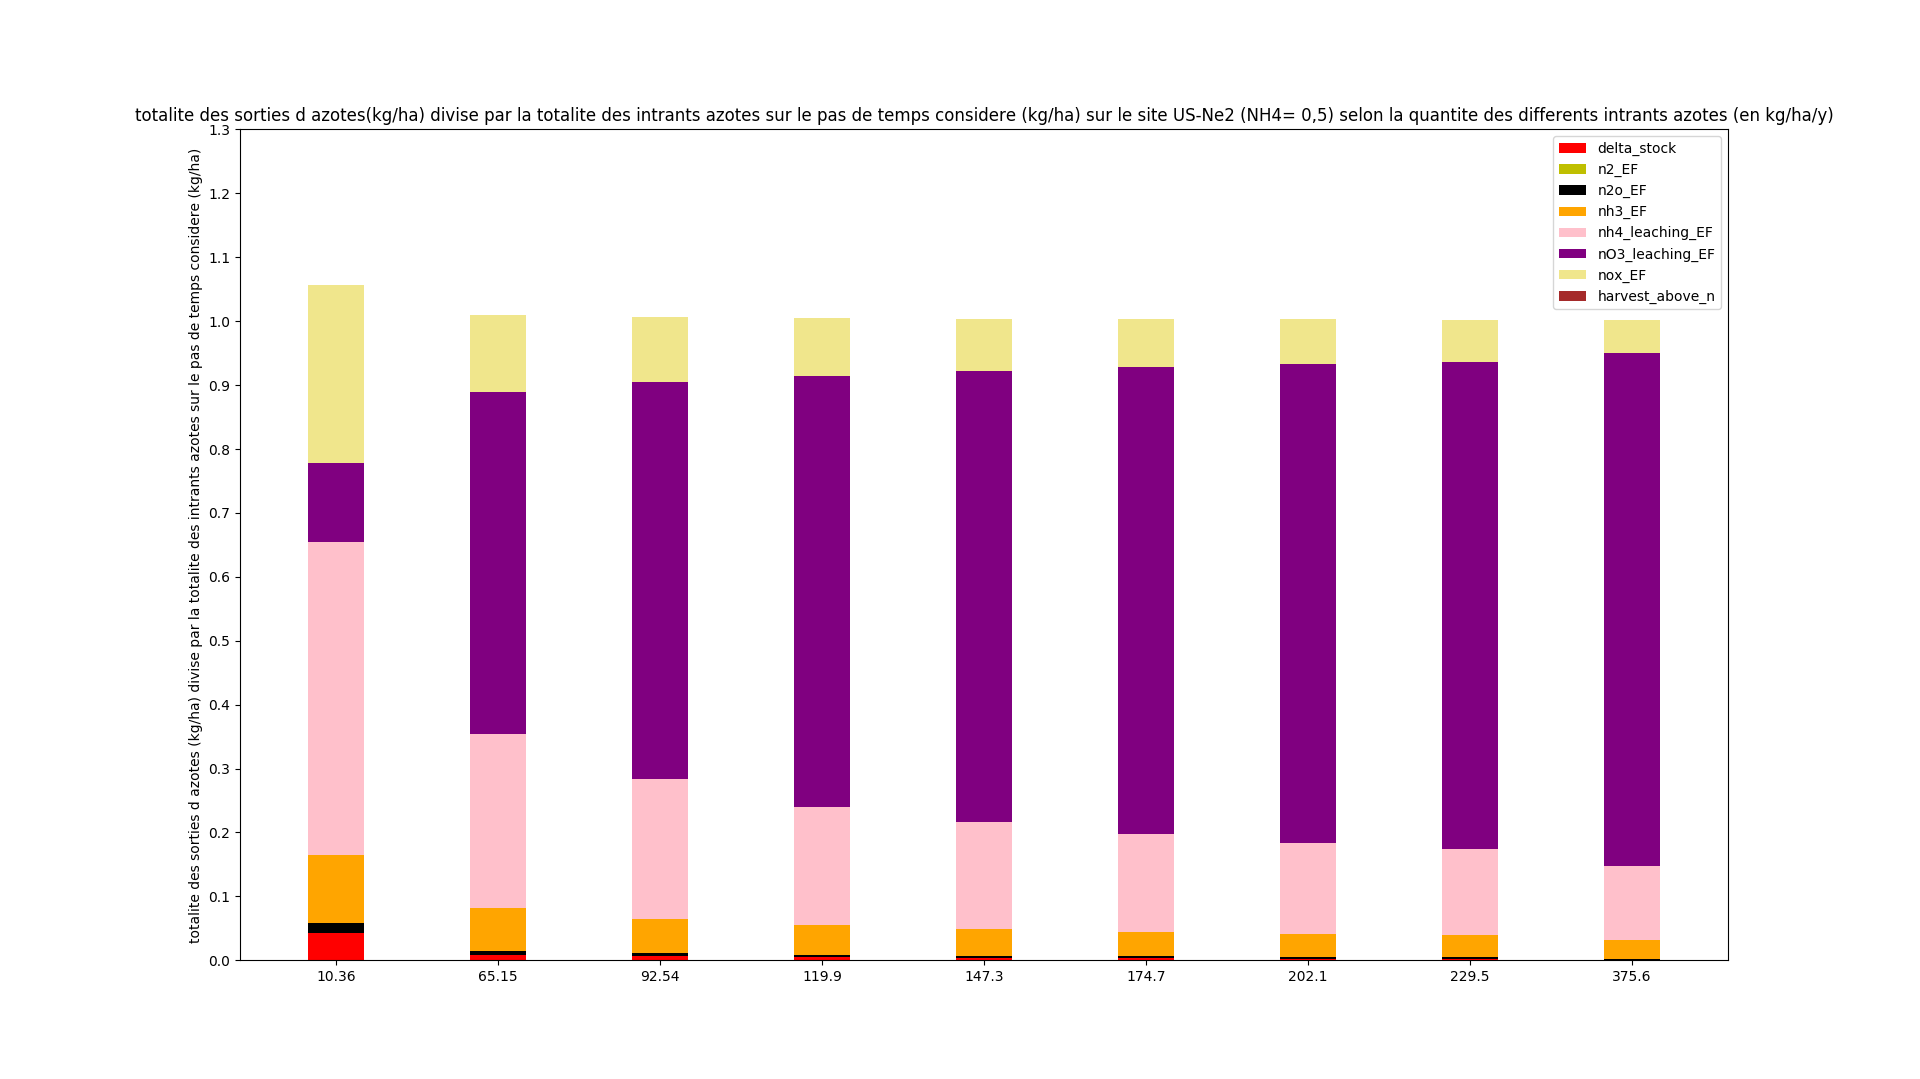
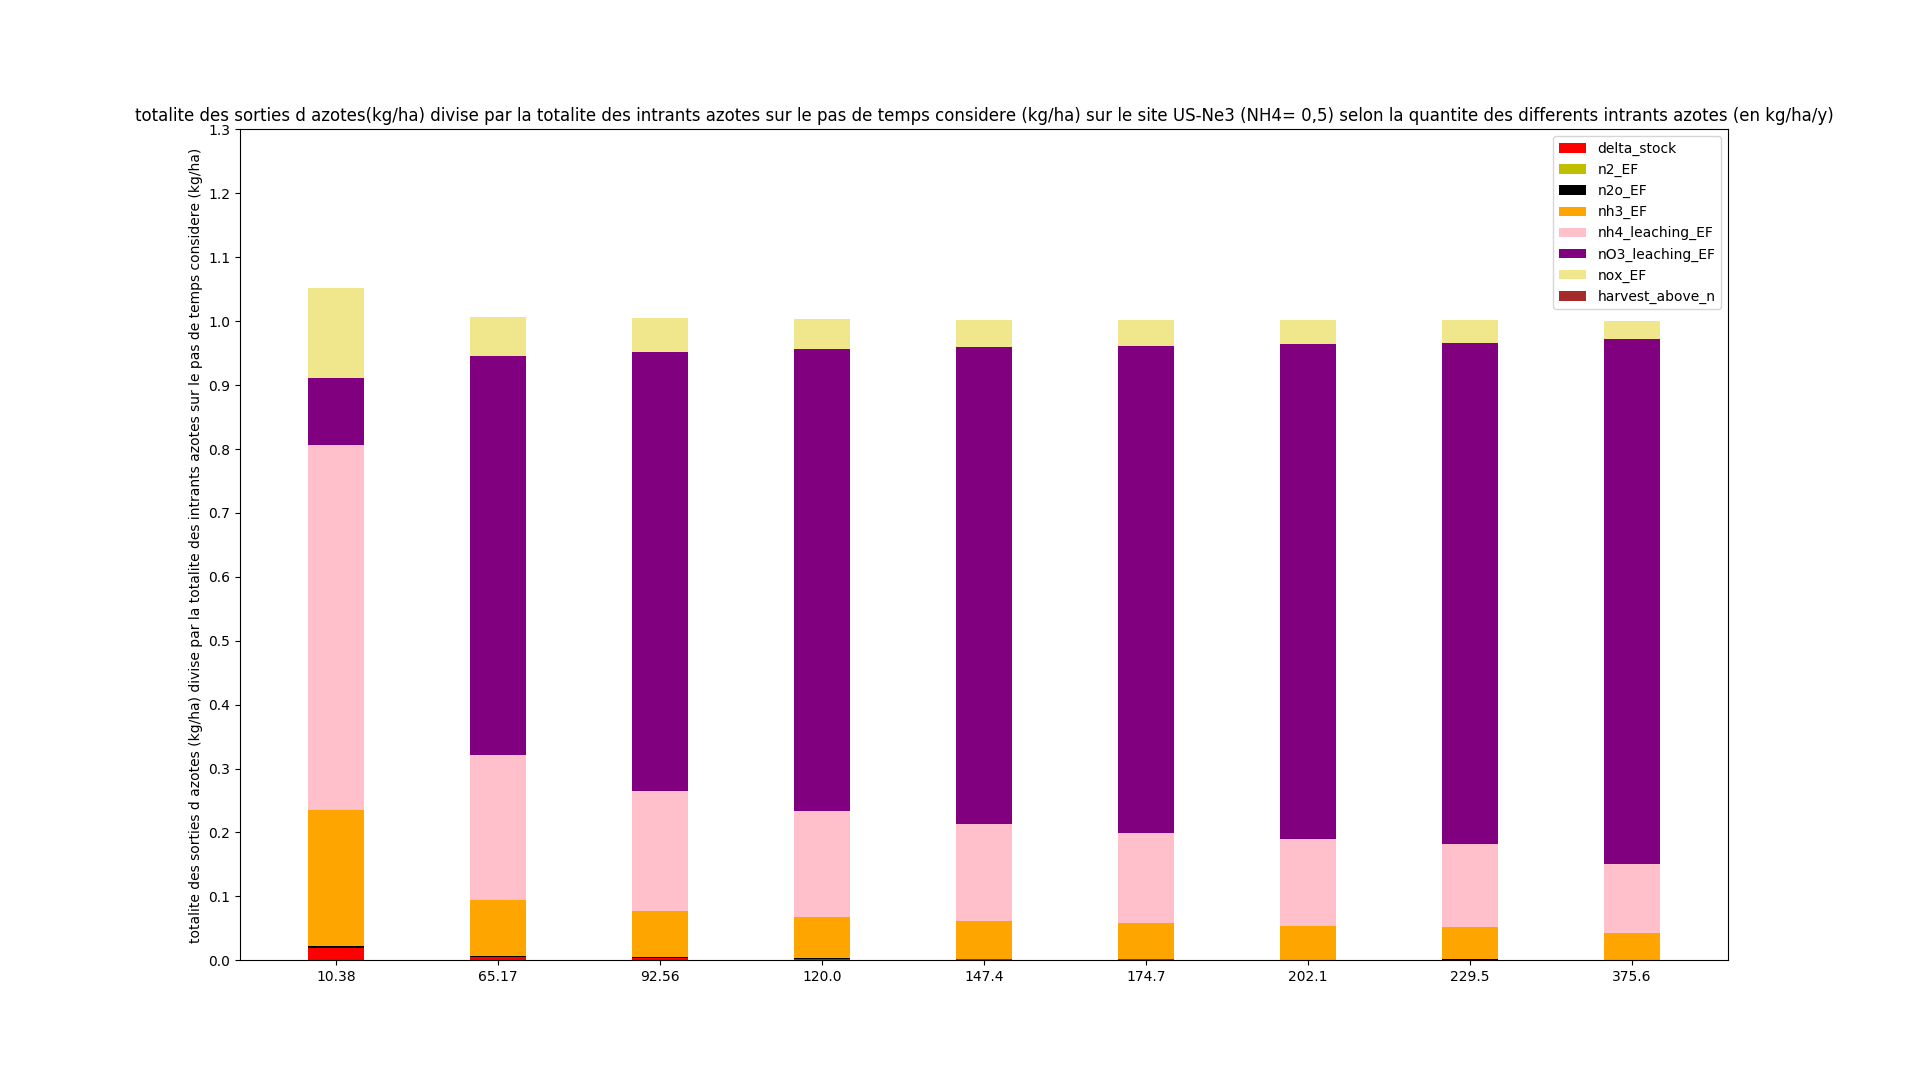
Closure of the inorganic nitrogen pools (method e)
We stacked in barplot all the nitrogen outputs (N2, N2O, NH3, NOX emissions ; NH4 and NO3 Leaching; NH4 and NO3 Plant Uptake ; difference between nitrogen pools shown previously) divided by all nitrogen inputs (NOX and NHX deposition; Mineralisation but also Fertilizer)
path : /home/orchidee03/taudoux/documents/Results/B/EFe/
python : barplot_e.py arg1=name of the site
Values in abscissa correspond to all nitrogen inputs but the fertilization is for each point : 0 , 54.8 , 82.2 , 109.6 , 140 , 164.4 , 191.8 , 219.2 , 365.25 kg/ha/y.
| DK-Ris
|
|---|
| 0.5 | 0.8
|
|---|
 | 
|
|---|
| FR-Gri
|
|---|
| 0.5 | 0.8
|
|---|
 | 
|
|---|
| NL-Lan
|
|---|
| 0.5 | 0.8
|
|---|
 | 
|
|---|
| NL-Lut
|
|---|
| 0.5 | 0.8
|
|---|
 | 
|
|---|
| US-Bo1
|
|---|
| 0.5 | 0.8
|
|---|
 | 
|
|---|
| US-Ne1
|
|---|
| 0.5 | 0.8
|
|---|
 | 
|
|---|
| US-Ne2
|
|---|
| 0.5 | 0.8
|
|---|
 | 
|
|---|
| US-Ne3
|
|---|
| 0.5 | 0.8
|
|---|
 | 
|
|---|
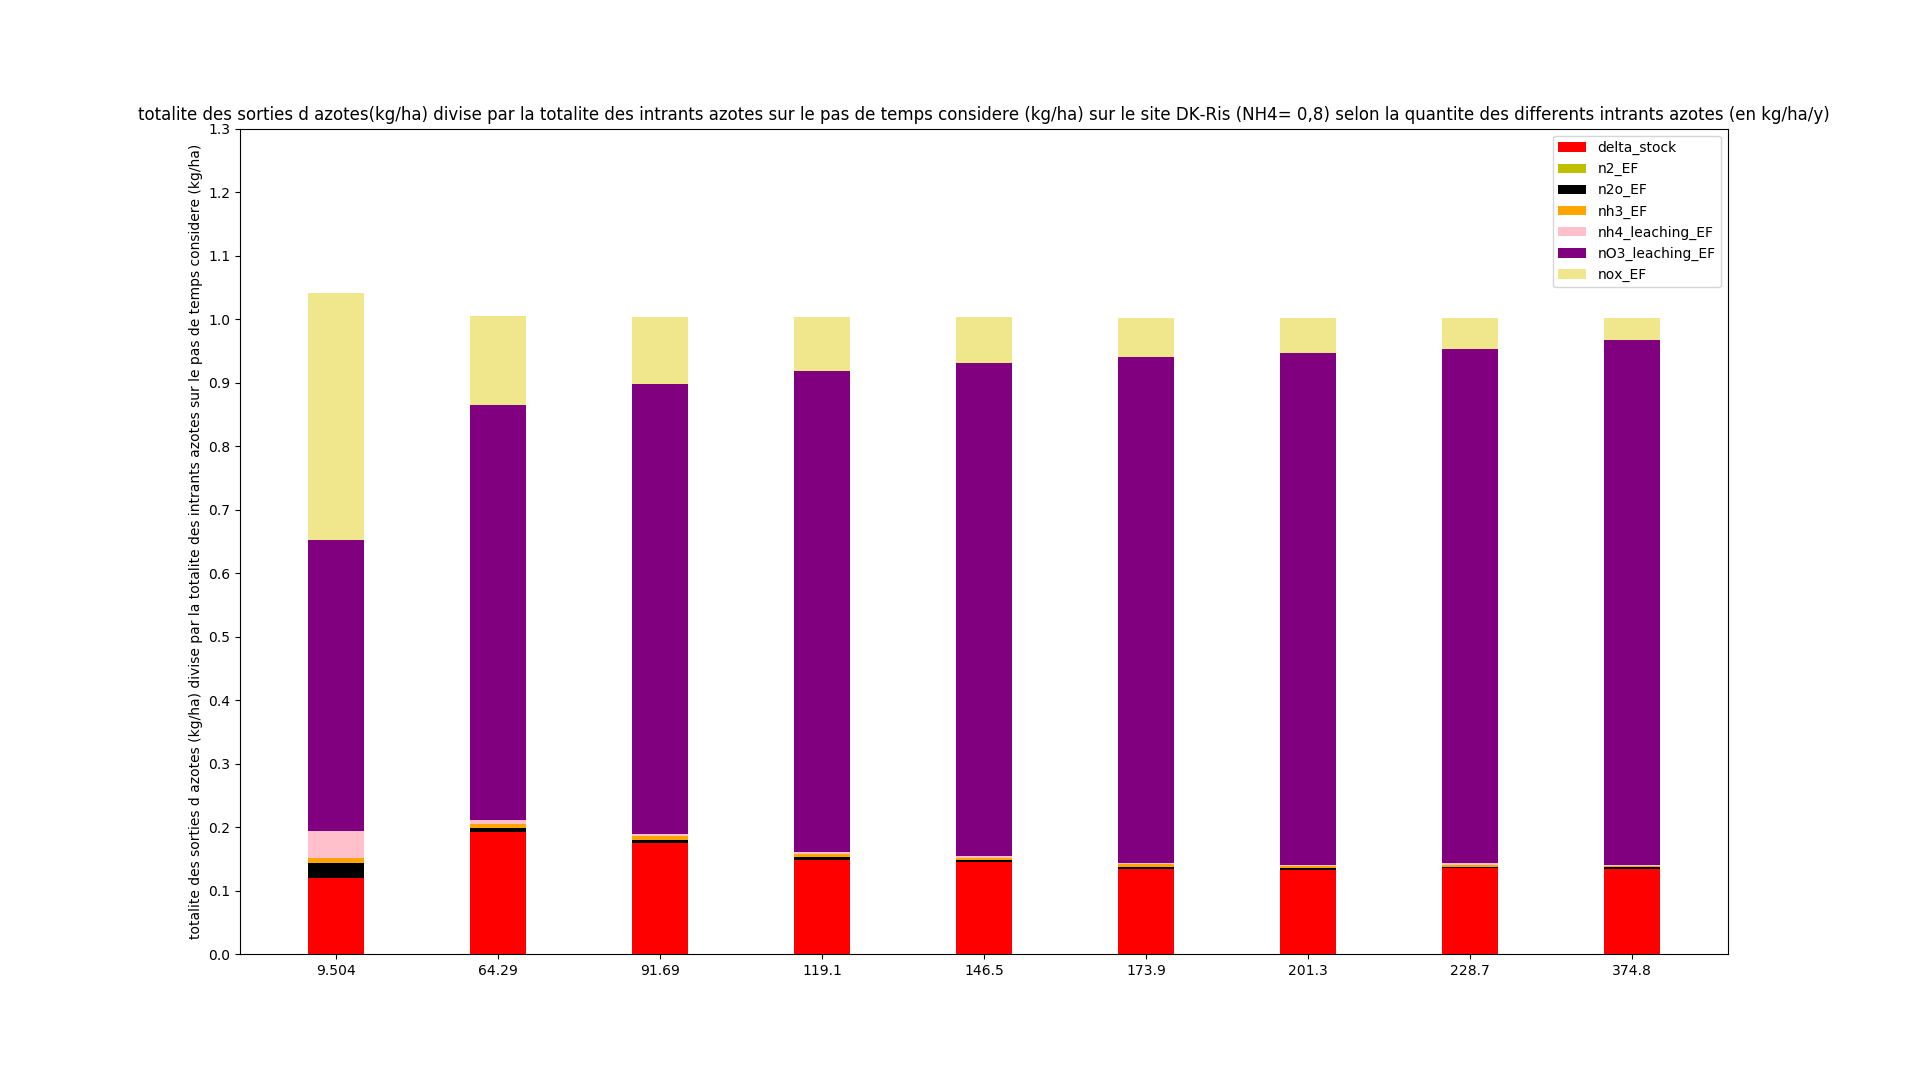
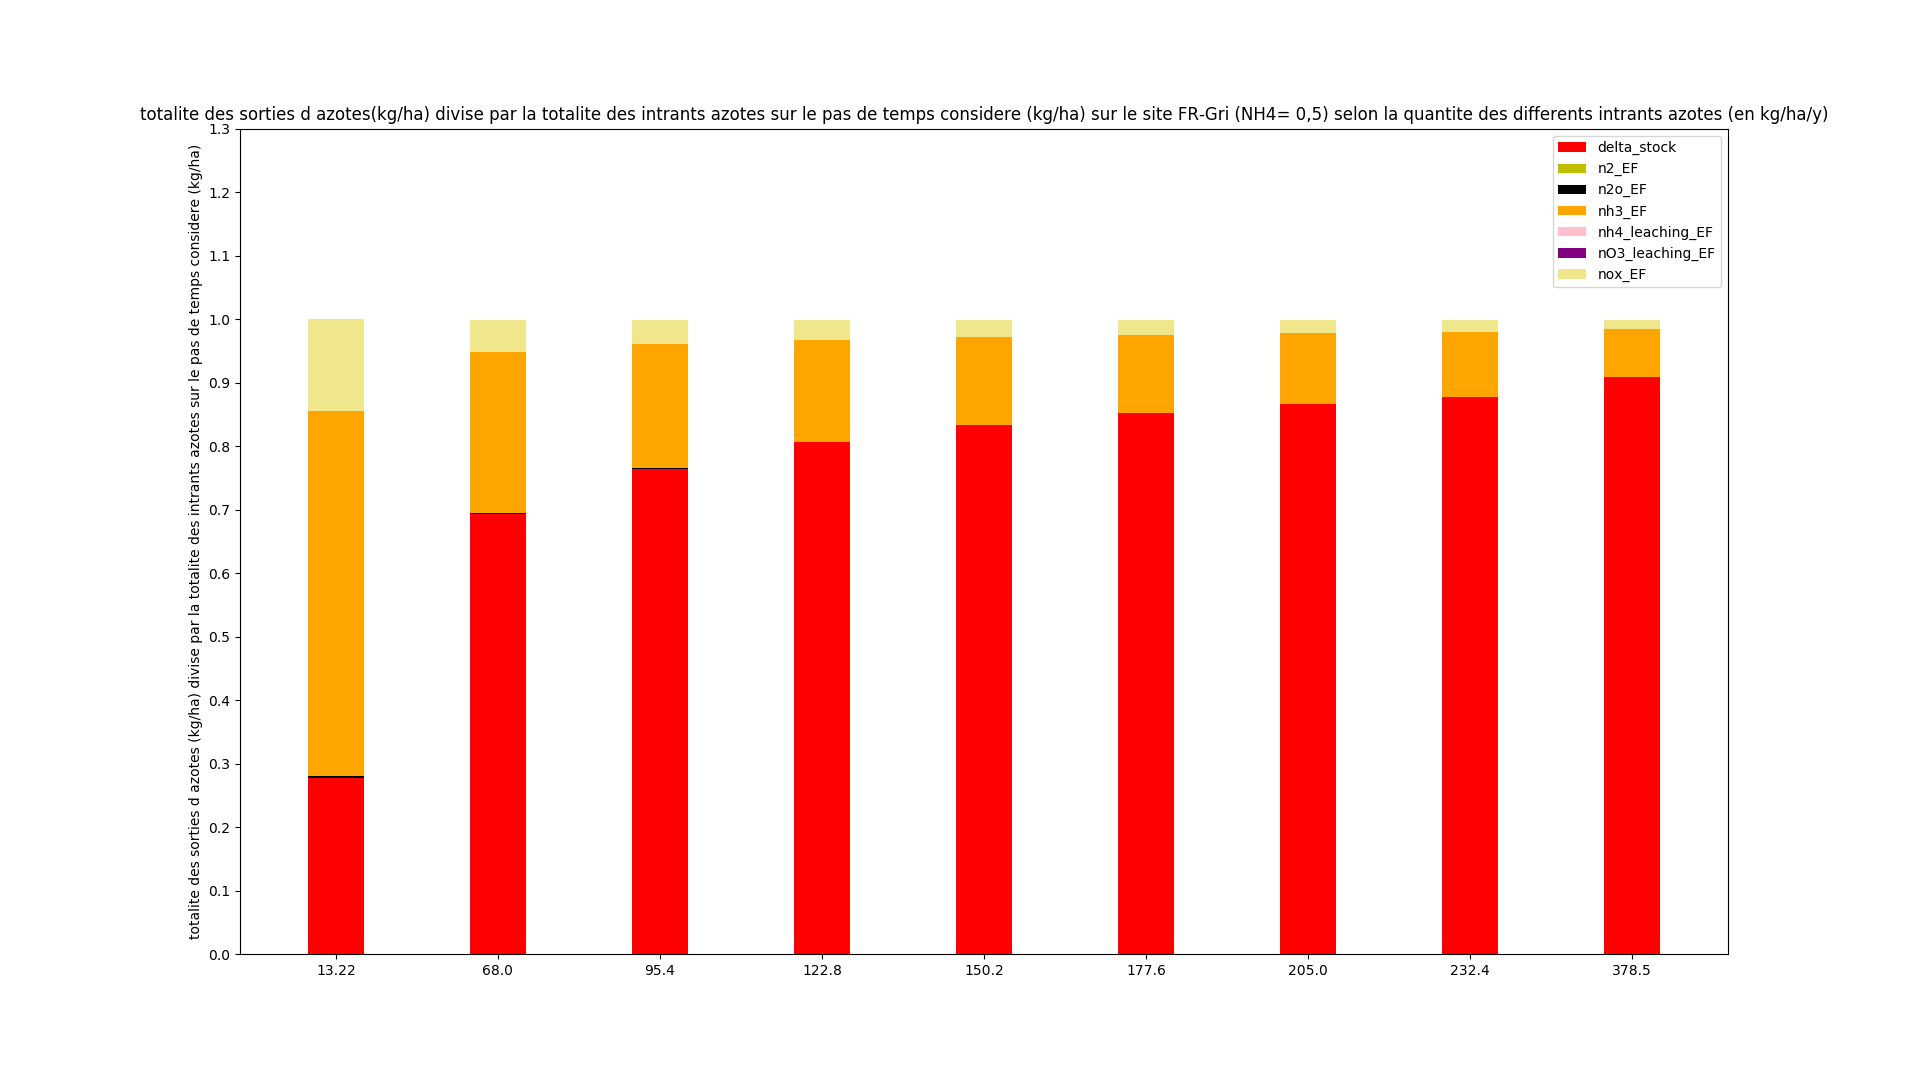
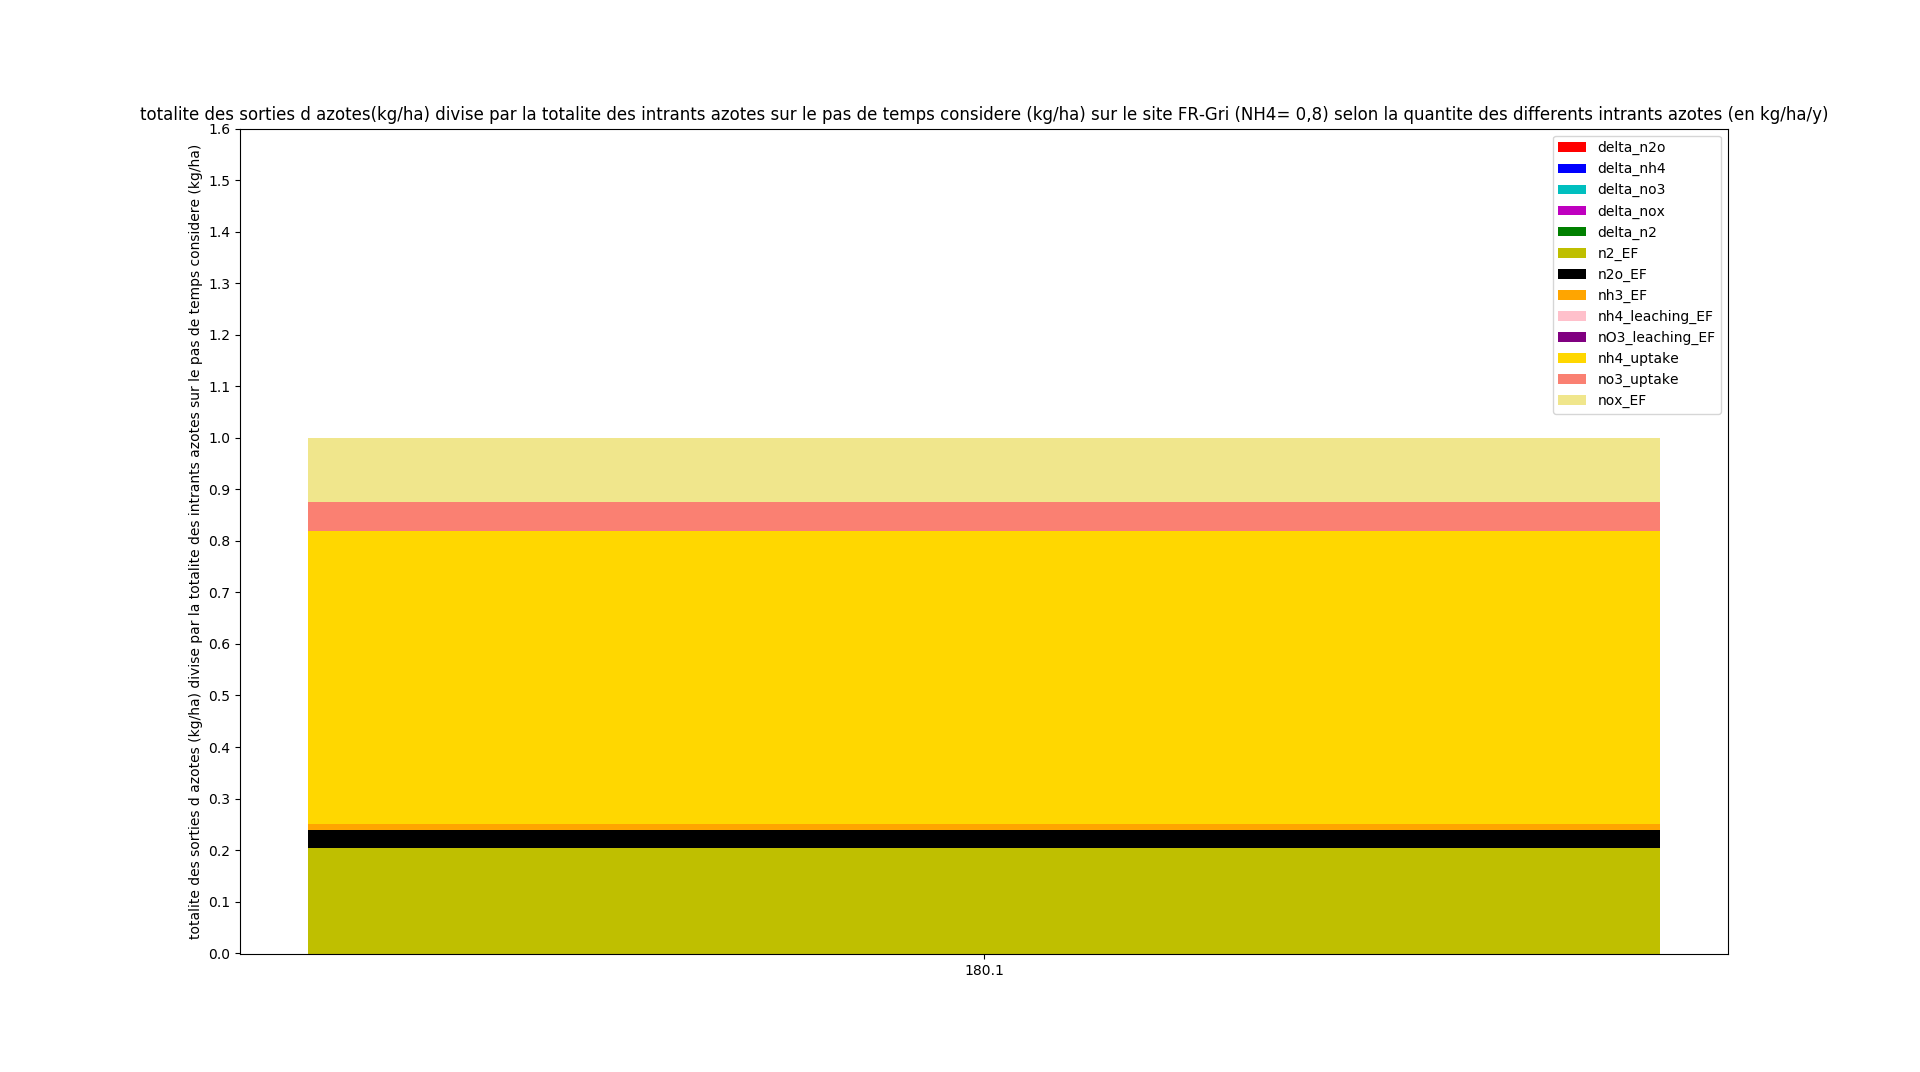
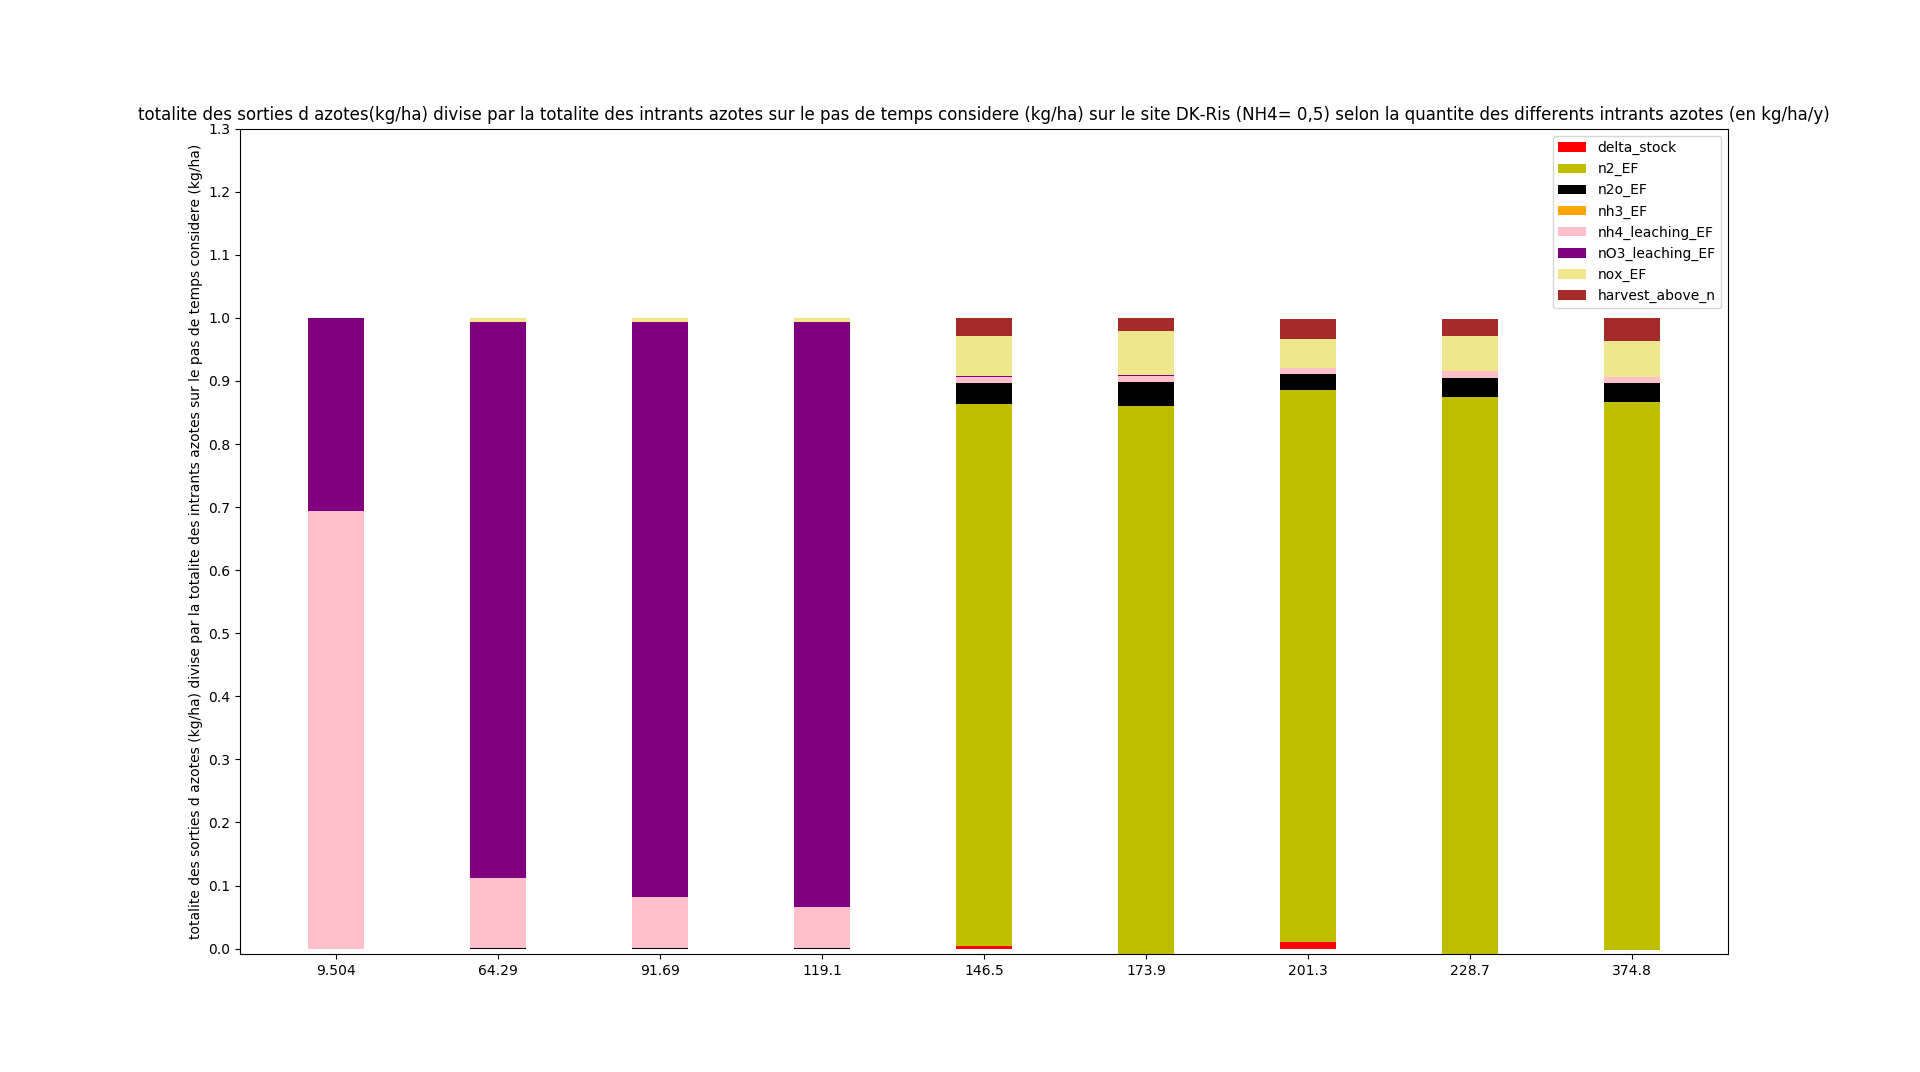
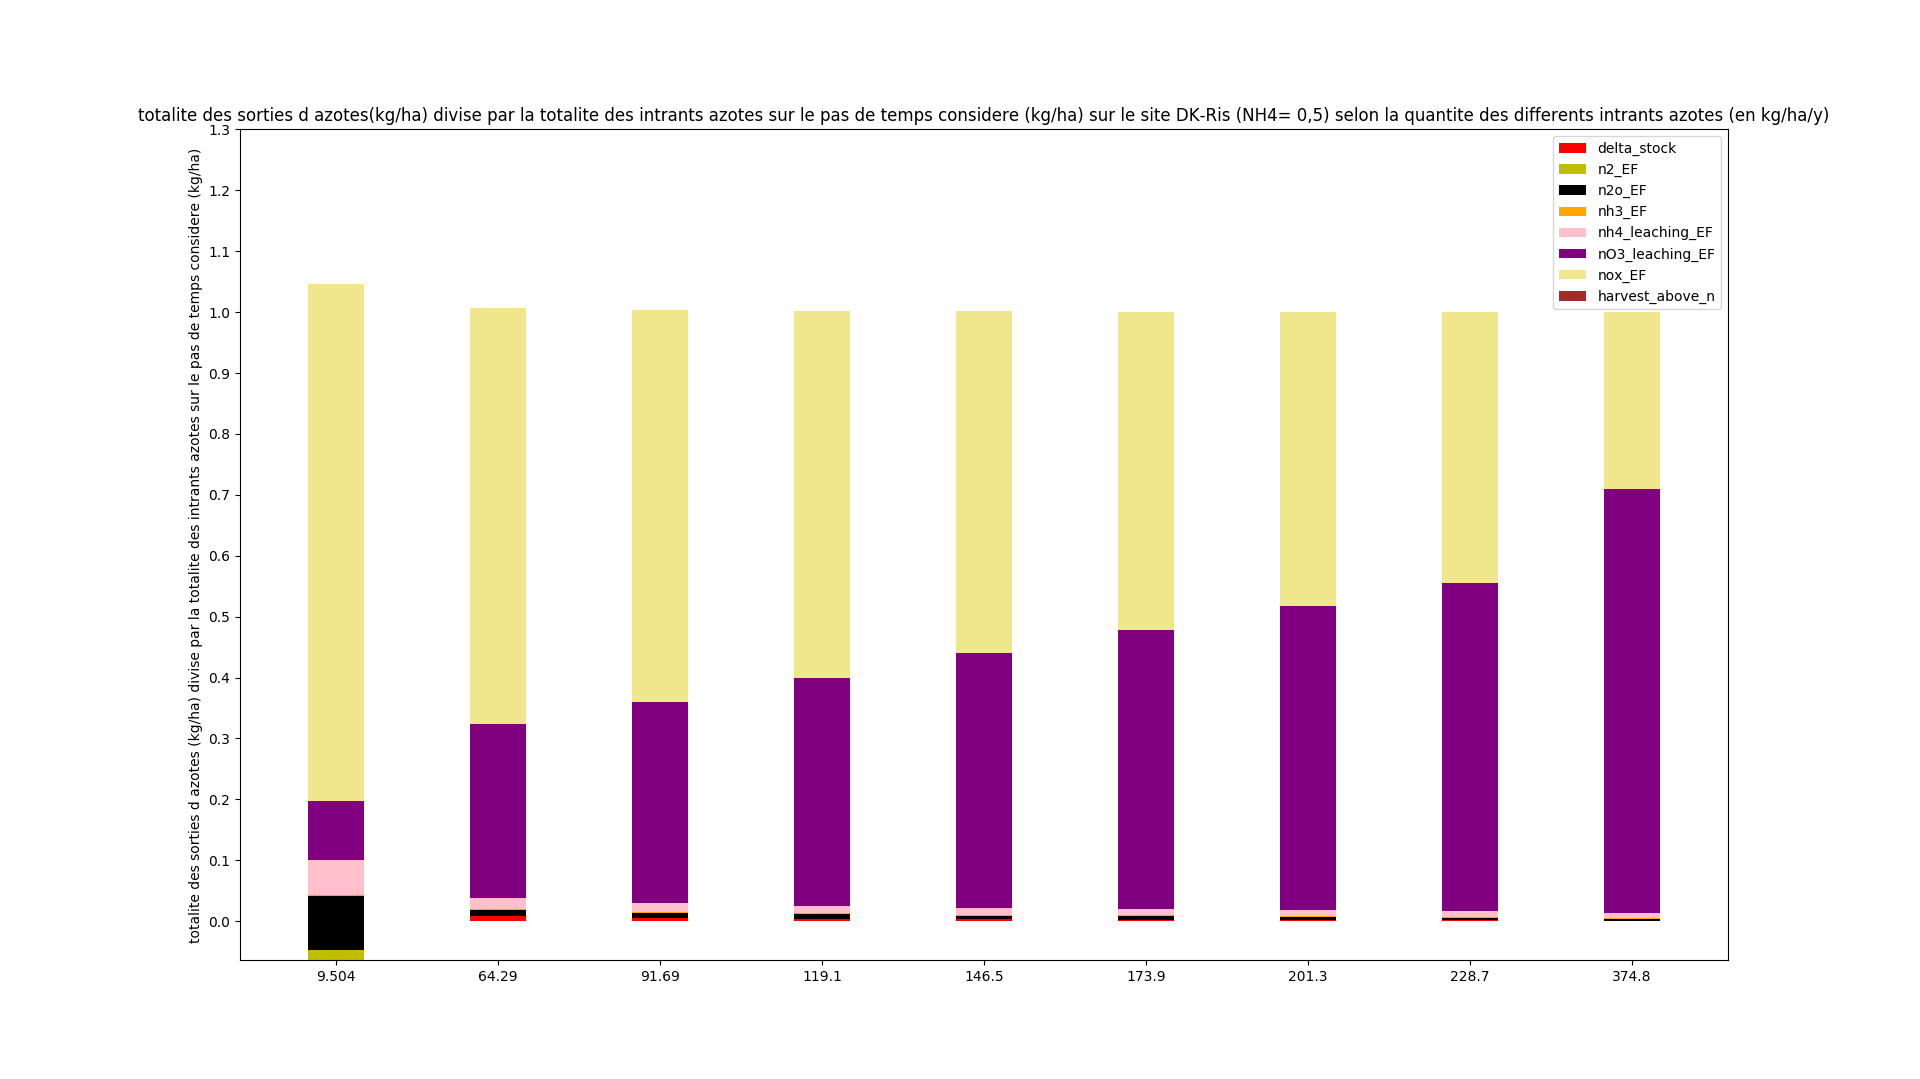
Closure of the N mass in ORCHIDEE model (method ebis)
We stacked in barplot all the nitrogen outputs (N2, N2O, NH3, NOX emissions ; NH4 and NO3 Leaching; ; difference between nitrogen pools shown previously + difference between SOIL_ACTIVE_N , SOIL_SURF_N , SOIL_SLOW_N , SOIL_PASSIVE_N , TOTAL_M_N LITTER_STR_AB_N , LITTER_MET_AB_N , LITTER_STR_BE_N , LITTER_MET_BE_N , LITTER_WOD_AB_N , LITTER_WOD_BE_N); divided by all nitrogen inputs (NOX and NHX deposition and fertilizer)
path : /home/orchidee03/taudoux/documents/Results/B/EFebis/
barplot_ebis.py arg1=name of the site
| DK-Ris
|
|---|
| 0.5 | 0.8
|
|---|
 | 
|
|---|
| FR-Gri
|
|---|
| 0.5 | 0.8
|
|---|
 | 
|
|---|
| NL-Lan
|
|---|
| 0.5 | 0.8
|
|---|
 | 
|
|---|
| NL-Lut
|
|---|
| 0.5 | 0.8
|
|---|
 | 
|
|---|
| US-Bo1
|
|---|
| 0.5 | 0.8
|
|---|
 | 
|
|---|
| US-Ne1
|
|---|
| 0.5 | 0.8
|
|---|
 | 
|
|---|
| US-Ne2
|
|---|
| 0.5 | 0.8
|
|---|
 | 
|
|---|
| US-Ne3
|
|---|
| 0.5 | 0.8
|
|---|
 | 
|
|---|
We can see that there is a problem with NO3 stocks that are continually increasing or leached. It must be a problem with the denitrification. So we looked at the parameterization and saw that a variable called "anvf" takes an important role about denitrifiers. In order to know its effect, we ran a simulation in which this variable was deleted.
Here are the results :
path : /home/orchidee03/taudoux/documents/Results/B/EFi/
python : barplot_init.py arg1=name of the site
| FR-Gri
|
|---|
| 0.8
|
|---|
|
|---|
| US-Ne1
|
|---|
| 0.8
|
|---|
|
|---|
| US-Ne2
|
|---|
| 0.8
|
|---|
|
|---|
| US-Ne3
|
|---|
| 0.8
|
|---|
|
|---|
E. Evaluation of a new model version for denitrification v2 corresponds to the upper bound
Run_off, the variable "harvest_above_n" were added and the denitrifiers activity was changed (UPPER BOUND).
We no longer take into account the dynamics of the denitrifiers and take the upper bound that is 0.25*som(:,iactive,m,icarbon)
In the previous code :
1059 - bact(:,m) = MAX(MIN(bact(:,m),0.25*som(:,iactive,m,icarbon)),&
1060 - 0.0005*som(:,iactive,m,icarbon))
path of files.txt : /home/orchidee03/taudoux/documents/Results/B/Simul_ratio0.5_v2
We looked again at the differents loops.
Closure of the inorganic nitrogen pools (method f)
path : /home/orchidee03/taudoux/documents/Results/B/EFf/
python : barplot_f.py arg1=name of the site
| DK-Ris
|
|---|
| 0.5
|
|---|
|
|---|
| FR-Gri
|
|---|
| 0.5
|
|---|
|
|---|
| NL-Lan
|
|---|
| 0.5
|
|---|
|
|---|
| NL-Lut
|
|---|
| 0.5
|
|---|
|
|---|
| US-Bo1
|
|---|
| 0.5
|
|---|
|
|---|
| US-Ne1
|
|---|
| 0.5
|
|---|
|
|---|
| US-Ne2
|
|---|
| 0.5
|
|---|
|
|---|
| US-Ne3
|
|---|
| 0.5
|
|---|
|
|---|
Closure of the N mass in ORCHIDEE model (method g)
path : /home/orchidee03/taudoux/documents/Results/B/EFg/
python : barplot_g.py arg1=name of the site
| DK-Ris
|
|---|
| 0.5
|
|---|
|
|---|
| FR-Gri
|
|---|
| 0.5
|
|---|
|
|---|
| NL-Lan
|
|---|
| 0.5
|
|---|
|
|---|
| NL-Lut
|
|---|
| 0.5
|
|---|
|
|---|
| US-Bo1
|
|---|
| 0.5
|
|---|
|
|---|
| US-Ne1
|
|---|
| 0.5
|
|---|
|
|---|
| US-Ne2
|
|---|
| 0.5
|
|---|
|
|---|
| US-Ne3
|
|---|
| 0.5
|
|---|
|
|---|
This is just for the record, part F is more important than part E.
F. Evaluation of a new model version for denitrification v2 corresponds to the lower bound
the denitrifiers activity was changed (LOWER BOUND)
We no longer take into account the dynamics of the denitrifiers and take the lower bound that is 0.0005*som(:,iactive,m,icarbon)
In the previous code :
1059 - bact(:,m) = MAX(MIN(bact(:,m),0.25*som(:,iactive,m,icarbon)),&
1060 - 0.0005*som(:,iactive,m,icarbon))
path of files.txt : /home/orchidee03/taudoux/documents/Results/B/RundBis
We looked again at the differents loops.
Closure of the inorganic nitrogen pools (method fbis)
path : /home/orchidee03/taudoux/documents/Results/B/EFfbis/
python : barplot_fbis.py arg1=name of the site
| DK-Ris
|
|---|
| 0.5
|
|---|
|
|---|
| FR-Gri
|
|---|
| 0.5
|
|---|
|
|---|
| NL-Lan
|
|---|
| 0.5
|
|---|
|
|---|
| NL-Lut
|
|---|
| 0.5
|
|---|
|
|---|
| US-Bo1
|
|---|
| 0.5
|
|---|
|
|---|
| US-Ne1
|
|---|
| 0.5
|
|---|
|
|---|
| US-Ne2
|
|---|
| 0.5
|
|---|
|
|---|
| US-Ne3
|
|---|
| 0.5
|
|---|
|
|---|
Closure of the N mass in ORCHIDEE model (method gbis)
path : /home/orchidee03/taudoux/documents/Results/B/EFgbis/
python : barplot_gbis.py arg1=name of the site
| DK-Ris
|
|---|
| 0.5
|
|---|
|
|---|
| FR-Gri
|
|---|
| 0.5
|
|---|
|
|---|
| NL-Lan
|
|---|
| 0.5
|
|---|
|
|---|
| NL-Lut
|
|---|
| 0.5
|
|---|
|
|---|
| US-Bo1
|
|---|
| 0.5
|
|---|
|
|---|
| US-Ne1
|
|---|
| 0.5
|
|---|
|
|---|
| US-Ne2
|
|---|
| 0.5
|
|---|
|
|---|
| US-Ne3
|
|---|
| 0.5
|
|---|
|
|---|
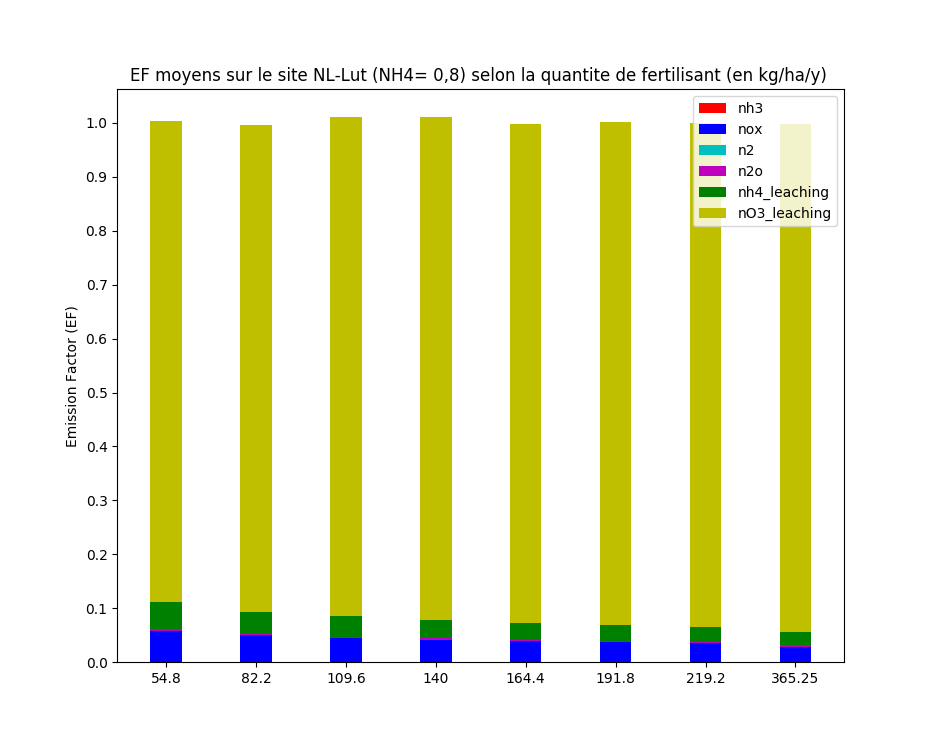
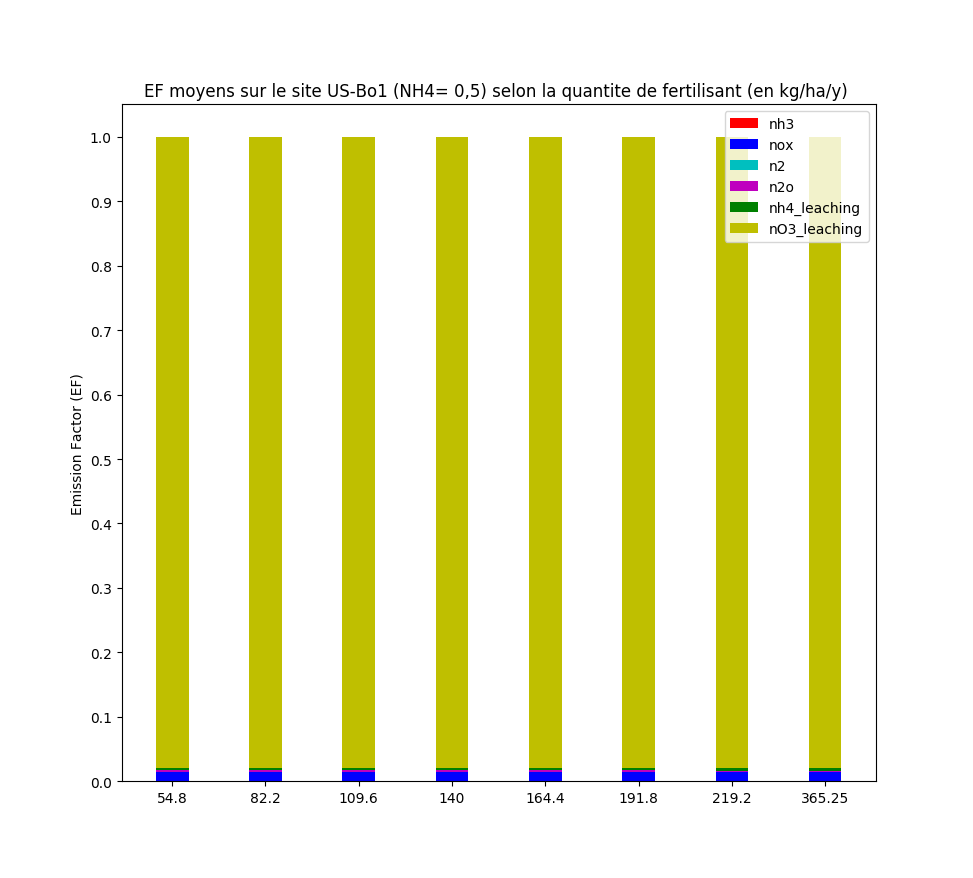
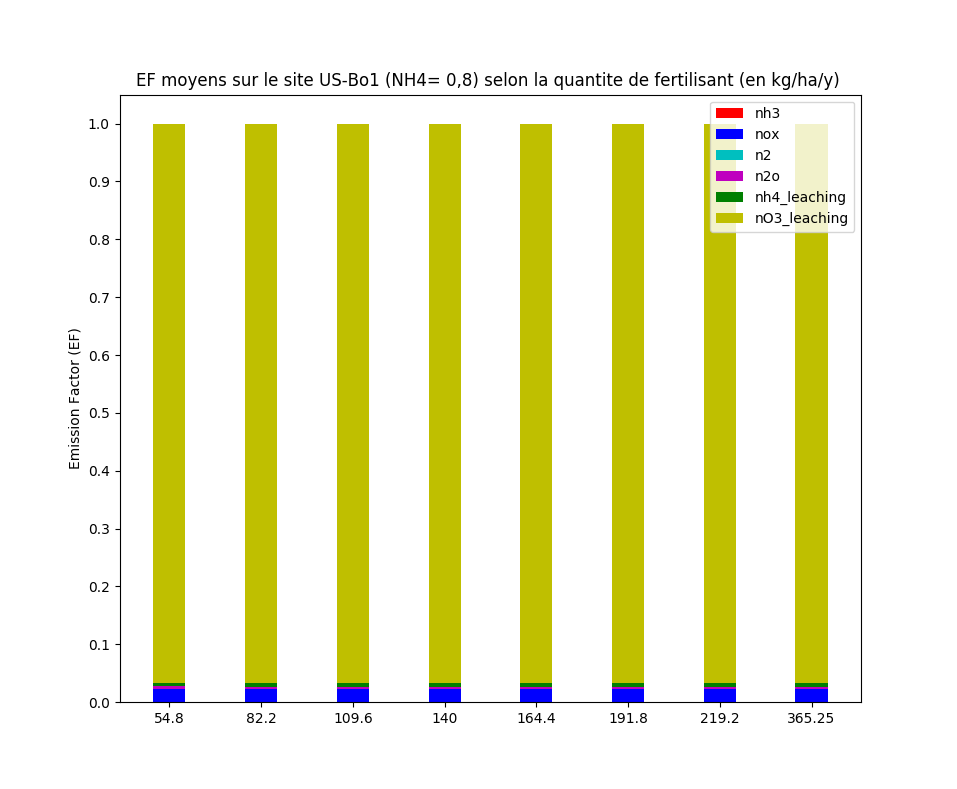
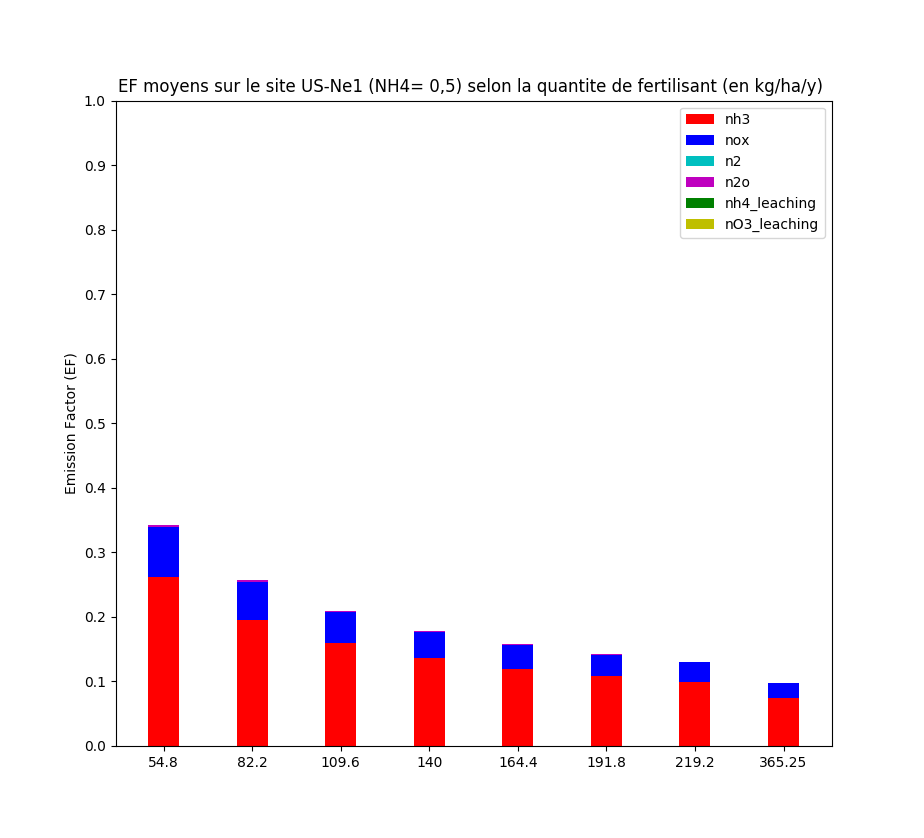
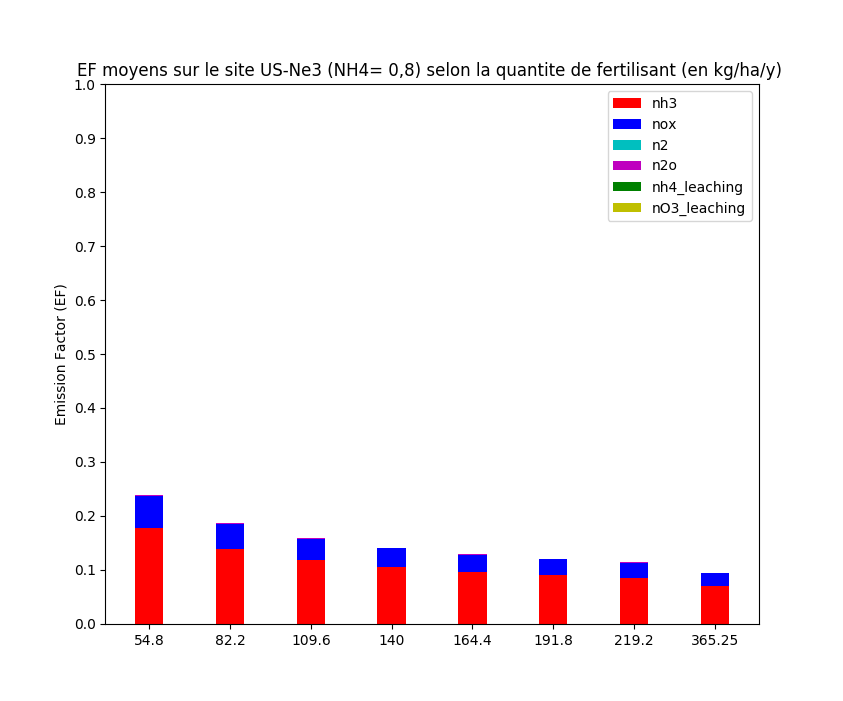
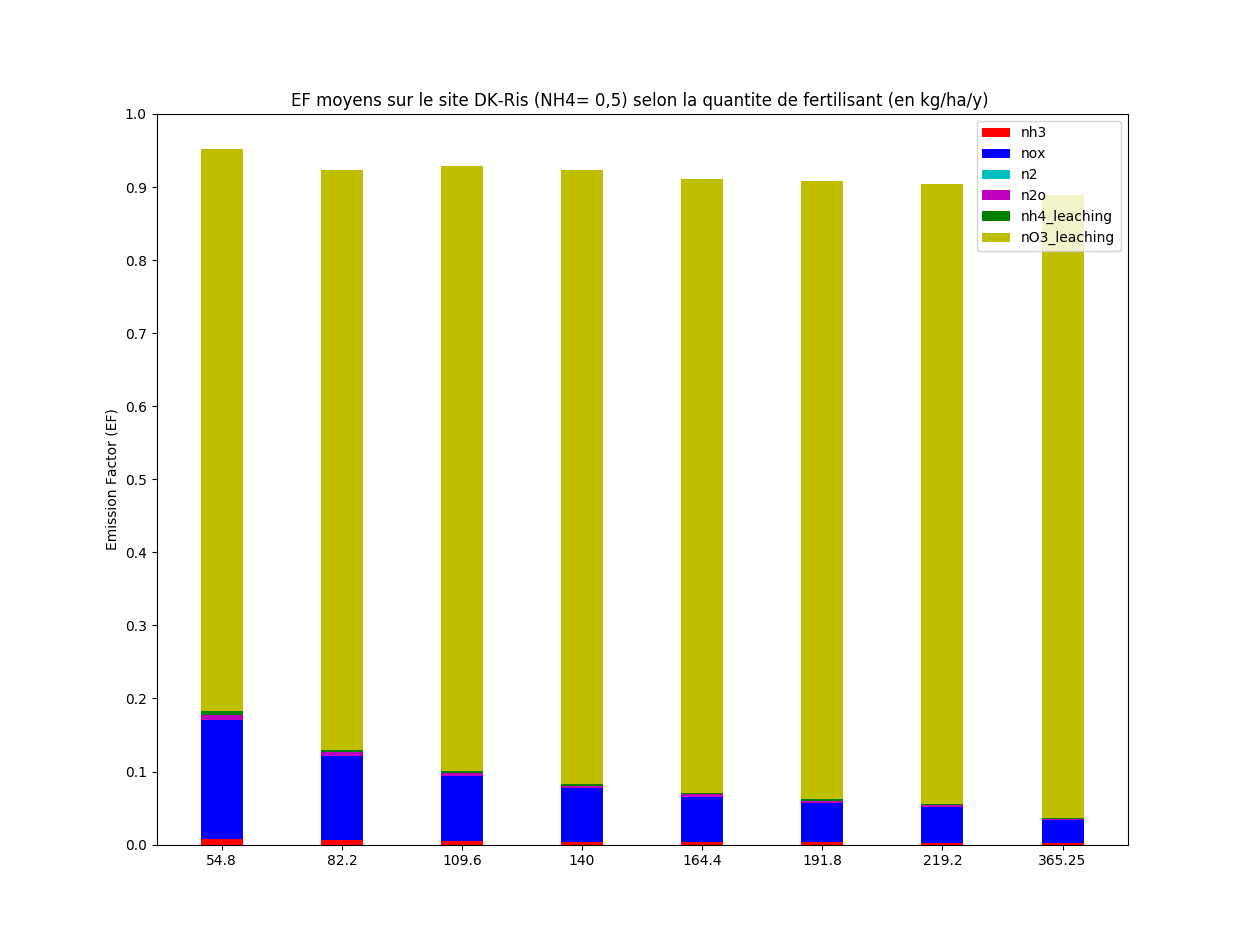
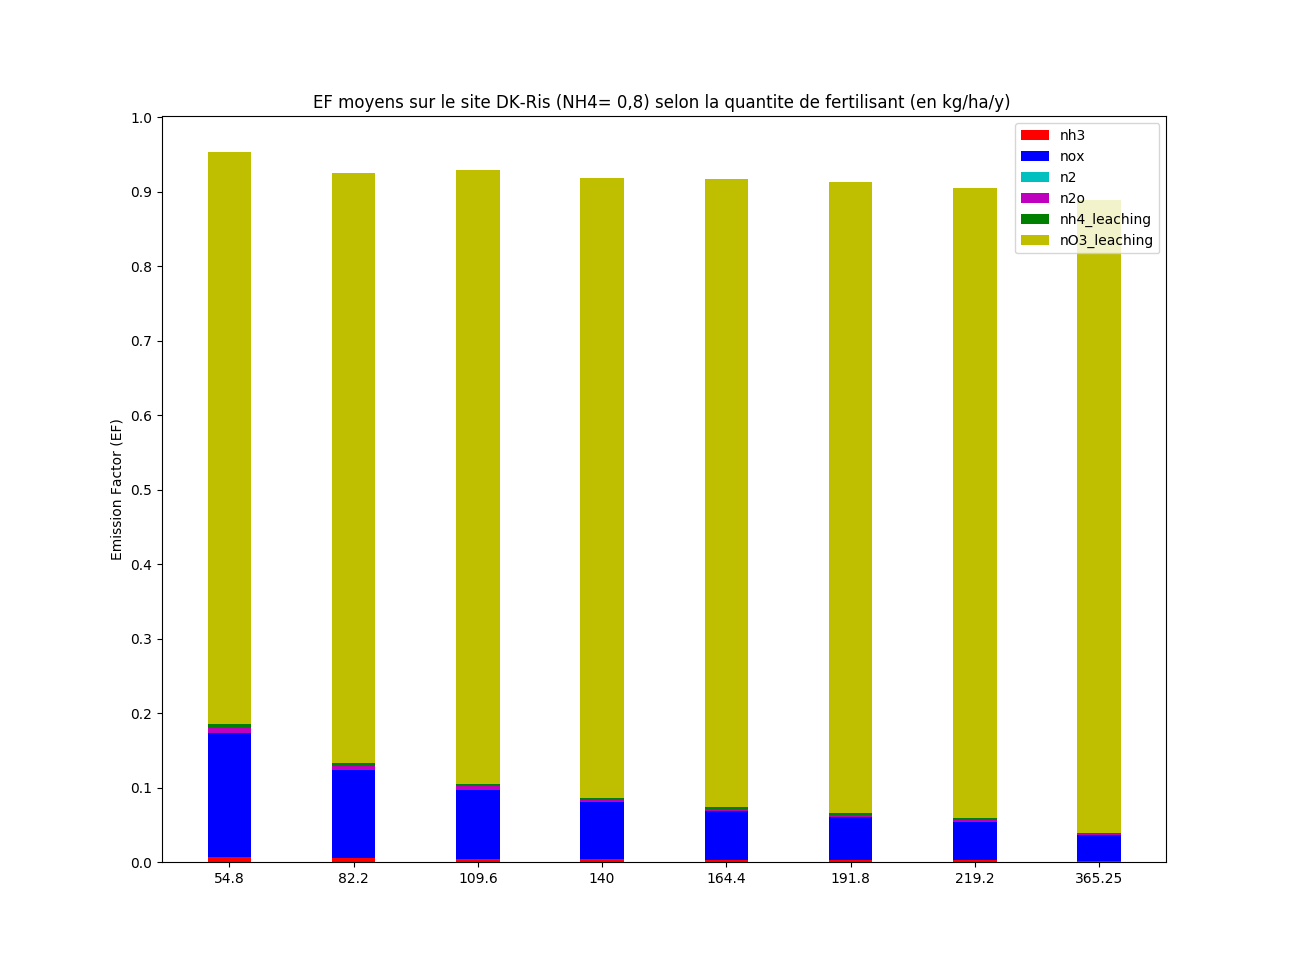
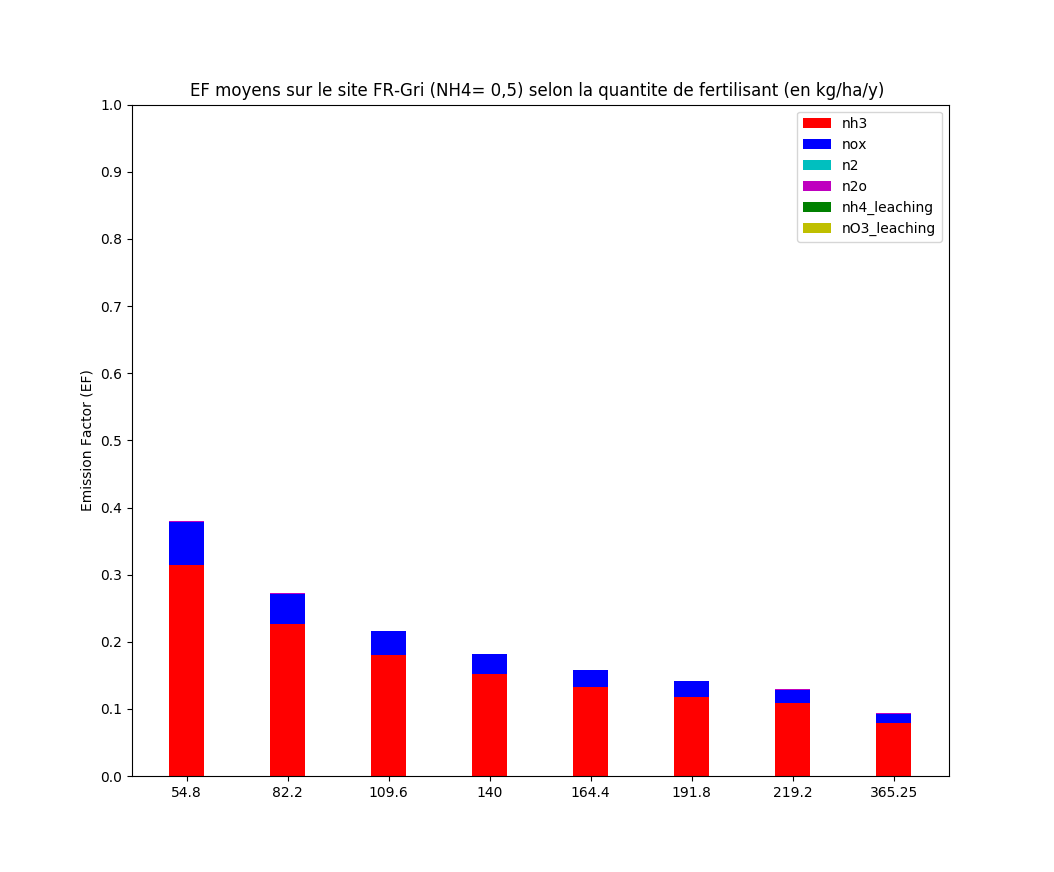
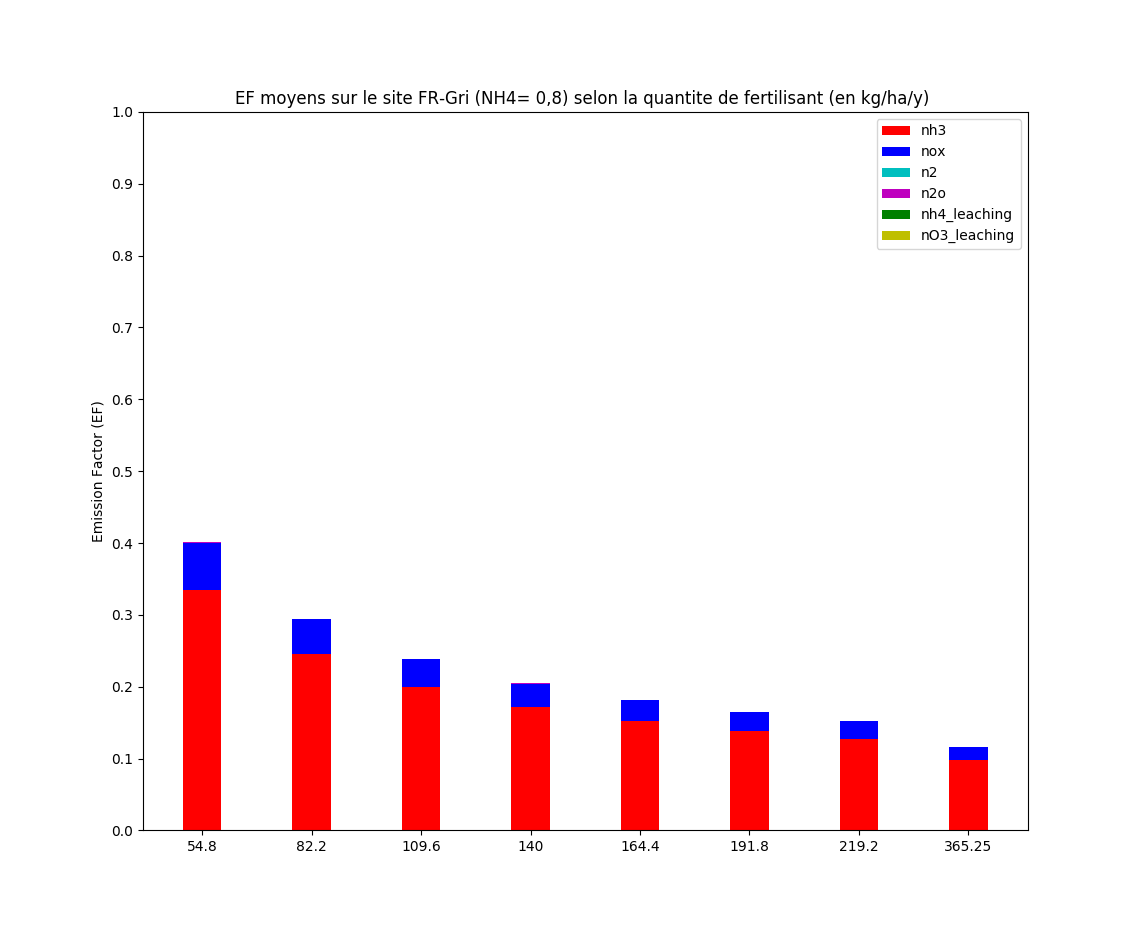
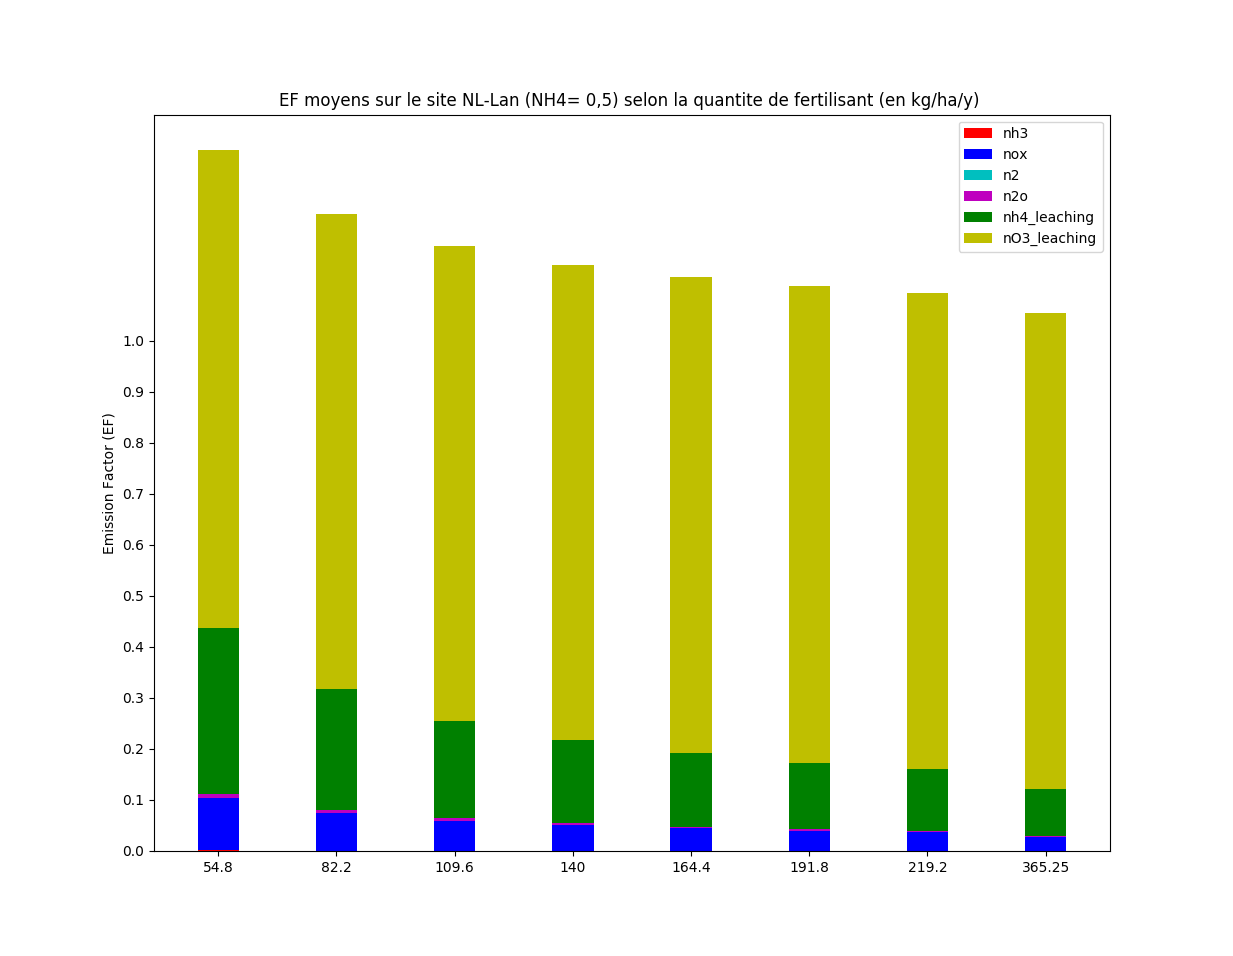
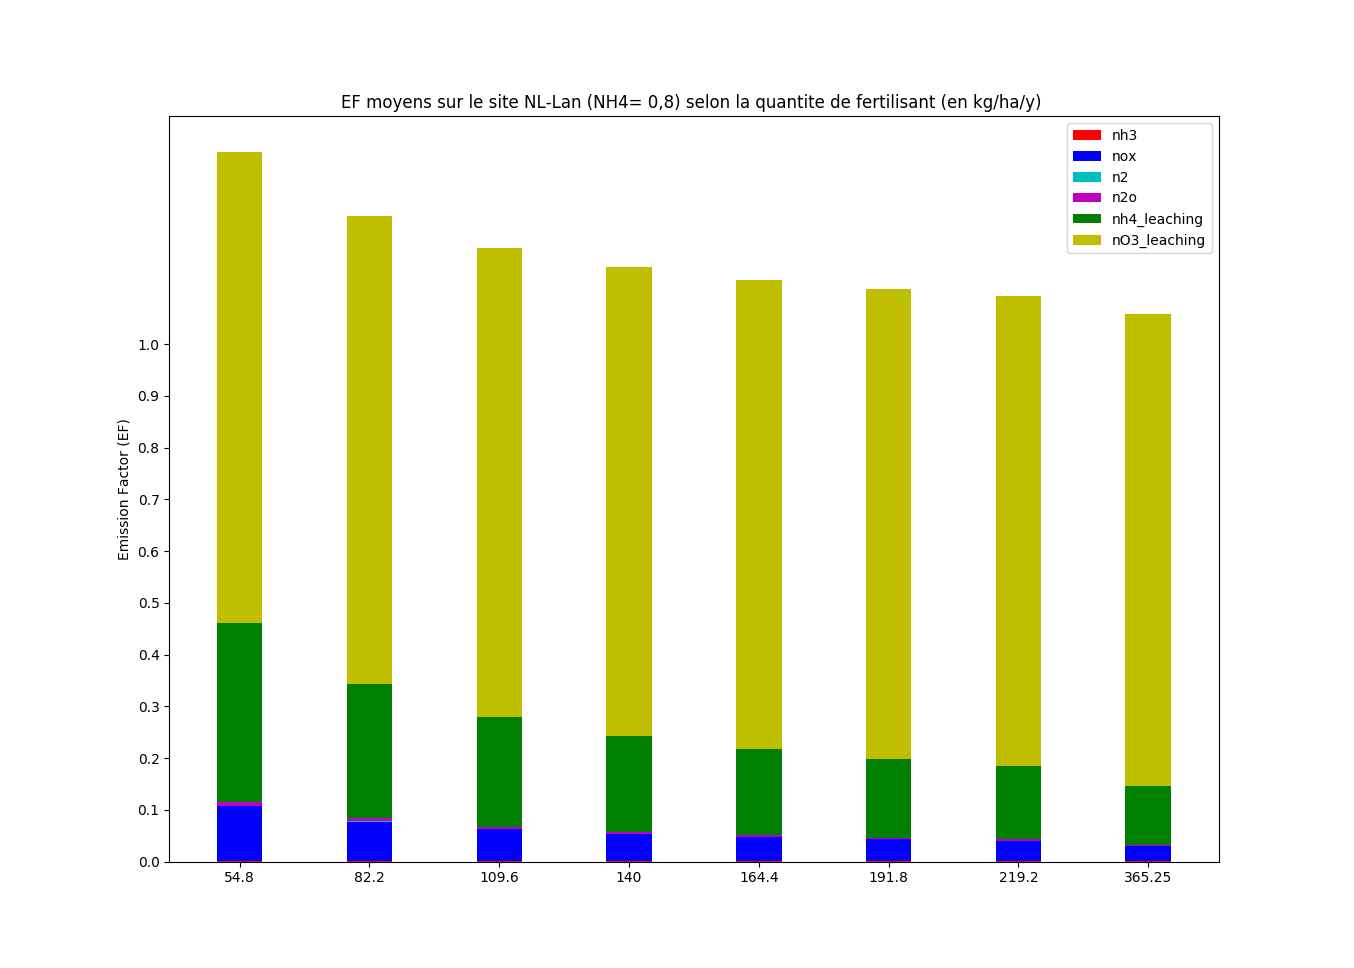
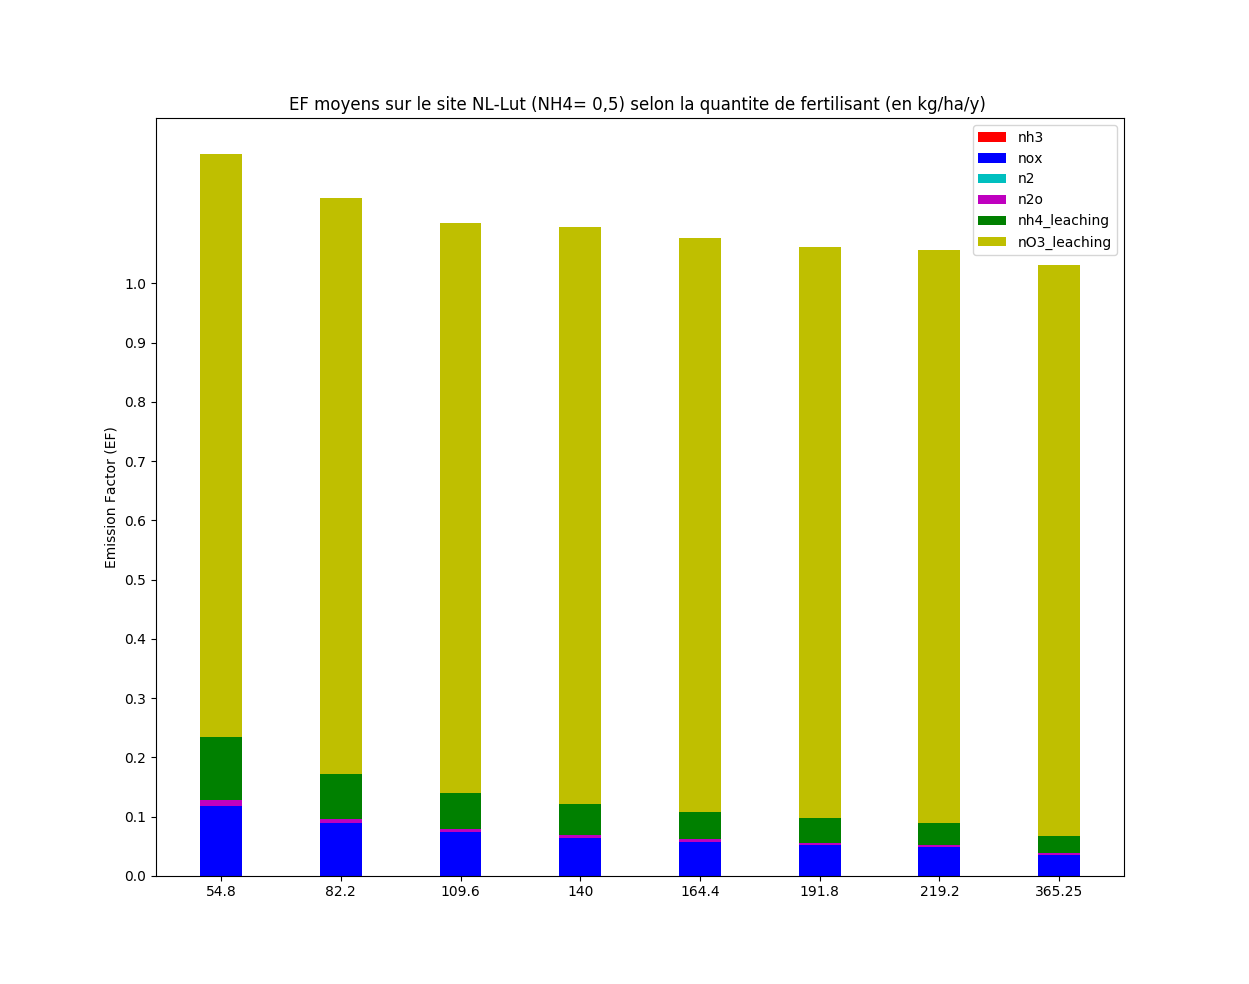
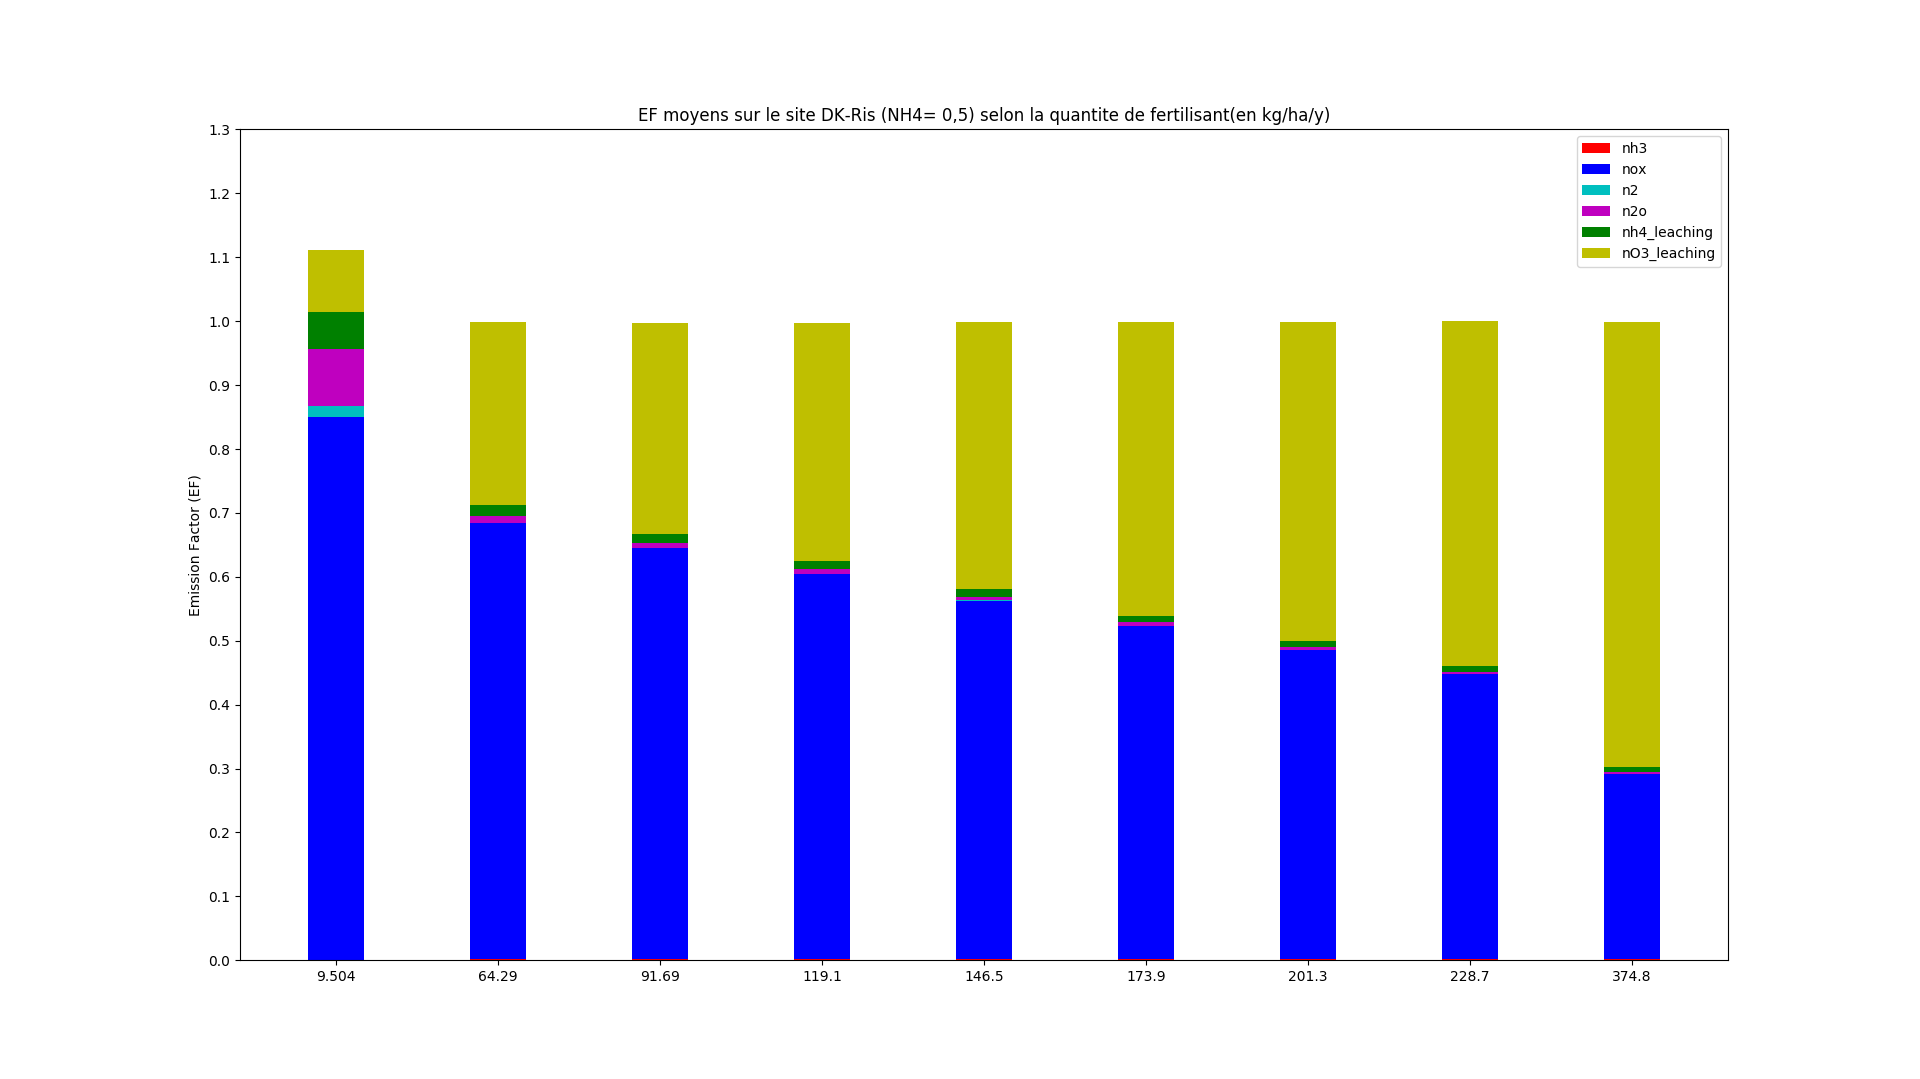
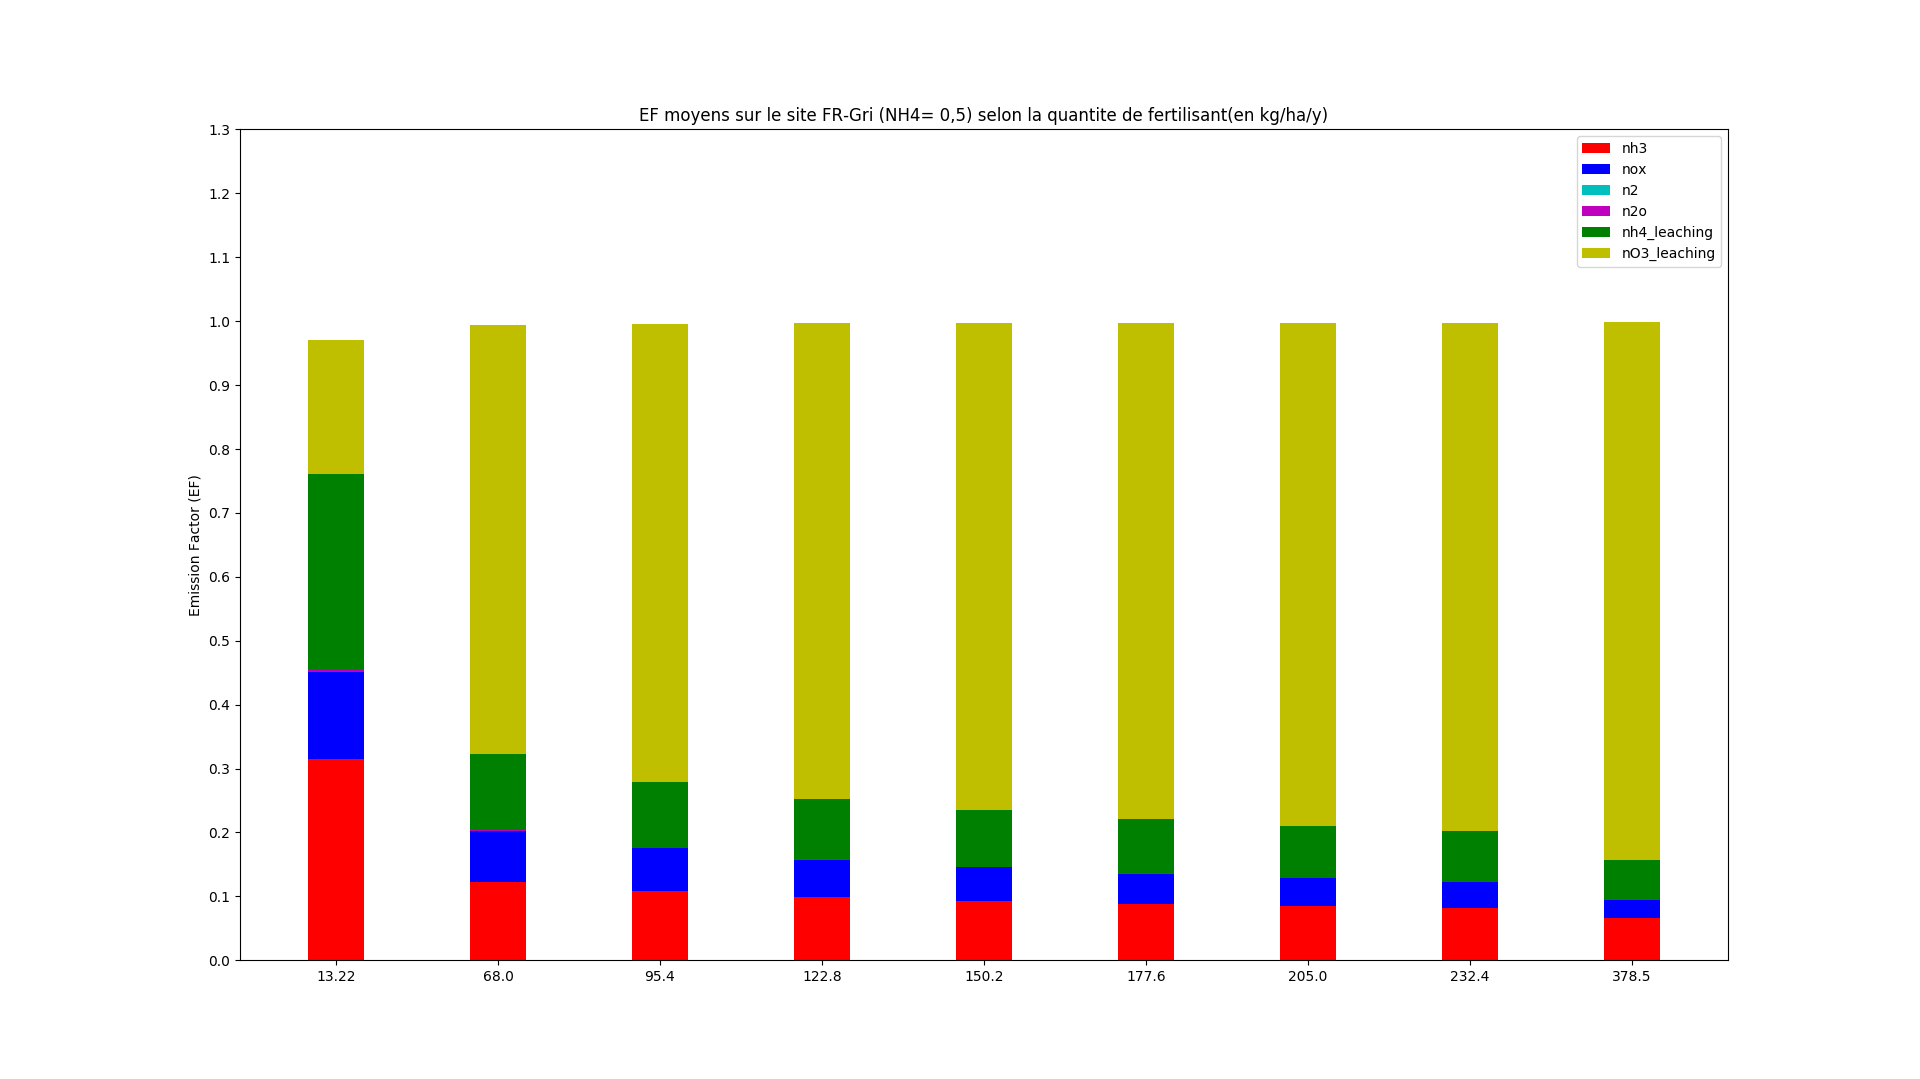
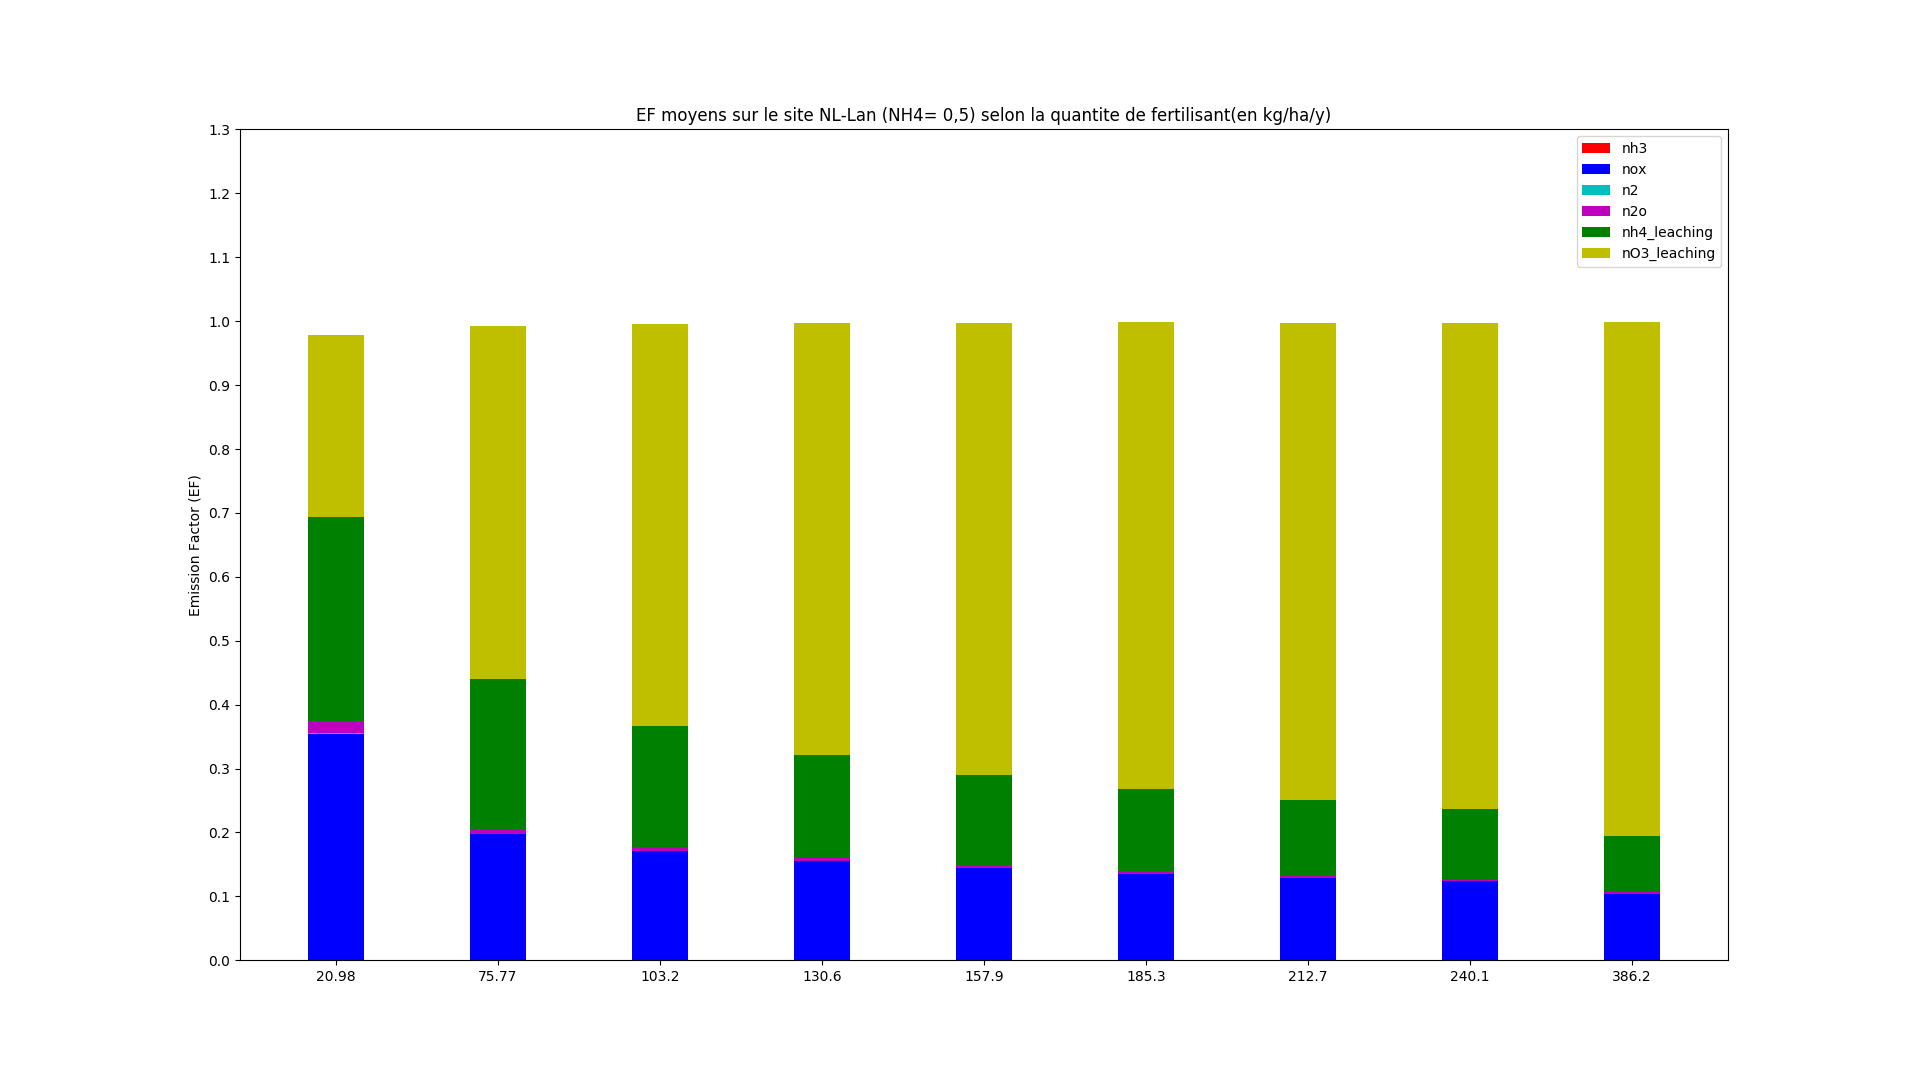
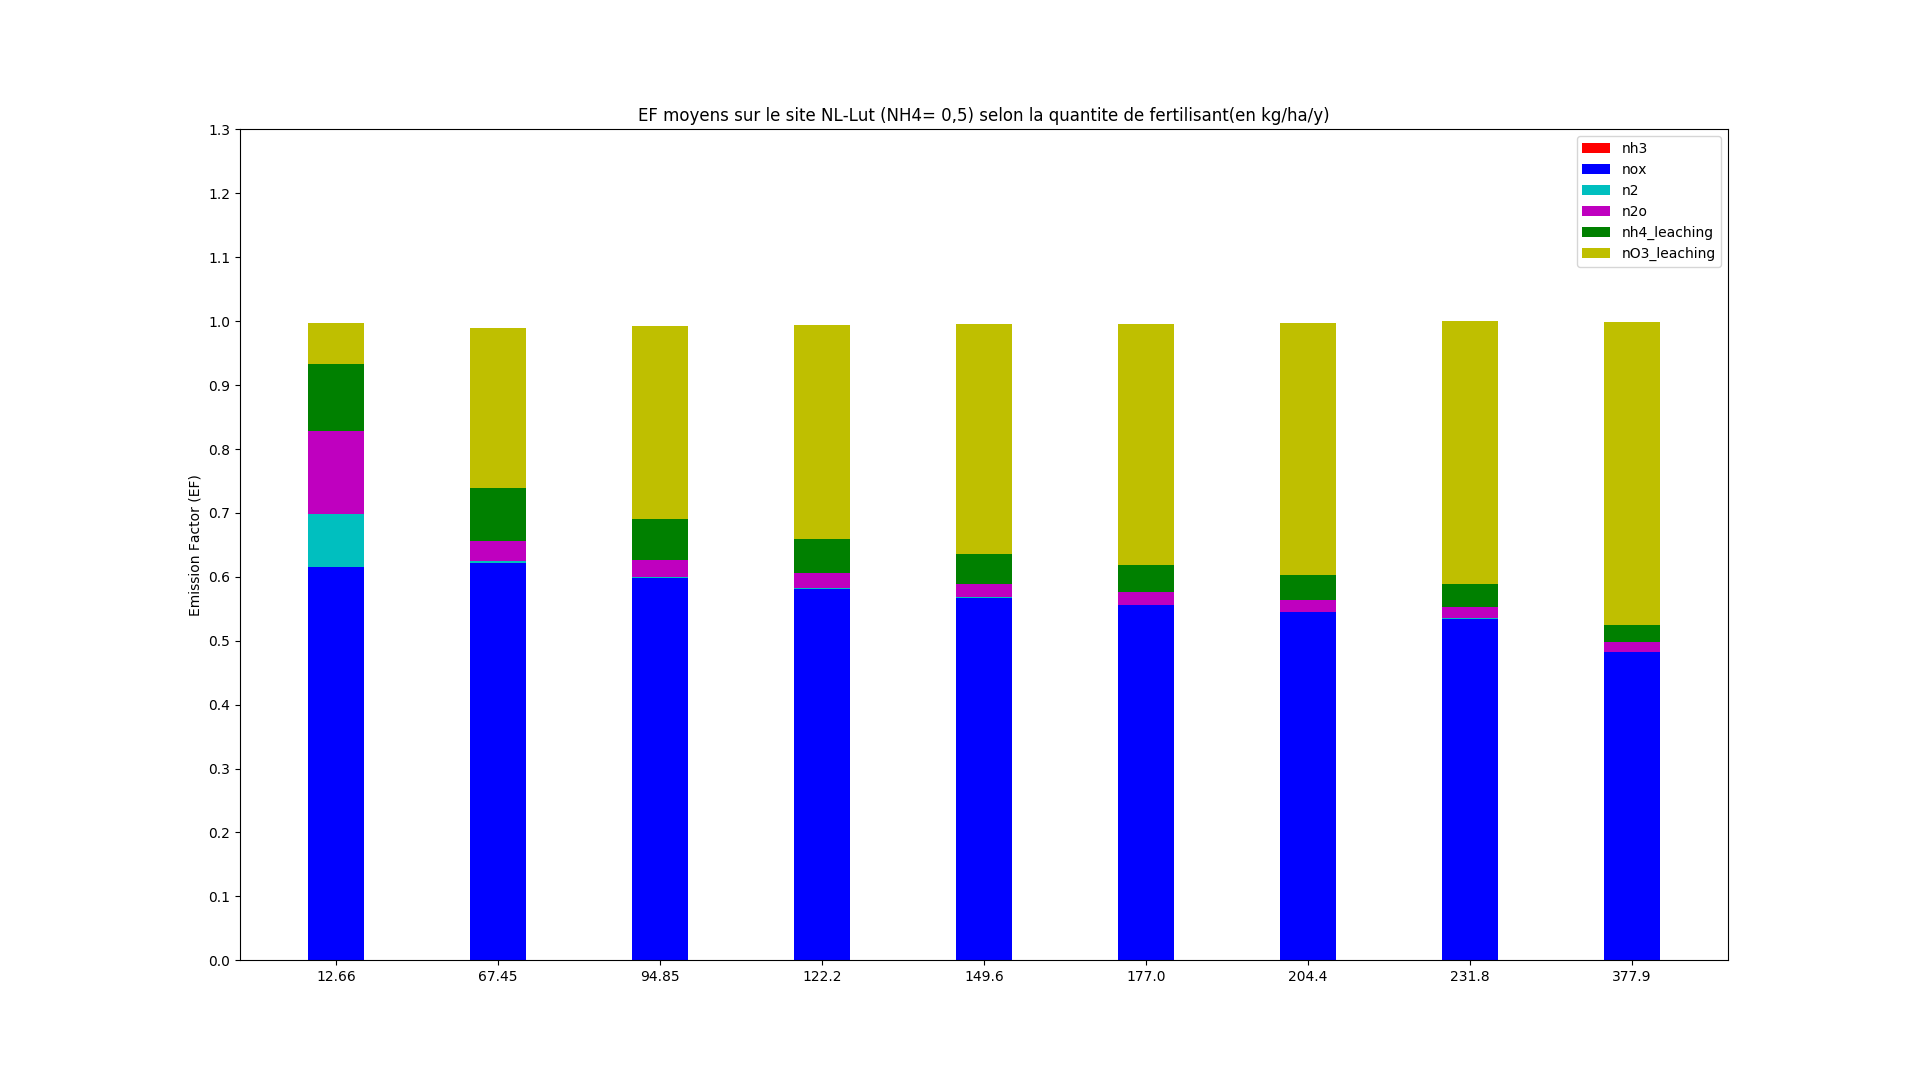
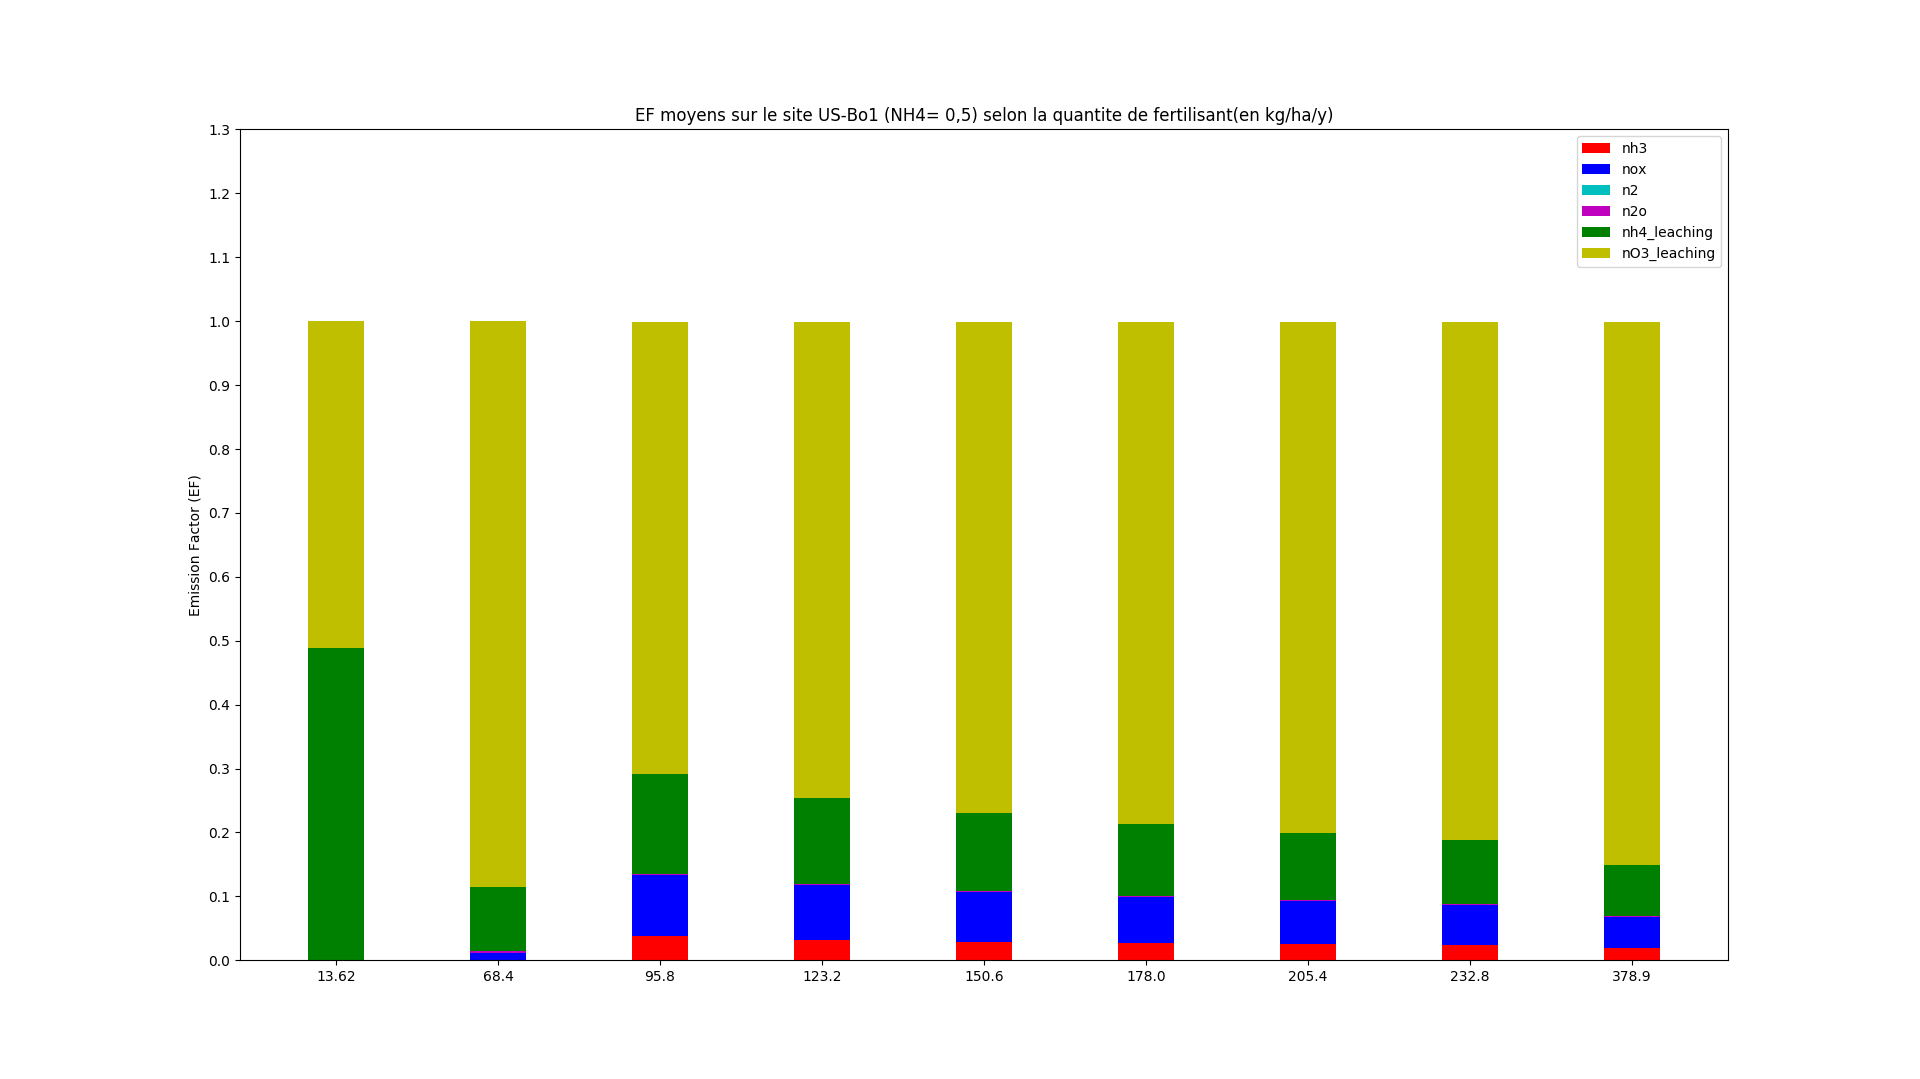
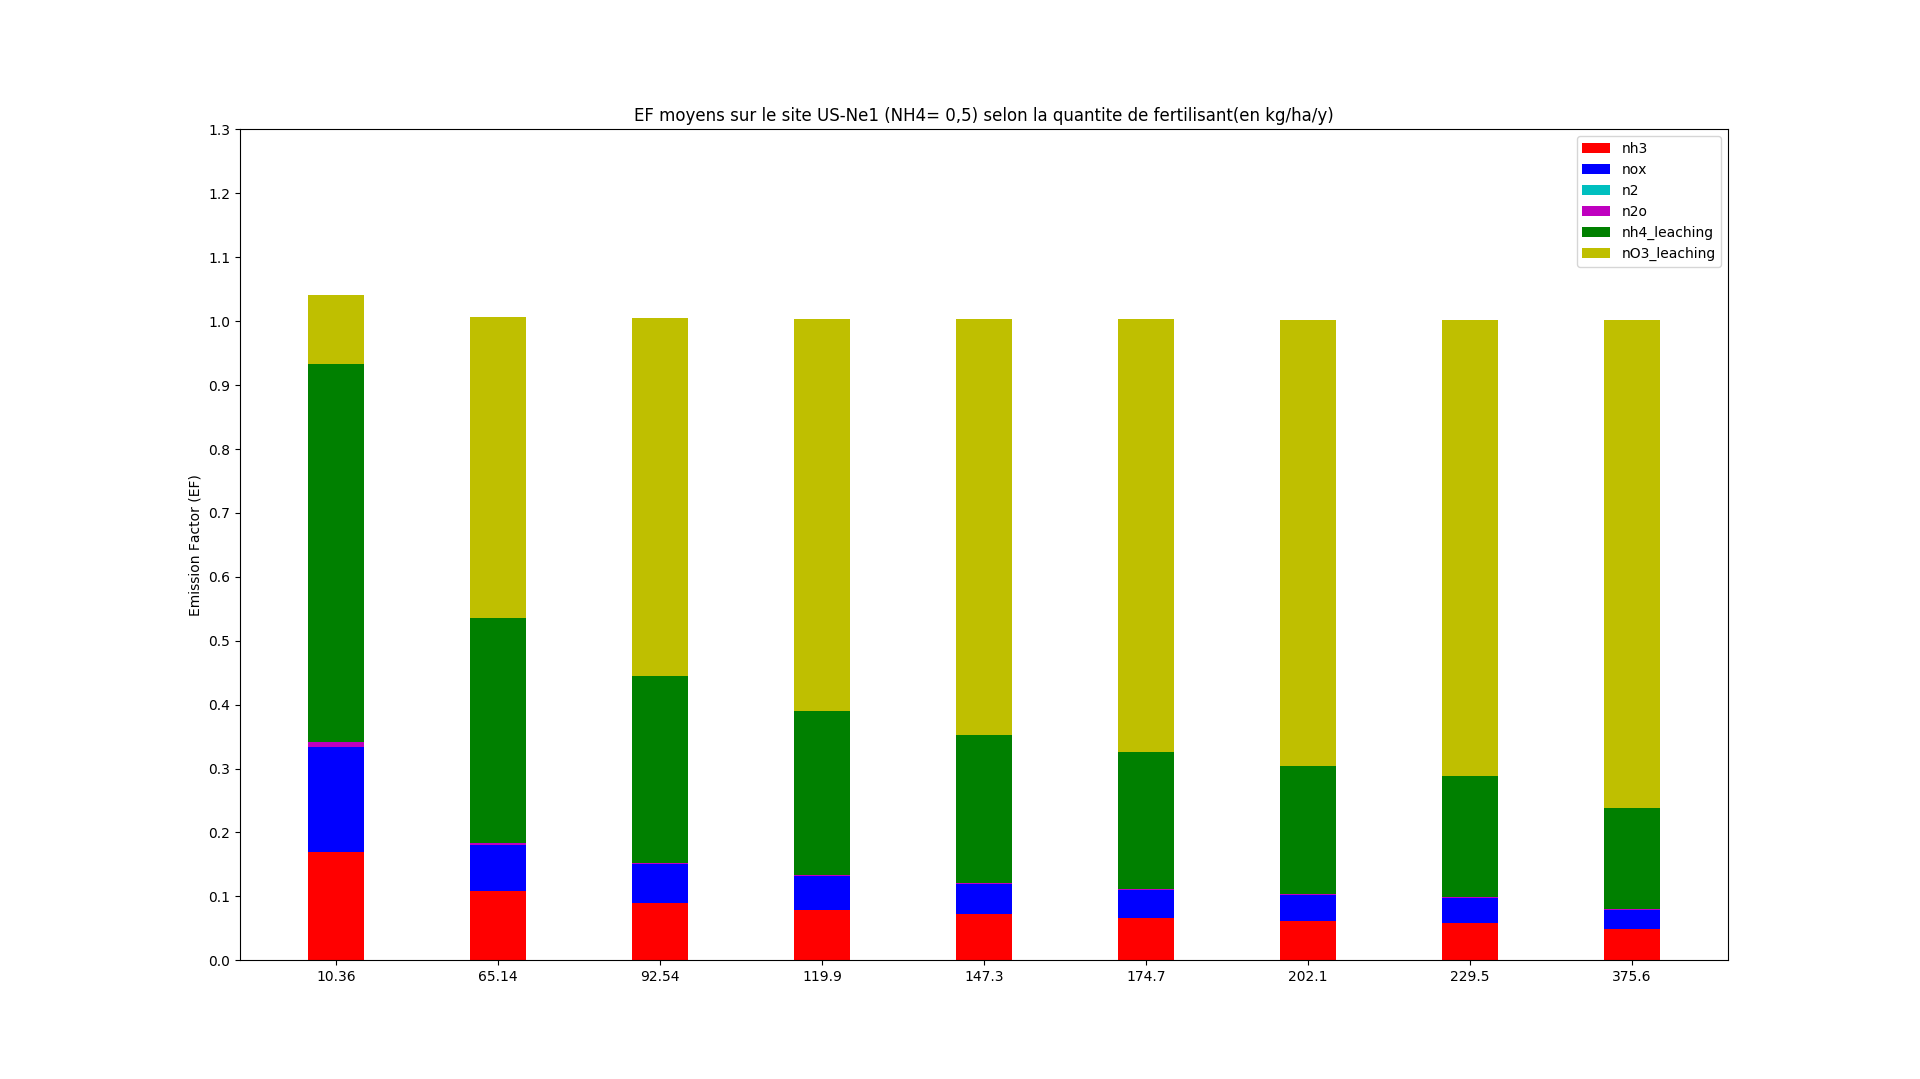
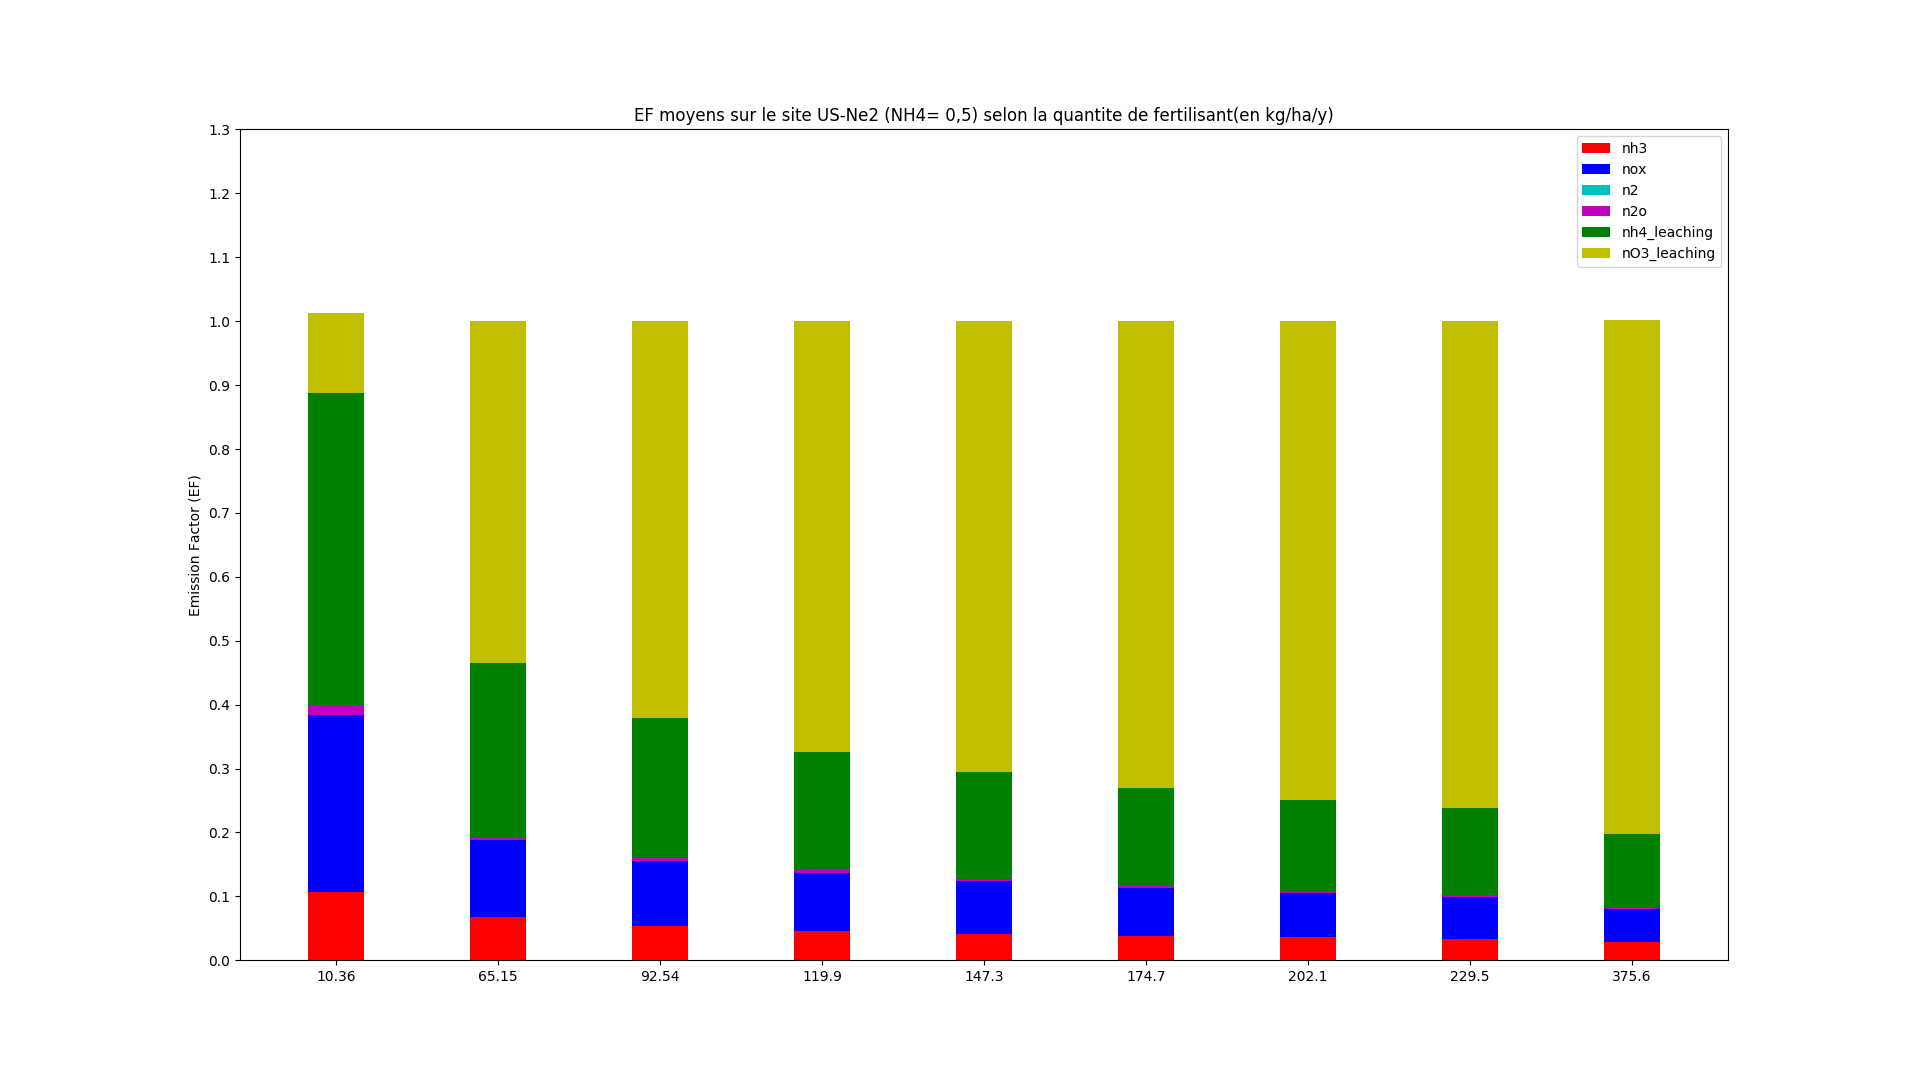
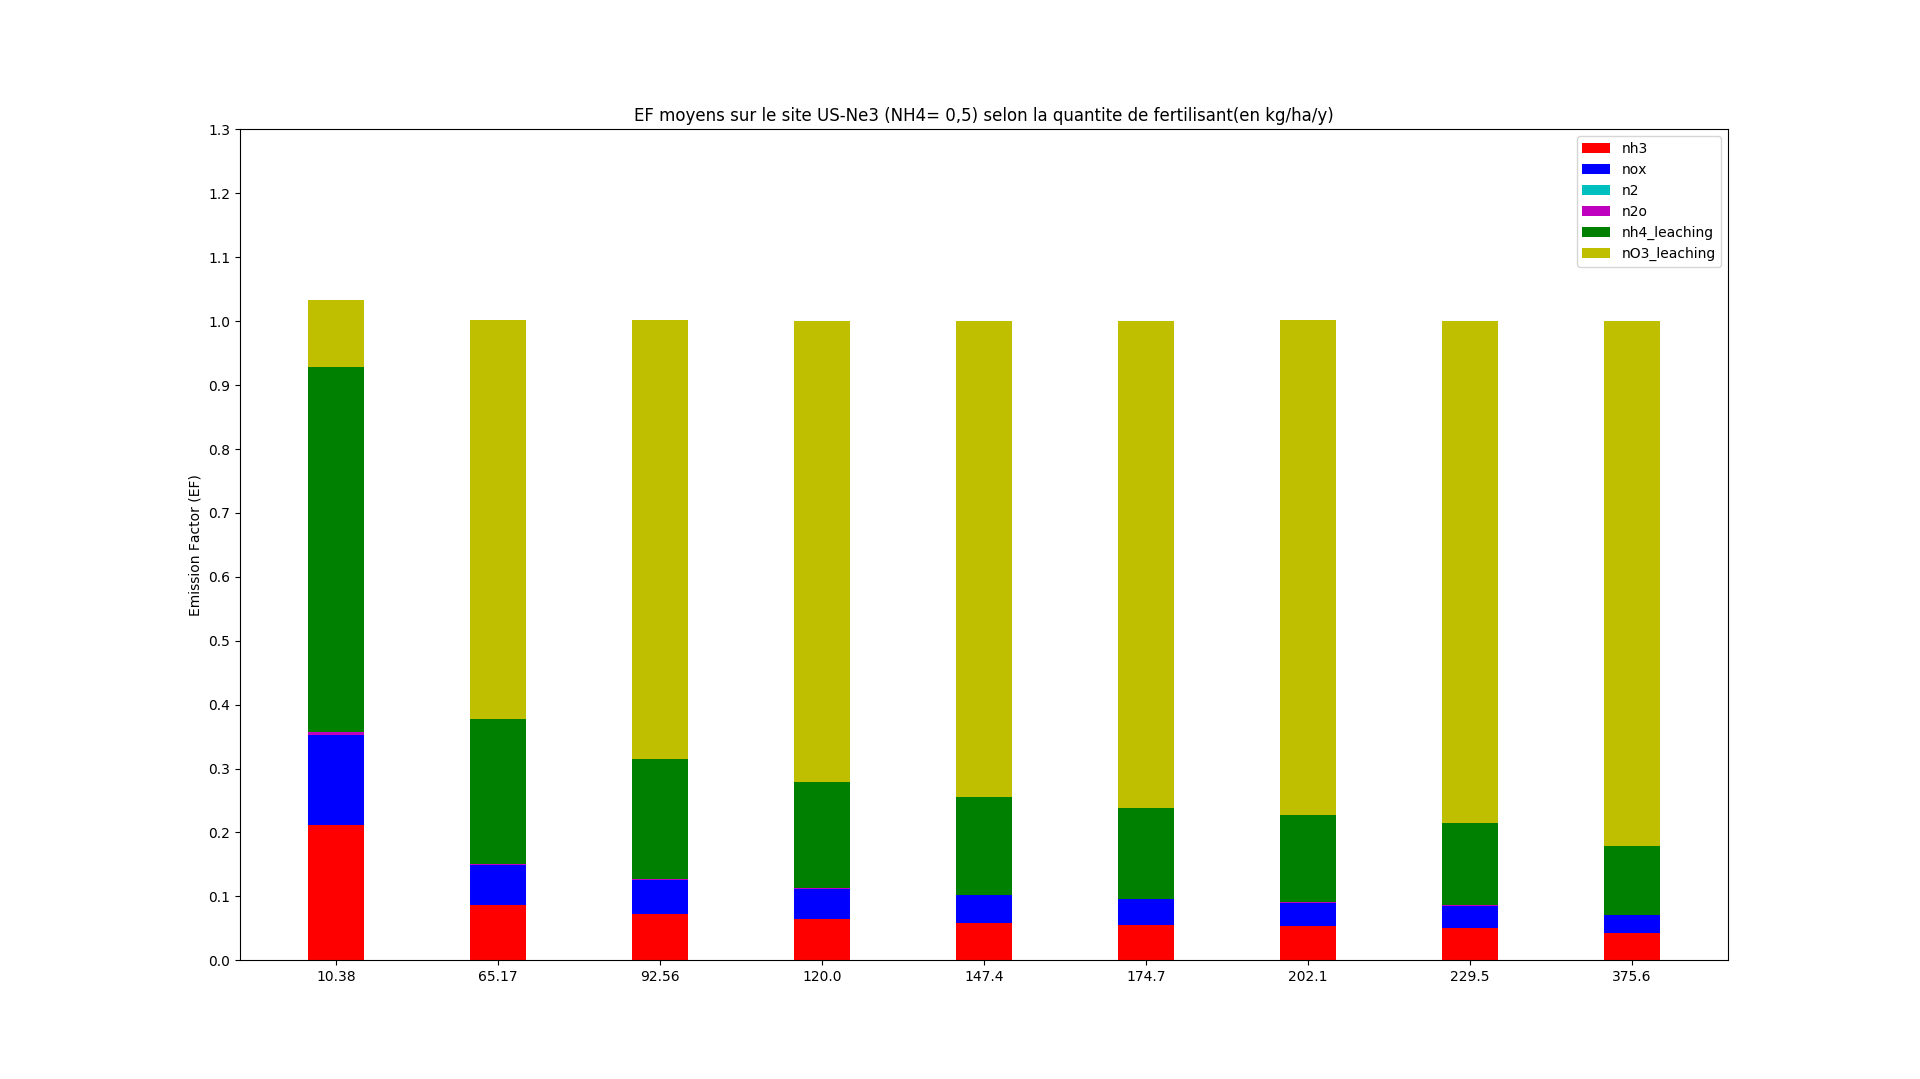
Those results seem to suit better compared to others. So, in order to compare values of the emission with data we can find in the literature we calculate the emission factors of different fluxes. Plot EF in function of nitrogen inputs (fertilizer, NHx and NOx depositions)
path : /home/orchidee03/taudoux/documents/Results/B/EFz/
python : barplot_EF.py arg1=name of the site
| DK-Ris
|
|---|
| 0.5
|
|---|
|
|---|
| FR-Gri
|
|---|
| 0.5
|
|---|
|
|---|
| NL-Lan
|
|---|
| 0.5
|
|---|
|
|---|
| NL-Lut
|
|---|
| 0.5
|
|---|
|
|---|
| US-Bo1
|
|---|
| 0.5
|
|---|
|
|---|
| US-Ne1
|
|---|
| 0.5
|
|---|
|
|---|
| US-Ne2
|
|---|
| 0.5
|
|---|
|
|---|
| US-Ne3
|
|---|
| 0.5
|
|---|
|
|---|
Globally, by comparing with the first simulation, we can see that NH3 and NOx Emission Factor decreased in favor of NO3 and NH4 leaching. Moreover, the nitrogen seems to no longer be blocked at the nitrate state making it possible to be denitrified and emitted by N2, N2O, NOx emissions or to be leached as NOx.
Brief look at the global simulation done by Palmira MESSINA
This has been done with rev 4205.
File used : /home/orchidee03/vuichard/STAGE_THOMAS/FG3low.CWRR.CNfree.4205.V2_19990101_20081231_1M_stomate_history.nc
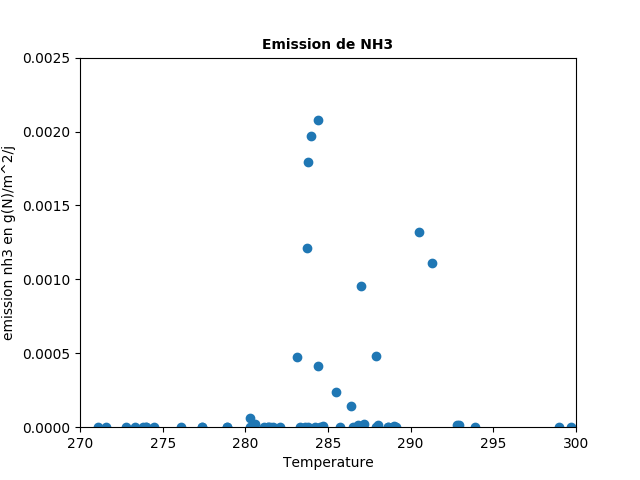
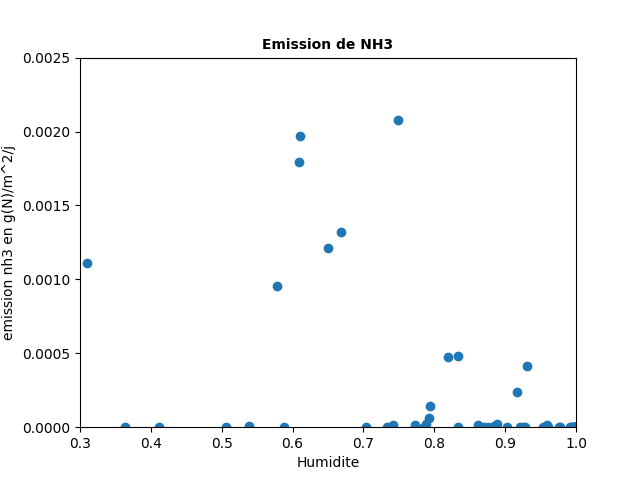
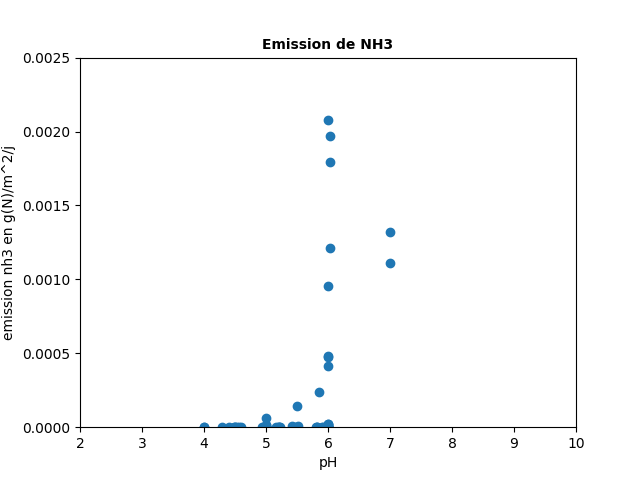
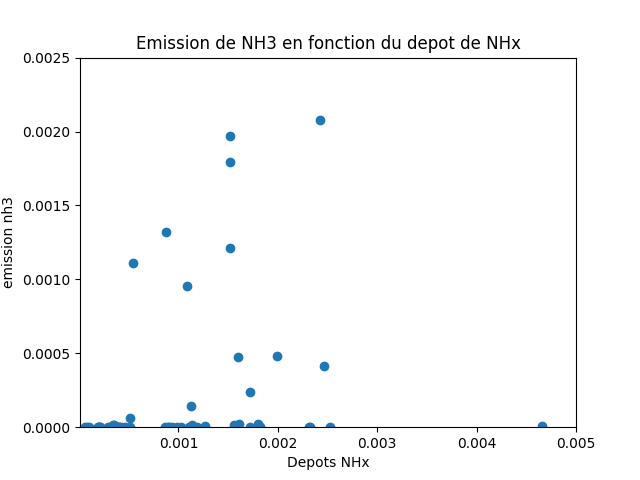
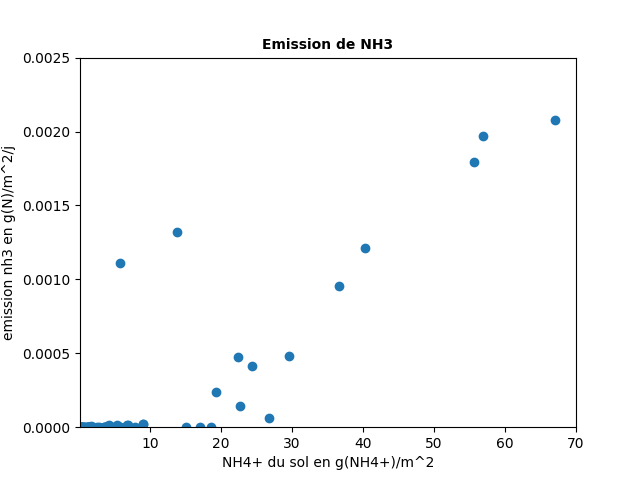
I looked how ammonia emissions respond in this global simulation in order to see if the behavior previously seen site to site is the same on a larger scale.
| Average emission of ammonia (g(NH3-N).m⁻².day⁻¹) in function of the parameter considered
|
|---|
| Temperature (K) | Humidity (-) | pH (-) | Deposition g(NHx).m-2
|
|---|
 |  |  | 
|
|---|
| SOIL NH4 g(NH4).m-2 | SOIL N2O g(N2O).m-2 | SOIL NOX g(NOx).m-2 | SOIL NO3 g(NO3).m-2
|
|---|
 |  |  | 
|
|---|
As we can see, we find the same influence of the parameters studied on ammonia emissions.


