Intermediate conclusions
-
Intermediate conclusions
- Comparison with Prather's article
- Present day simulations to compare with Prather's article
- NMHC_AER_S versus GES comparisons
- Lifetime values on different simulations
- Configurations to use for the coupling with PISCES
- Reconstruction of anthropogenic N2O emissions in pre industrial
- Emissions
- Pre industrial run
- CEDS emissions for N2O (and NH3)
- EDGAR emissions
- Exploration of inventories
Comparison with Prather's article
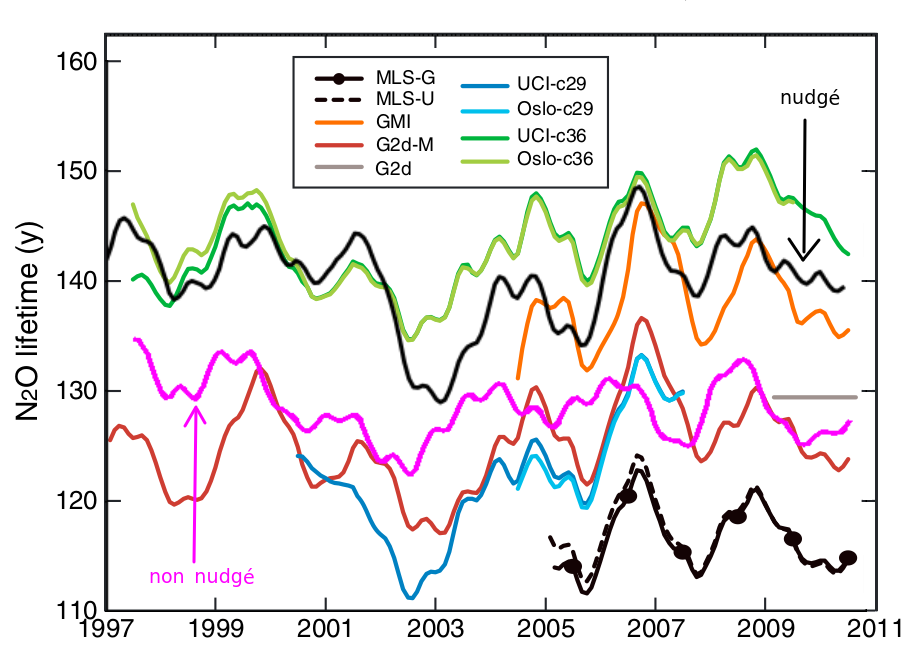
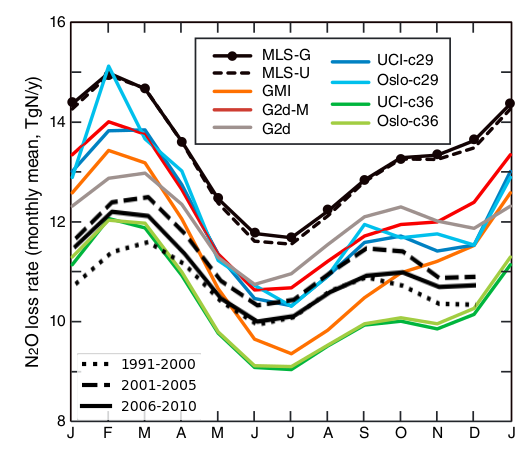
Finally, we ran a 20-year simulation to compare our results with Prather's article (see in Bibliography). Two simulations were run: one is nudged, the other not. The two figures below correspond to the figure 5 and 4 in the article. We have added our own results on them.


Present day simulations to compare with Prather's article
- Run from 1990 to 2015 (slight spin-up + period of comparison)
- Started in 1990 with our emissions, oxydants from Yann, no nudge and no ozone guide.
- after 10 years of simulation: lifetime at 150 years, burden of 1530 TgN and total loss of 12TgN/y.
Multiple tests done from 2000 (in order to be as close as possible to Prather's results)
| Name | continued | restart.prather.2000 | climoz.nudge | aero.forc.cloz.nudg | lessEmi | physiqNPv6.2 | actuel |
| Copy from | prather.comparison | prather.comparison | restart | climoz | aerosol | aerosol | aerosol |
| What have changed? | nothing | ok_guide(n=>y) | read_climoz(n=>y) | flag_aerosol + ok_aie ok_ade | in code: put 0.8*tot_emi | physiq (6.1.3=>6.2) | ConfigType? (annuel=> actuel) |
| lifetime++ | 138 yr | 108 yr | 101 yr | 100 yr | 100 yr | 100 yr | 101 yr |
| burden++ | 1525 TgN | 1525 TgN | 1523 TgN | 1523 TgN | 1523 TgN | 1523 TgN | 1523 TgN |
| total loss++ | 11 TgN/y | 14 TgN/y | 15 TgN/y | 15 TgN/y | 15 TgN/y | 15 TgN/y | 15 TgN/y |
++ Those values are calculated for year 2000.
The high value of lifetime comes from an high value of total loss, especially loss by photolysis in the stratosphere. This can be due to the amount and/or transport of ozone in the stratosphere. Moreover, we have seen a high concentration of N2O at 10hPa in the high latitudes (North), occurring in May/June? or even August.
The nudging seems to affect too much the transportation. However, other simulations with nudging (CovidRef?, CM5A2xxx, Rescaled-79-washout,..) don't have this problem. All are NMHC_AER_S configurations, and not GES (as tested above).
NMHC_AER_S versus GES comparisons
- As the problem with a nudged simulation has occurred some problem with lifetime, we have planned to compare NMHC_AER_S and GES configurations.
- We started with Yann's run (Rescaled-79-washout), run it with my code and "transform" it into GES configuration.
| Name | exactYannNMHC | exactYannGES | copy.exactYannNMHC | exactYannGES.1M |
| Copy from | Rescaled-79-washout (Yann) | exactYannNMHC | exactYannNMHC | exactYannGES |
| What have been | N files+variables and flx_BVOC+Nsoil for ORCHIDEE3 | configuration GES (oxydants+aerosols+taka/casa/andres) | PeriodLength?(1Y) + output files | PeriodLength?(1M) |
| changed ? | restart only with ATM | aerosol_couple(=>n) + periodLength + output_freq(=>1mo) | +phtrate/invariant -aero_chem/chem/forcage/aero/dep | |
| PeriodLength? | 1M | 1Y | 1Y | 1M |
| lifetime | 170 yr++ | 113 yr | 114 yr | 164 yr |
| accumulation ? | no | yes | yes | no |
++ Beware : this calculation has been made using phtrate of copy.exactYannNMHC because phtrate wasn't in output files + we have used monthly mean data and not daily data.
Remark: An additional simulation, named "copy.exactYannGES" has been tested. What has been changed ? A comment has been added in INCA_SRC/chem_hook in order not to enter in BOUNDSPC. Results were equivalent to exactYannGES.
Lifetime values on different simulations
| - | Run of Yann | preindus.off | 39L(L39.v03) | 39L (piscideeL) | preindus.c79 | OxydantsYann? (1850) | OxydantsYann? (1857) | oxYann.newpht (1850) |
| lifetime | 191,86 | 160,59 | 129,05 | 129,33 | 159,28 | 156,86 | 146,33 | 137,858 |
| burden | 1570,97 | 1343,02 | 1364,54 | 1368,25 | 1343,08 | 1342,9 | 1359,17 | 1335,6 |
| loss tot | 8,18 | 8,36 | 10,58 | 10,57 | 8,43 | 8,56 | 9,28 | 9,68 |
| loss o1d | 1,017 | 1,163 | 1,136 | 1,13 | 1,00 | 0,95 | 1,01 | 1,24 |
| loss pho | 7,17 | 7,2 | 9,43 | 9,44 | 7,43 | 7,61 | 8,27 | 8,45 |
| photorate | 7,02E-09 | 6,99E-09 | 6,65E-09 | 6,64E-09 | 7,03E-09 | 7,88E-09 | 7,90E-03 | 7,85E-09 |
| o1d | 3,25E-10 | 5,63E-11 | 2,80E-10 | 3,25E-10 | 3,25E-10 | 3,78E-10 |
- Run of Yann: The one use for the restart Rescaled-79-washout,
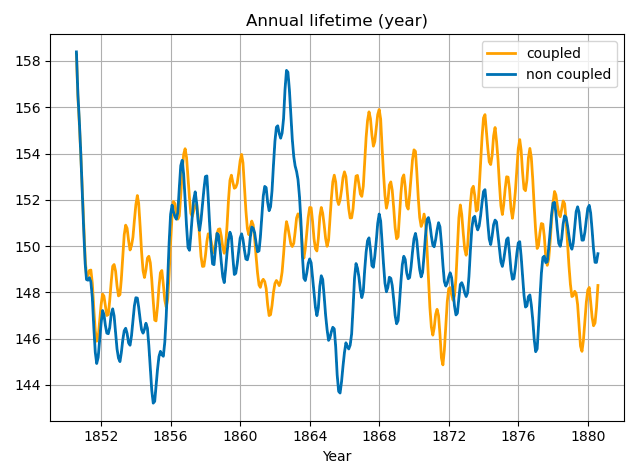
- preindus.off and preindus.c79: coupled and non coupled version for preindustrial period,
- 39L (L39.v03 and piscideeL): reference run in 39 levels,
- OxydantsYann?: same run as preindus.off but with oxydant of Yann's run,
- oxYann.newpht: same run as preindus.off but with new phototable and photorate + oxydants of Yann.
Configurations to use for the coupling with PISCES
We decide to go step by step:
- Use IPSLCM6.3_work with the original files/config. (maybe at this stage, update ORCHIDEE 3)
- Test INCA version with GES configuration,
- Implement in INCA the development I've made,
- Test coupling INCA + DMS Thibaut,
- Develop the transfert of N2O fluxes between PISCES and INCA.
Once everything above is done, we could move to IPSLCM7 with NEMO 4 and new ORCHIDEE (3 or 4?).
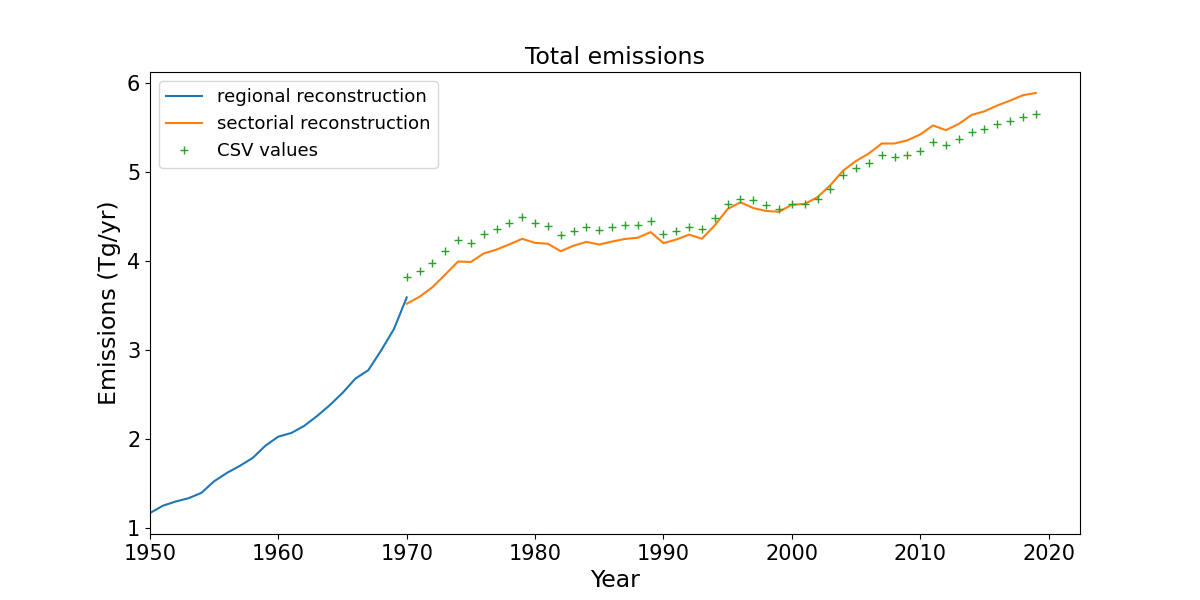
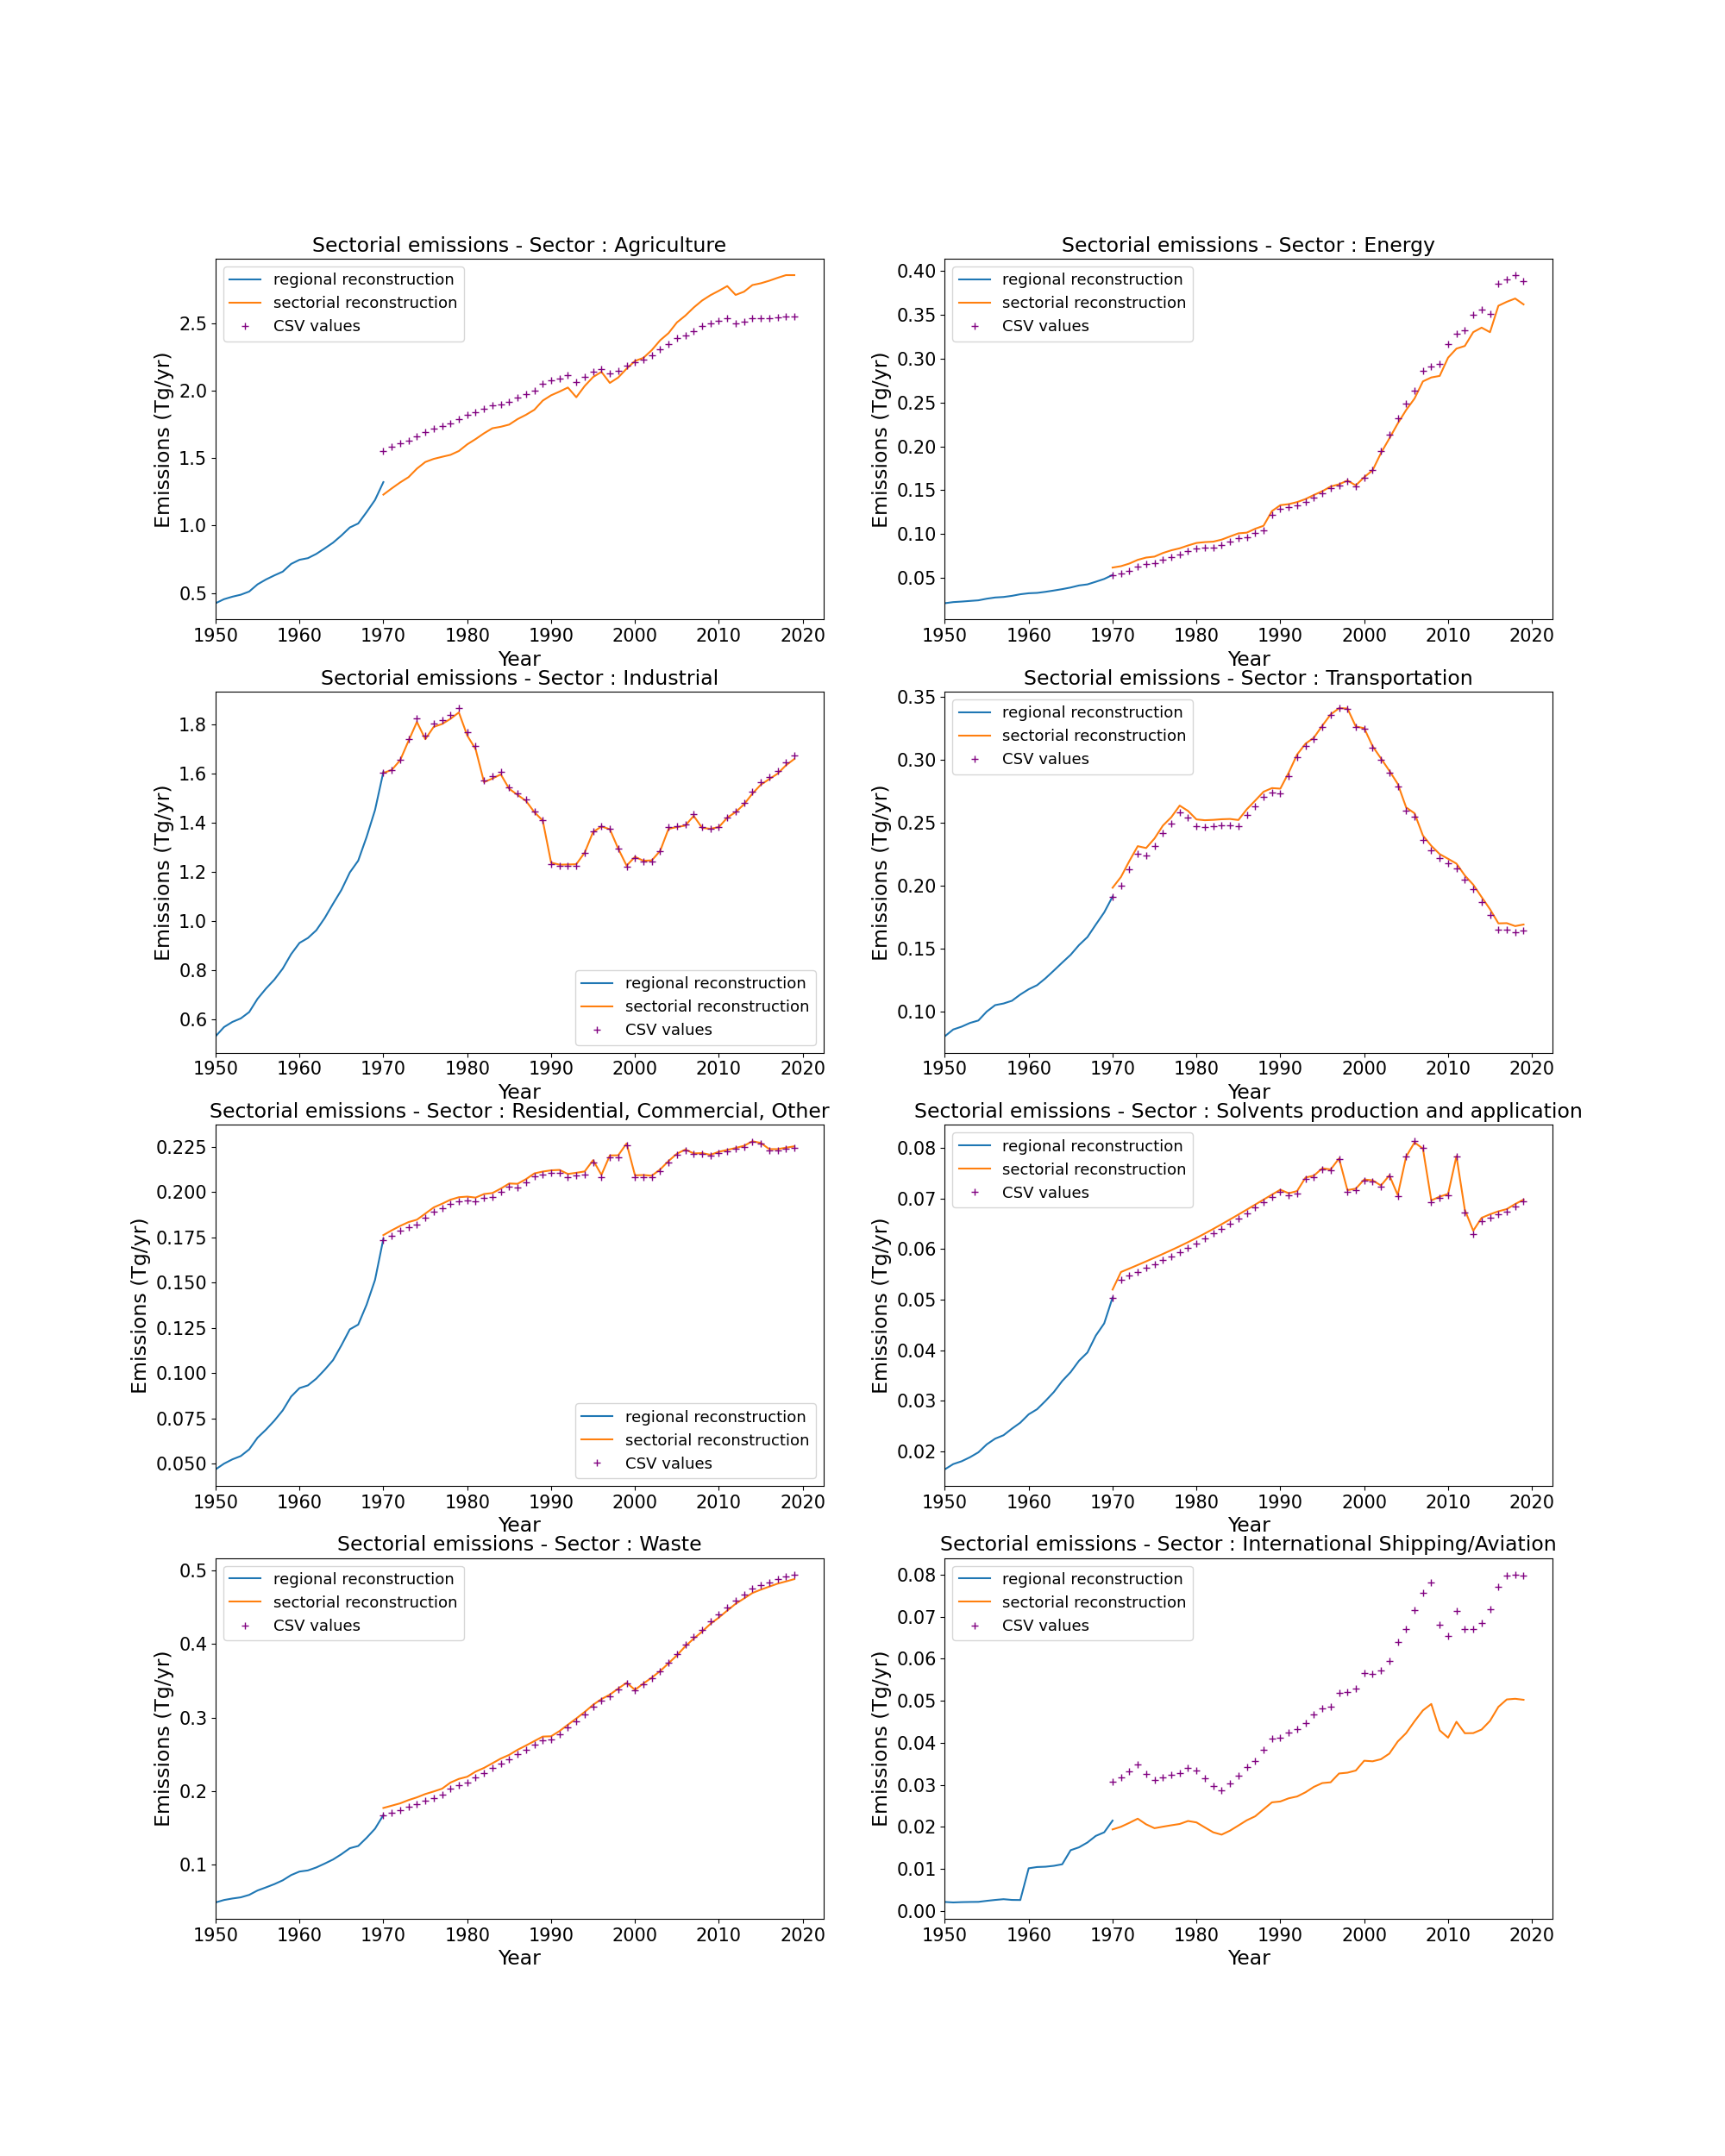
Reconstruction of anthropogenic N2O emissions in pre industrial
- from 1850 to 1969: proxy with NMVOC and linear regression, only total emissions per region (no information about sectors);
- from 1850 to 1969: reconstruction per region using 1970's emissions as reference;
- from 1970 to 1999 (extended to 2019): reconstruction per region and sector, using 2000's emissions as reference. (+modification of agriculture sector by factor 0.40 in order to drop soil emissions.)


Remark: A slight difference exists between data from csv file and data in netCDF file; it can be shown with the comparison of 'Notebooks/N2O_sector_country_via_ncfile_maks.csv' (data from netCDF file) and 'Notebooks/total_em_CEDS_sector_country_1970_2019_repartEDGAR2.csv'. This might be due to the maks used...
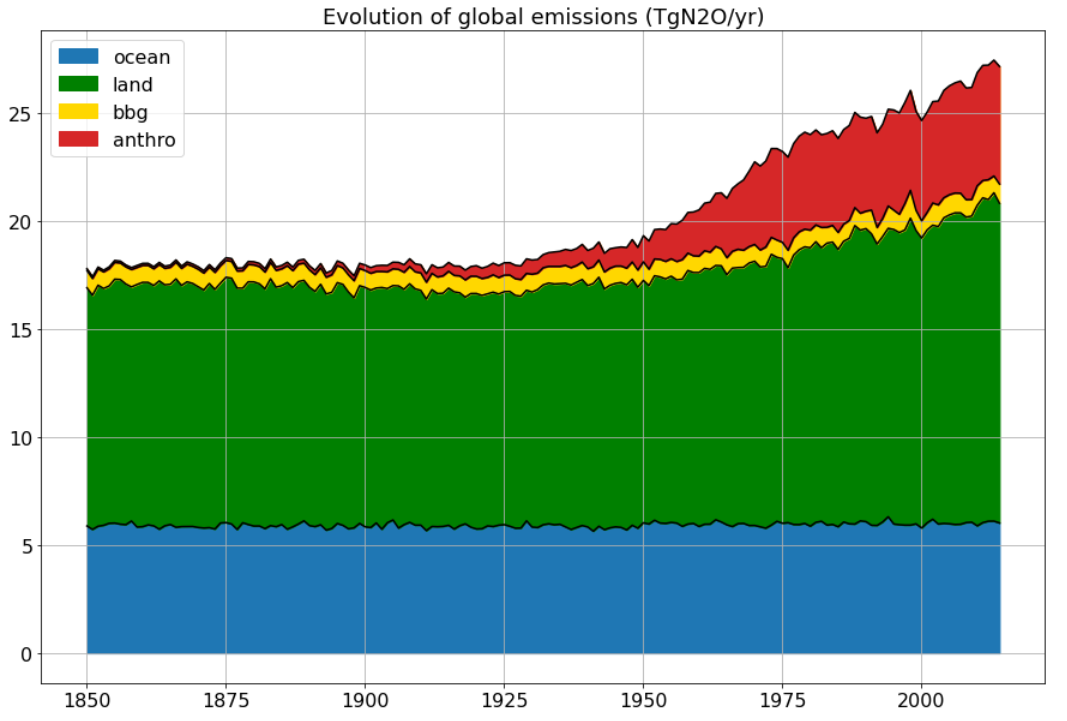
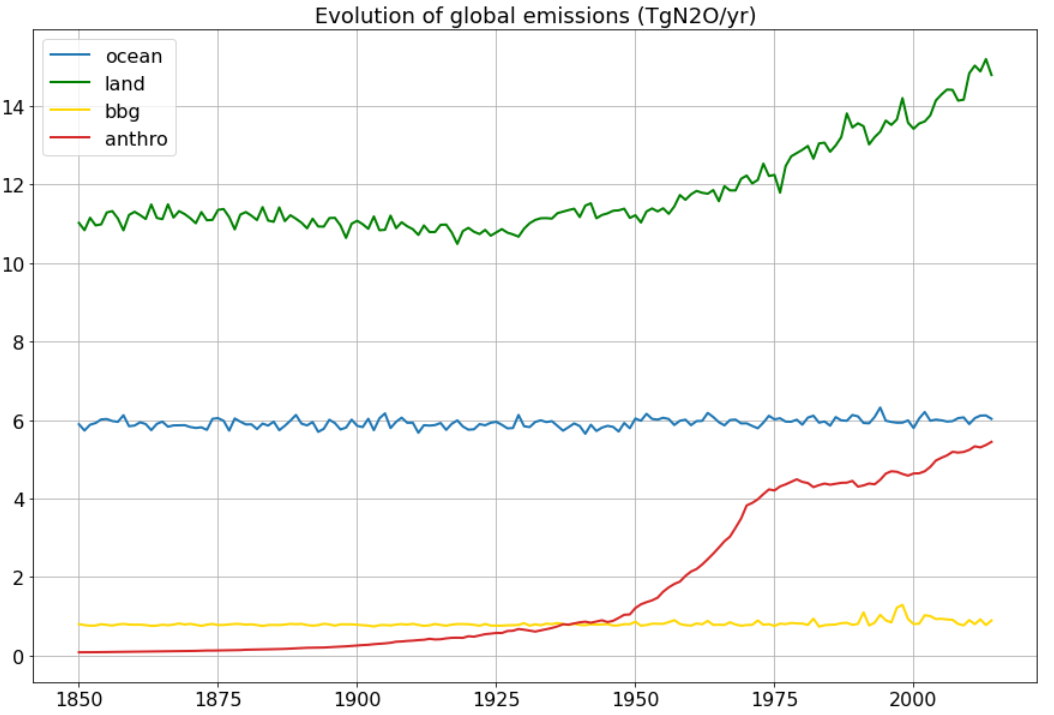
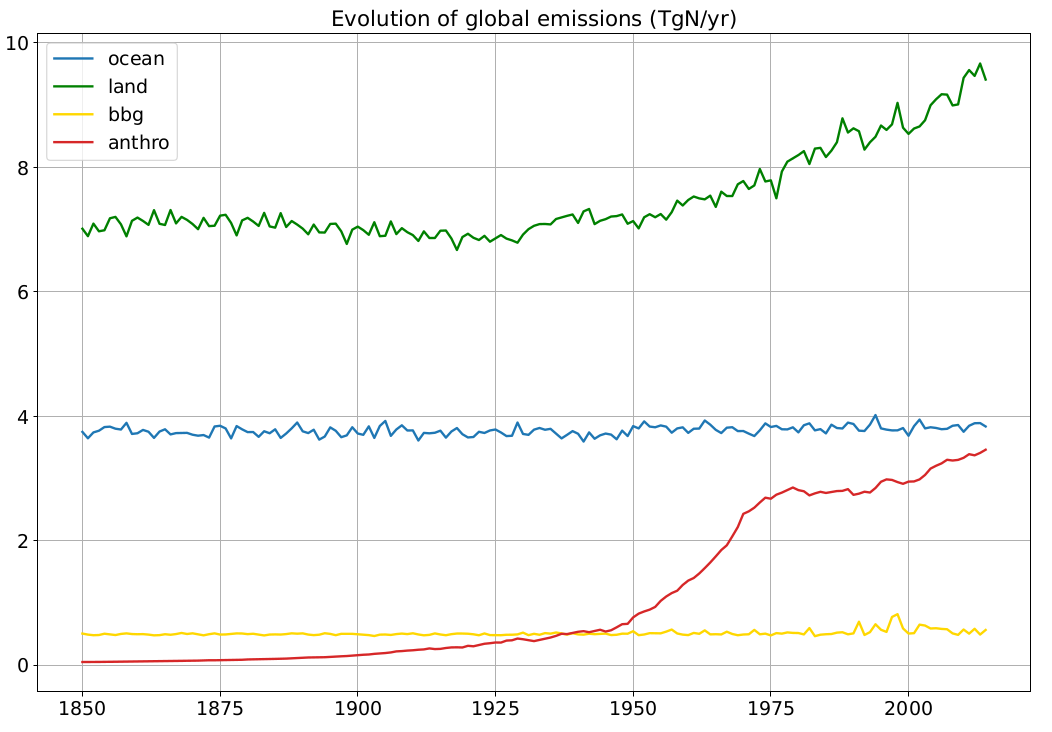
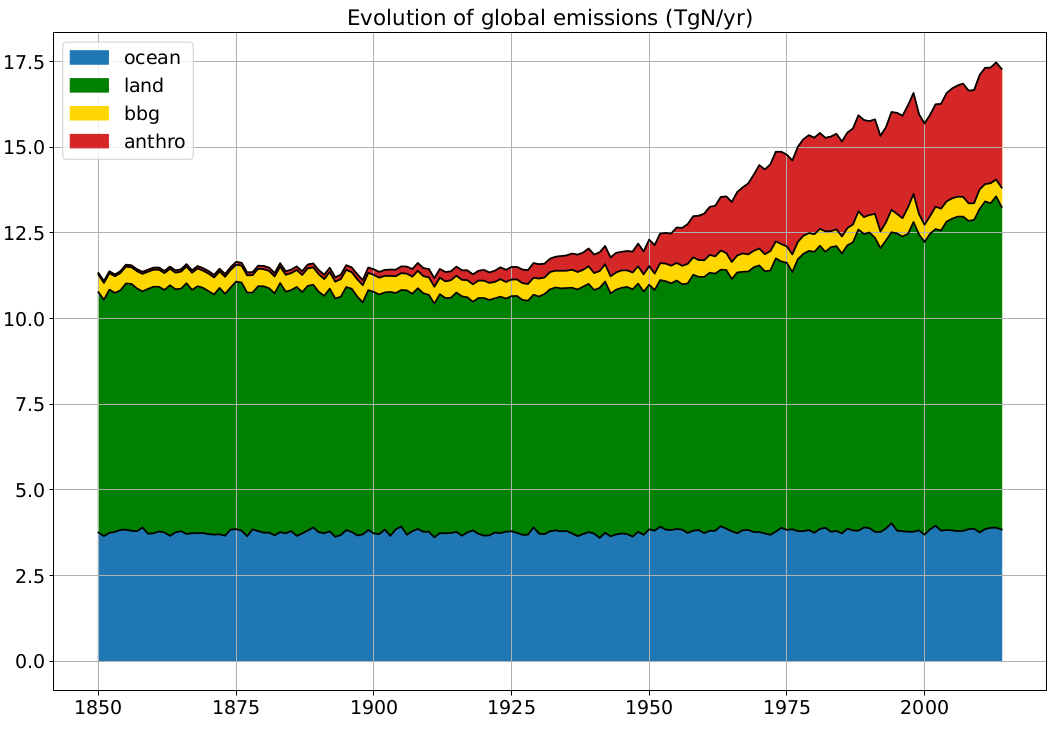
Emissions
- Land: from 7 TgN/Yr to 9.5 TgN/yr (increasing from 1930) => from 11 TgN2O/yr to 15 TgN2O/yr
- Ocean: 3.75 TgN/yr => 6 TgN2O/yr
- BBG: 0.5 TgN/yr => 0.8 TgN2O/yr
- Anthro: from 0 to 3.75 TgN/yr => from 0 to 5.5 TgN2O/yr


Pre industrial run
Some miscellaneous characteristics:
- GES configuration,
- 39 vertical layers, resolution 144x142,
- from fictives years 1970 to 2015,
- no anthropogenic emissions,
- BBG emissions stayed at 1850 (as well as aircraft).
Quantities to remember:
- Total N2O loss: 10.73 TgN/y
- Total N2O emissions: 10.73 TgN/y
- Burden : 1368 TgN


Added results (Nov 2023); comparison of lifetimes between the two simulations.

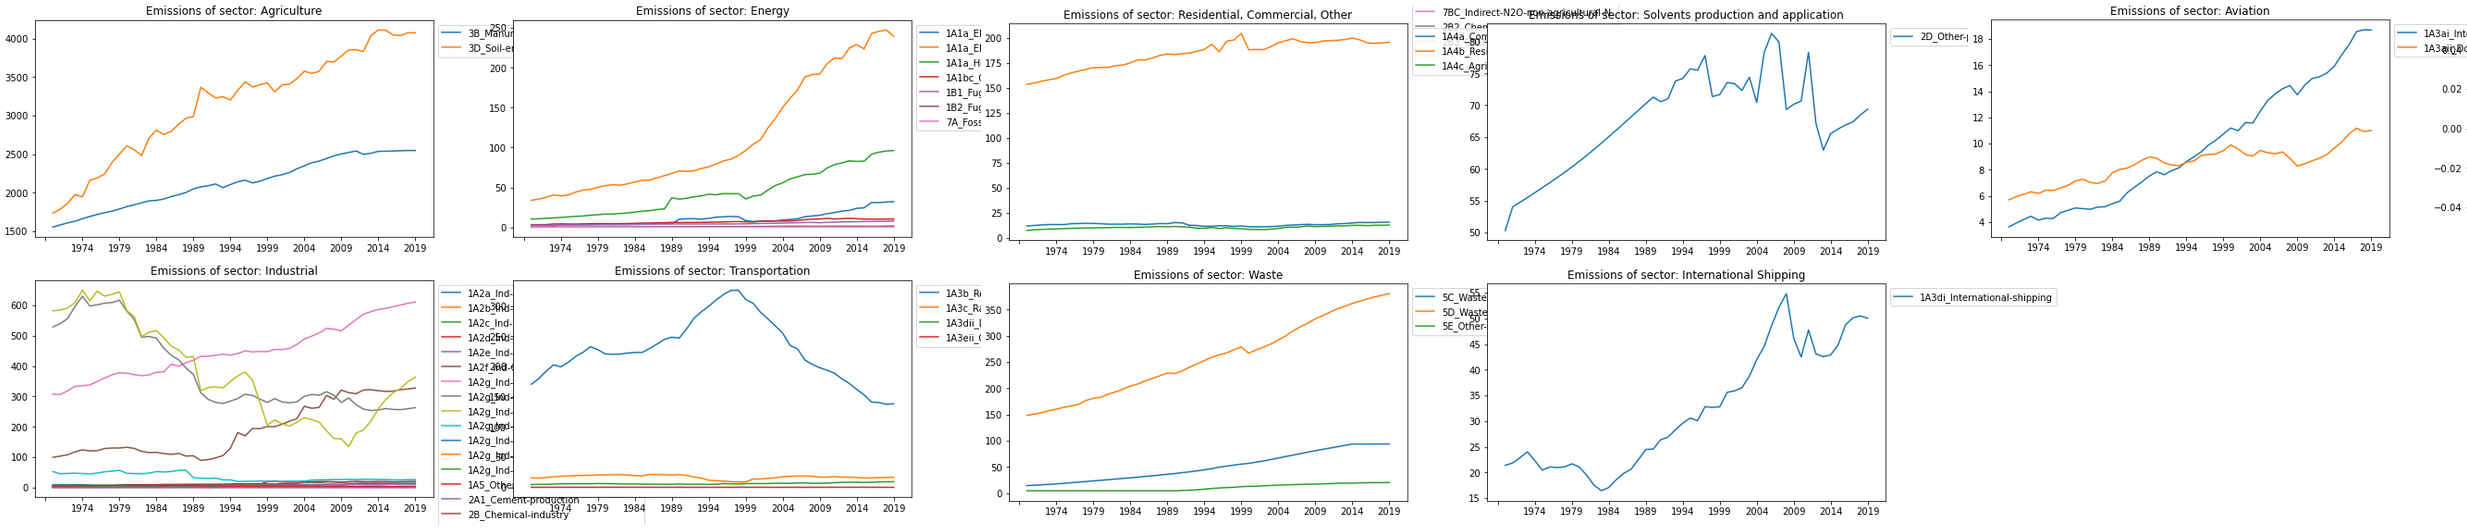
CEDS emissions for N2O (and NH3)


List of categories and subcategories:
- Agriculture: ['3B_Manure-management', '3D_Soil-emissions']
- Energy: ['1A1a_Electricity-autoproducer', '1A1a_Electricity-public', '1A1a_Heat-production', '1A1bc_Other-transformation','1B1_Fugitive-solid-fuels', '1B2_Fugitive-petr', '7A_Fossil-fuel-fires']
- Industrial: ['1A2a_Ind-Comb-Iron-steel', '1A2b_Ind-Comb-Non-ferrous-metals', '1A2c_Ind-Comb-Chemicals', '1A2d_Ind-Comb-Pulp-paper', '1A2e_Ind-Comb-Food-tobacco', '1A2f_Ind-Comb-Non-metalic-minerals', '1A2g_Ind-Comb-Construction', '1A2g_Ind-Comb-machinery','1A2g_Ind-Comb-mining-quarying', '1A2g_Ind-Comb-other','1A2g_Ind-Comb-textile-leather', '1A2g_Ind-Comb-transpequip','1A2g_Ind-Comb-wood-products','1A5_Other-unspecified', '2A1_Cement-production', '2B_Chemical-industry', '7BC_Indirect-N2O-non-agricultural-N', '2B2_Chemicals-Nitric-acid', '2B3_Chemicals-Adipic-acid']
- Transportation: ['1A3b_Road', '1A3c_Rail','1A3dii_Domestic-navigation', '1A3eii_Other-transp']
- Residential, Commercial, Other: ['1A4a_Commercial-institutional', '1A4b_Residential', '1A4c_Agriculture-forestry-fishing']
- Solvents production and application: [ '2D_Other-product-use' ]
- Waste: ['5C_Waste-combustion', '5D_Wastewater-handling', '5E_Other-waste-handling']
- Int. Aviation / Shipping ['1A3di_International-shipping', '1A3ai_International-aviation', '1A3aii_Domestic-aviation']
NB: It exists also some other subcategories but, there are zero N2O emission.

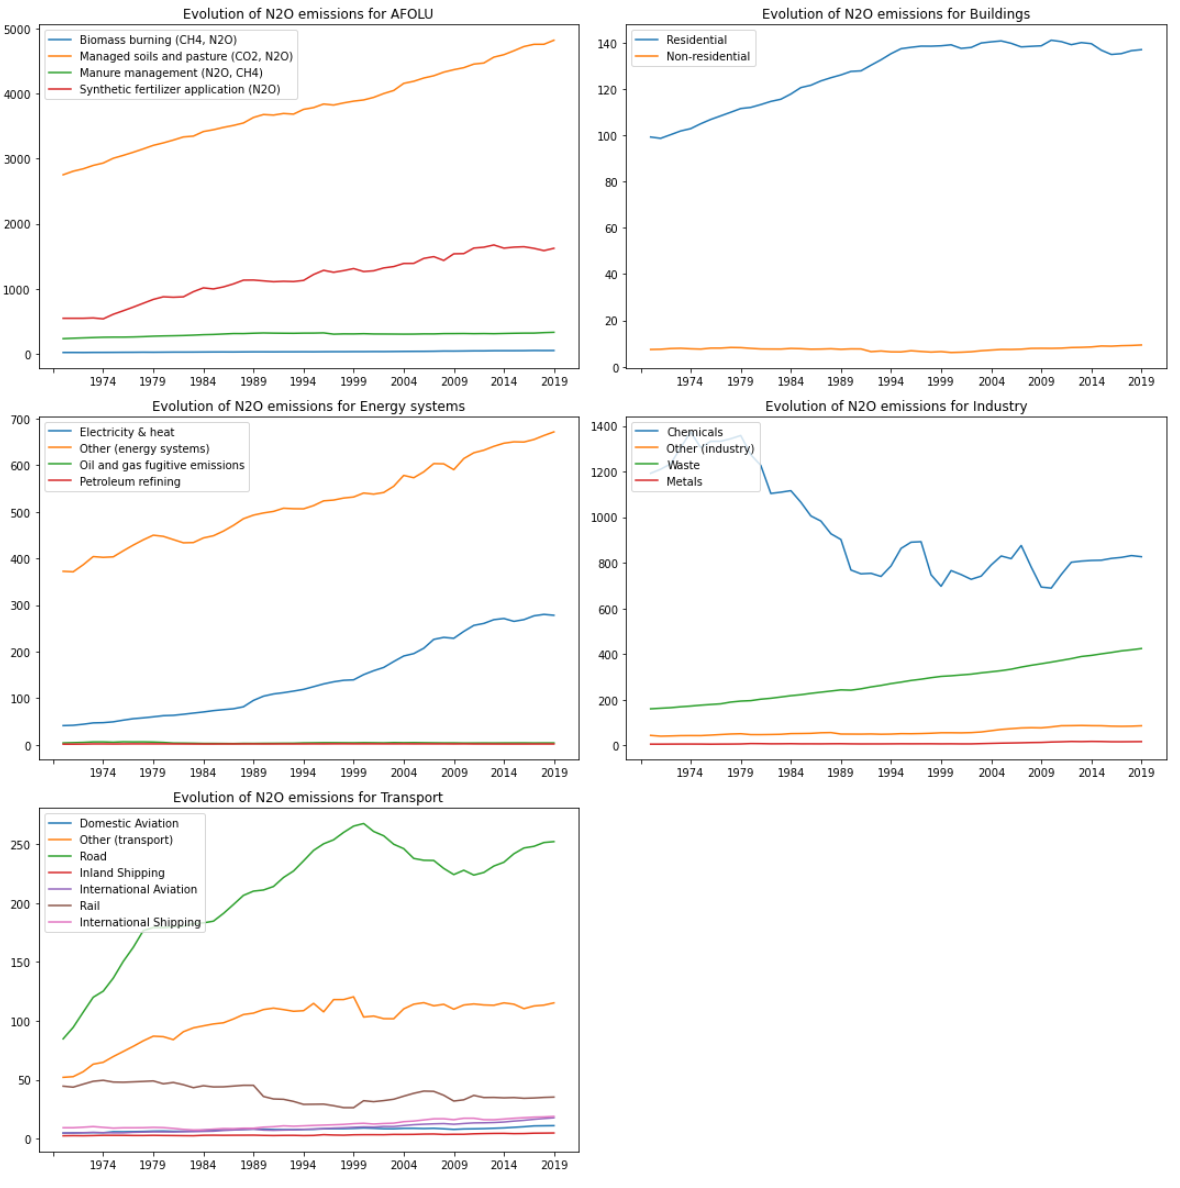
EDGAR emissions
List of categories and subcategories:
- AFOLU : ['Biomass burning (CH4, N2O)', 'Managed soils and pasture (CO2, N2O)', 'Manure management (N2O, CH4)', 'Synthetic fertilizer application (N2O)']
- Buildings : ['Residential', 'Non-residential']
- Energy systems : ['Electricity & heat', 'Other (energy systems)', 'Oil and gas fugitive emissions', 'Petroleum refining']
- Industry : ['Chemicals', 'Other (industry)', 'Waste', 'Metals']
- Transport : ['Domestic Aviation', 'Other (transport)', 'Road', 'Inland Shipping', 'International Aviation', 'Rail ', 'International Shipping']

Exploration of inventories
- Bouwman Inventory :
- 846 N2O emission measurements in agricultural fields and 99 measurements for NO emissions
- The data set includes literature reference; location of the Measurement; climate; soil type, texture, organic C content, N content, drainage, and pH; residues left in the field; crop; fertilizer type; N application rate; method and timing of fertilizer application; NH4+ application rate (for organic fertilizers), N2O/NO emission/denitrification (expressed as total over the measurement period, as % of N rate, and as % of N rate accounting for control); measurement technique; length of measurement period; frequency of the measurements; and additional information, such as year/season of measurement, information on soil, crop or fertilizer management, specific characteristics of the fertilizer used, and specific weather events important for explaining the measured emissions.
- global gridded (1°x1° resolution) data bases of soil type, soil texture, NDVI (vegetation indices) and climate.
- global emission thus calculated is 6.8 Tg N2O-N y-1. The tropics (± 30° of the equator) contribute 5.4 Tg N2O-N y-1 and the emission from extra-tropical regions (poleward of 30°) is 1.4 Tg N2O-N y-1 .
- Transcom Inventory :
- "Emissions from natural soils (6–7 TgN yr −1 ) account for 60–70 % of global N2O emissions (Syakila and Kroeze, 2011; Zaehle et al., 2011). The remaining 30–40 % of emissions is from oceans (4.5 TgN yr −1 )"
- Five different inversion frameworks (chemistry transport model) : MOZART4 (2.5° × 1.88°), ACMt42167 (2.8° × 2.8°), TM3 (5.0° × 3.75°), TM5 (6.0° × 4.0°), LMDZ4 (3.75° × 2.5°).
- Data set from Orchidee O-CN, Pisces, edgar-4.1, gfed-2 and from different category (terrestrial biosphere, ocean, waste water, solid waste, solvents, fuel prod, ground transport, industry combustion, residential and other combustion, shipping, biomass burning)
- Values of N2O emissions per inventory :
| (MtN/yr) | Ocean | Land | Total | (MtN2O/yr) | Ocean | Land | Total |
| Bouwman | 3.595 | 7.531 | 11.126 | xxx | 5.650 | 11.835 | 17.485 |
| Transcom | 4.222 | 10.573 | 14.795 | xxx | 6.634 | 16.614 | 23.248 |
| Piscidee | 3.962 | 7.107 | 11.069 | xxx | 6.226 | 11.168 | 17.394 |
- Comparison between Incasflx outputs and masks on NetCDF files:
| - Output INCASFLX - | - Notebook computing (FracMask?) - | - Notebook computing (0/1 Mask) - | |||||||
| (MtN2O/yr) | Ocean | Land | Ratio O/L | Ocean | Land | Ratio O/L | Ocean | Land | Ratio O/L |
| Bouwman | 5.6505 | 11.835 | 0.478 | 6.58 | 10.945 | 0.6012 | 5.973 | 11.552 | 0.517 |
| 32.3% | 67.7% | 37.6% | 62.4% | 34.1% | 65.9% | ||||
| Transcom | 6.634 | 16.614 | 0.399 | 8.879 | 14.421 | 0.616 | 8.118 | 15.184 | 0.535 |
| 28.5% | 71.5% | 38.1% | 61.9% | 34.8% | 65.2% | ||||
| Piscidee | 6.226 | 11.168 | 0.557 | 6.651 | 10.782 | 0.617 | 6.095 | 11.339 | 0.538 |
| 35.8% | 64.2% | 38.2% | 61.8% | 34.9% | 65.1% | ||||
General remarks: Variable for Bouwman = fn2o_oce & fn2o_soil. Land emissions > Ocean emissions. Ocean emissions ~ 6 Mt/yr. Land emissions -> differences because of different period (pre-industrial & nowadays). Per line, Ocean+Land are equal independently of the calculation made.
Attachments (13)
- EDGAR_emissions.png (237.1 KB) - added by klaurent 18 months ago.
- CEDS_emissions.png (359.7 KB) - added by klaurent 18 months ago.
- global_em_N2O_accumulated.png (115.5 KB) - added by klaurent 17 months ago.
- global_em_N2O_alone.png (120.5 KB) - added by klaurent 17 months ago.
- global_em_alone_TgN.pdf (19.2 KB) - added by klaurent 17 months ago.
- global_em_accumulated_TgN.pdf (21.4 KB) - added by klaurent 17 months ago.
- global_em_alone_TgN.png (75.6 KB) - added by klaurent 17 months ago.
- global_em_accumulated_TgN.png (76.4 KB) - added by klaurent 17 months ago.
- final_em.png (48.1 KB) - added by klaurent 17 months ago.
- final_em_sect.png (364.6 KB) - added by klaurent 17 months ago.
- figure5_2spinup.png (170.0 KB) - added by klaurent 5 months ago.
- figure4_.png (105.4 KB) - added by klaurent 5 months ago.
- preindus_lifetimes.png (76.8 KB) - added by klaurent 5 months ago.
Download all attachments as: .zip