| Version 7 (modified by klaurent, 20 months ago) (diff) |
|---|
Intermediate conclusions
Pre industrial run
Some miscellaneous characteristics:
- GES configuration,
- 39 vertical layers, resolution 144x142,
- from fictives years 1970 to 2015,
- no anthropogenic emissions,
- BBG emissions stayed at 1850 (as well as aircraft).
Quantities to remember:
- Total N2O loss: 10.73 TgN/y
- Total N2O emissions: 10.73 TgN/y
- Burden : 1368 TgN


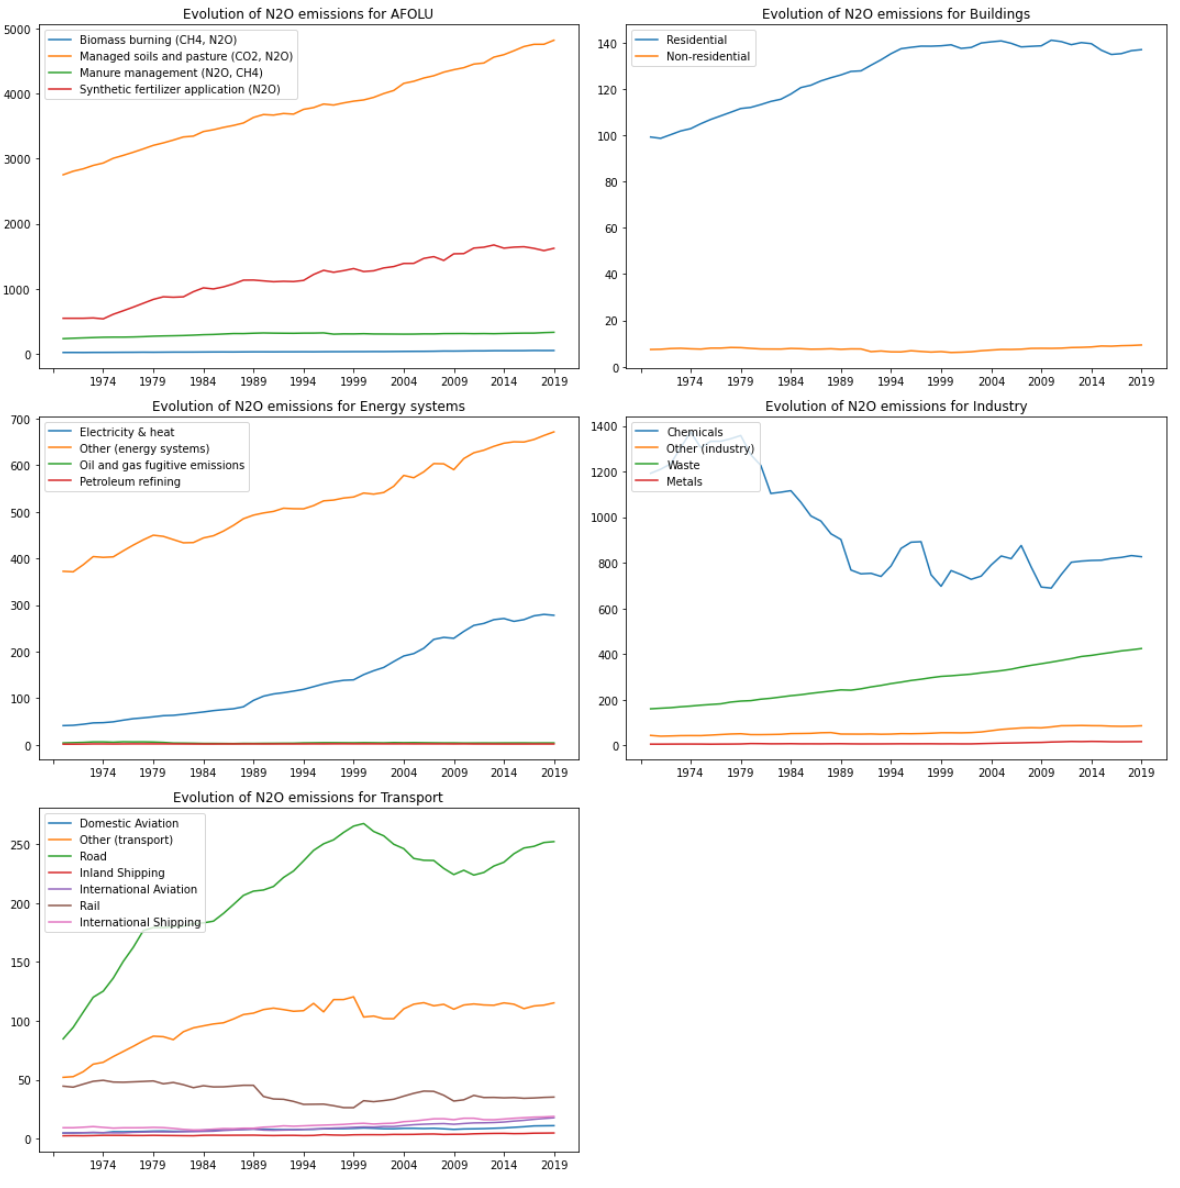
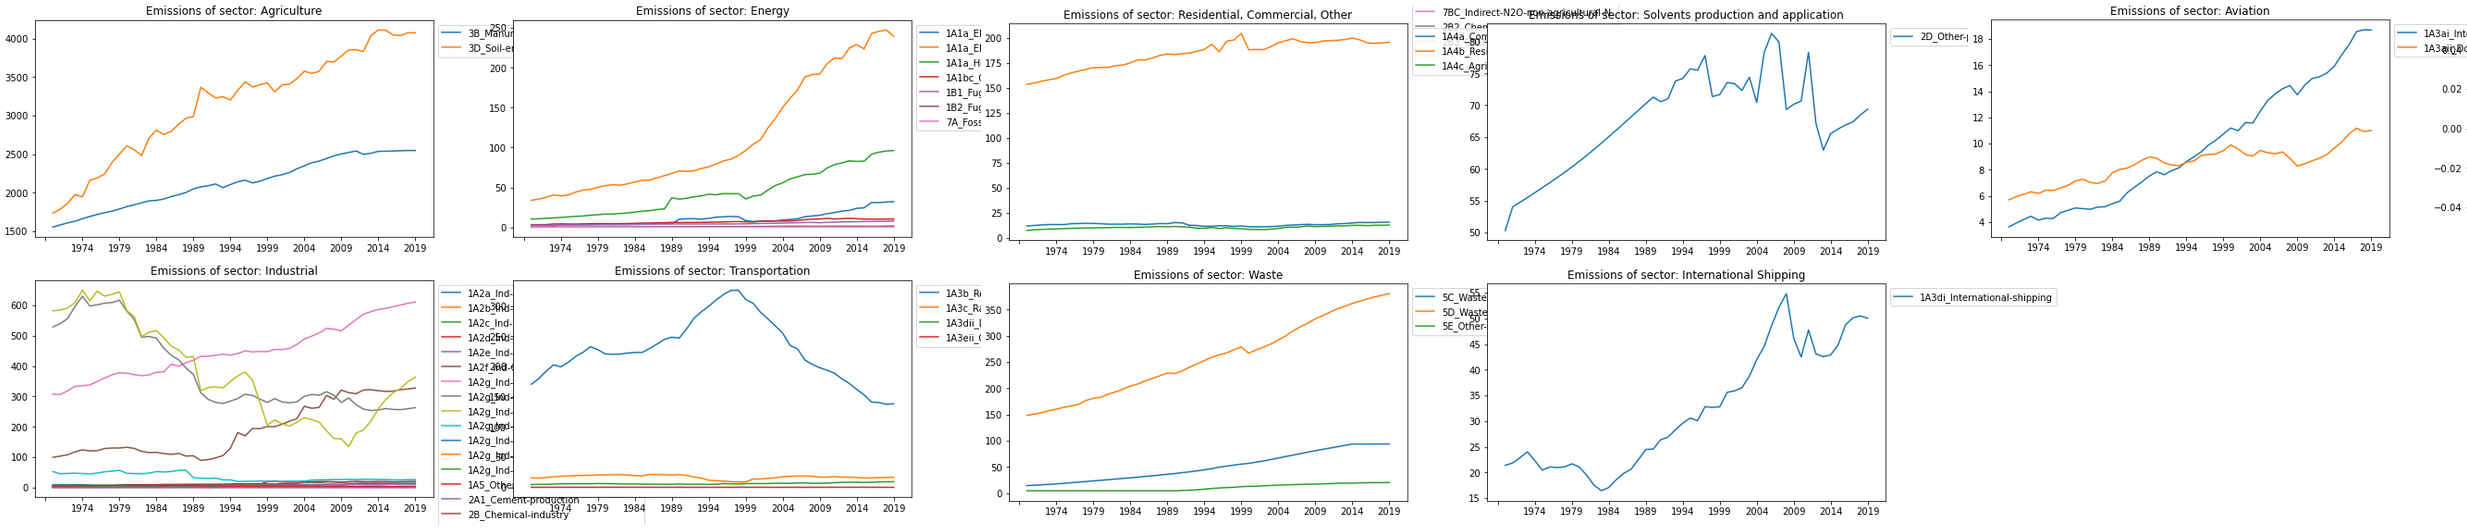
CEDS emissions for N2O (and NH3)


Exploration of inventories
- Bouwman Inventory :
- 846 N2O emission measurements in agricultural fields and 99 measurements for NO emissions
- The data set includes literature reference; location of the Measurement; climate; soil type, texture, organic C content, N content, drainage, and pH; residues left in the field; crop; fertilizer type; N application rate; method and timing of fertilizer application; NH4+ application rate (for organic fertilizers), N2O/NO emission/denitrification (expressed as total over the measurement period, as % of N rate, and as % of N rate accounting for control); measurement technique; length of measurement period; frequency of the measurements; and additional information, such as year/season of measurement, information on soil, crop or fertilizer management, specific characteristics of the fertilizer used, and specific weather events important for explaining the measured emissions.
- global gridded (1°x1° resolution) data bases of soil type, soil texture, NDVI (vegetation indices) and climate.
- global emission thus calculated is 6.8 Tg N2O-N y-1. The tropics (± 30° of the equator) contribute 5.4 Tg N2O-N y-1 and the emission from extra-tropical regions (poleward of 30°) is 1.4 Tg N2O-N y-1 .
- Transcom Inventory :
- "Emissions from natural soils (6–7 TgN yr −1 ) account for 60–70 % of global N2O emissions (Syakila and Kroeze, 2011; Zaehle et al., 2011). The remaining 30–40 % of emissions is from oceans (4.5 TgN yr −1 )"
- Five different inversion frameworks (chemistry transport model) : MOZART4 (2.5° × 1.88°), ACMt42167 (2.8° × 2.8°), TM3 (5.0° × 3.75°), TM5 (6.0° × 4.0°), LMDZ4 (3.75° × 2.5°).
- Data set from Orchidee O-CN, Pisces, edgar-4.1, gfed-2 and from different category (terrestrial biosphere, ocean, waste water, solid waste, solvents, fuel prod, ground transport, industry combustion, residential and other combustion, shipping, biomass burning)
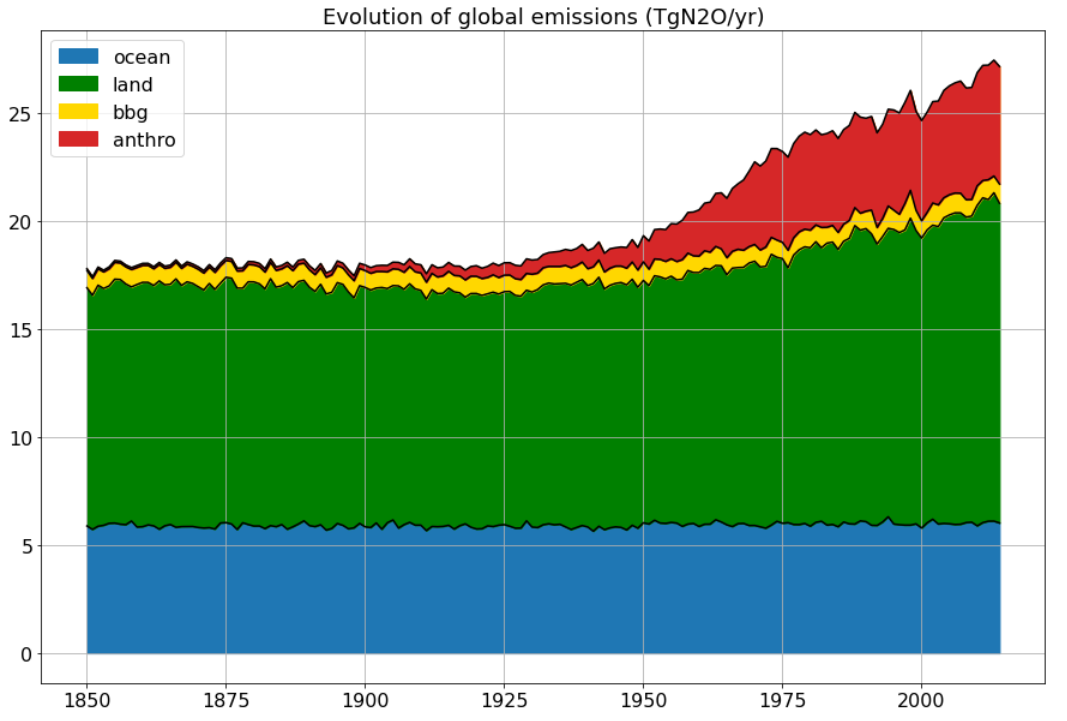
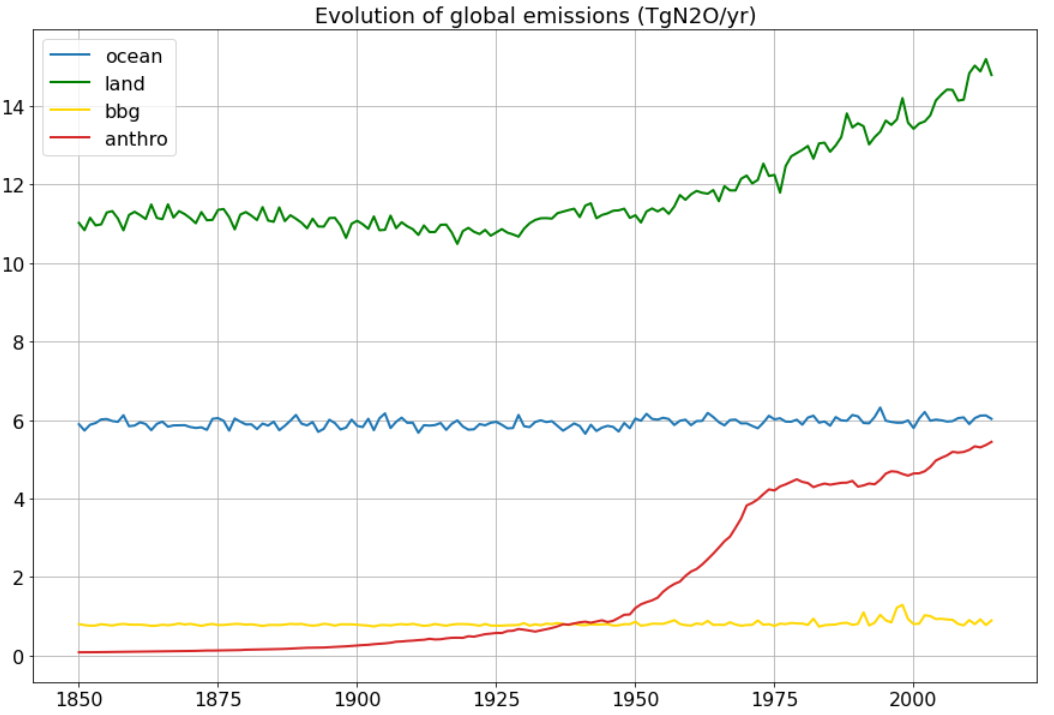
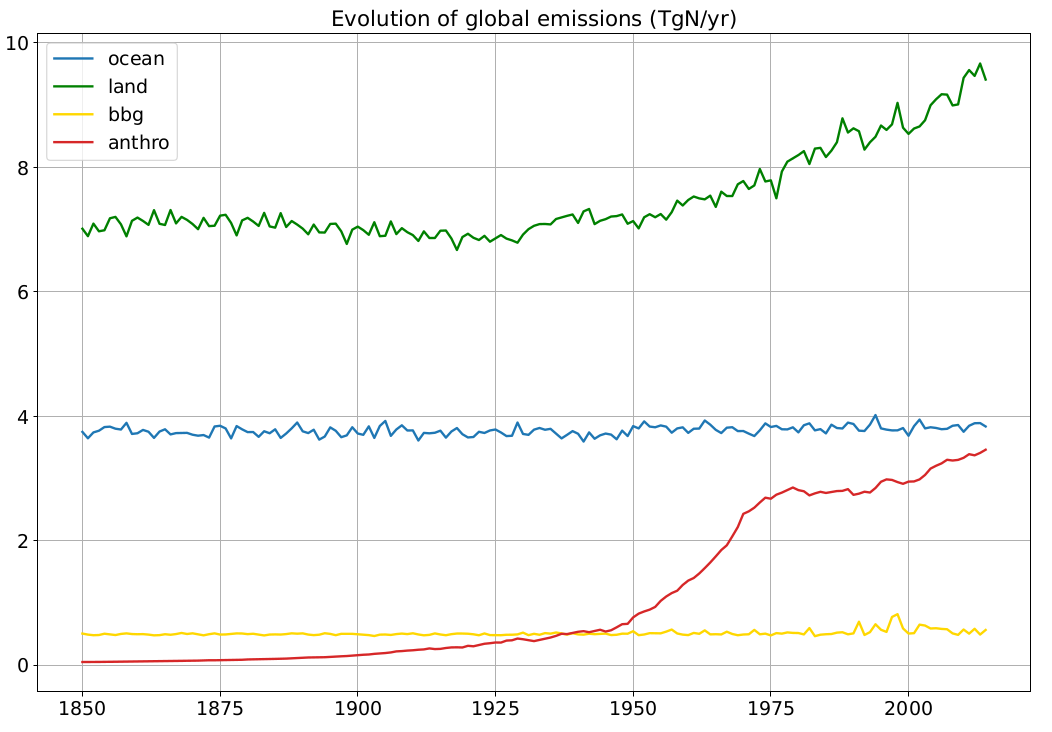
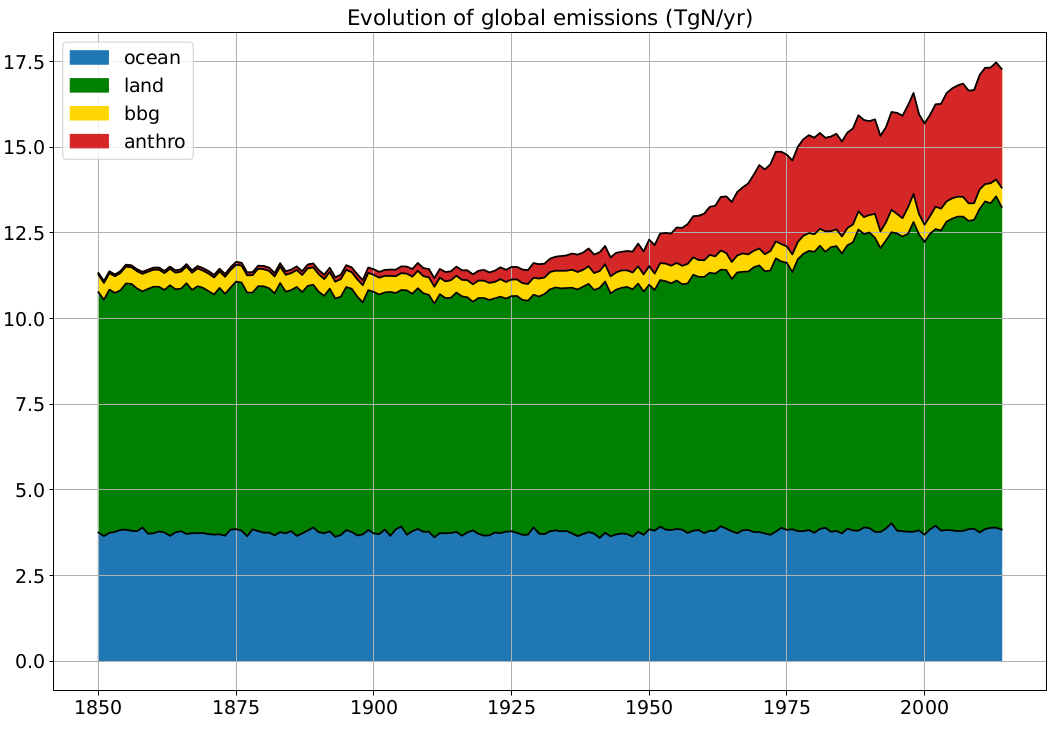
- Values of N2O emissions per inventory :
| (MtN/yr) | Ocean | Land | Total | (MtN2O/yr) | Ocean | Land | Total |
| Bouwman | 3.595 | 7.531 | 11.126 | xxx | 5.650 | 11.835 | 17.485 |
| Transcom | 4.222 | 10.573 | 14.795 | xxx | 6.634 | 16.614 | 23.248 |
| Piscidee | 3.962 | 7.107 | 11.069 | xxx | 6.226 | 11.168 | 17.394 |
- Comparison between Incasflx outputs and masks on NetCDF files:
| - Output INCASFLX - | - Notebook computing (FracMask?) - | - Notebook computing (0/1 Mask) - | |||||||
| (MtN2O/yr) | Ocean | Land | Ratio O/L | Ocean | Land | Ratio O/L | Ocean | Land | Ratio O/L |
| Bouwman | 5.6505 | 11.835 | 0.478 | 6.58 | 10.945 | 0.6012 | 5.973 | 11.552 | 0.517 |
| 32.3% | 67.7% | 37.6% | 62.4% | 34.1% | 65.9% | ||||
| Transcom | 6.634 | 16.614 | 0.399 | 8.879 | 14.421 | 0.616 | 8.118 | 15.184 | 0.535 |
| 28.5% | 71.5% | 38.1% | 61.9% | 34.8% | 65.2% | ||||
| Piscidee | 6.226 | 11.168 | 0.557 | 6.651 | 10.782 | 0.617 | 6.095 | 11.339 | 0.538 |
| 35.8% | 64.2% | 38.2% | 61.8% | 34.9% | 65.1% | ||||
General remarks: Variable for Bouwman = fn2o_oce & fn2o_soil. Land emissions > Ocean emissions. Ocean emissions ~ 6 Mt/yr. Land emissions -> differences because of different period (pre-industrial & nowadays). Per line, Ocean+Land are equal independently of the calculation made.
Attachments (13)
- EDGAR_emissions.png (237.1 KB) - added by klaurent 18 months ago.
- CEDS_emissions.png (359.7 KB) - added by klaurent 18 months ago.
- global_em_N2O_accumulated.png (115.5 KB) - added by klaurent 16 months ago.
- global_em_N2O_alone.png (120.5 KB) - added by klaurent 16 months ago.
- global_em_alone_TgN.pdf (19.2 KB) - added by klaurent 16 months ago.
- global_em_accumulated_TgN.pdf (21.4 KB) - added by klaurent 16 months ago.
- global_em_alone_TgN.png (75.6 KB) - added by klaurent 16 months ago.
- global_em_accumulated_TgN.png (76.4 KB) - added by klaurent 16 months ago.
- final_em.png (48.1 KB) - added by klaurent 16 months ago.
- final_em_sect.png (364.6 KB) - added by klaurent 16 months ago.
- figure5_2spinup.png (170.0 KB) - added by klaurent 5 months ago.
- figure4_.png (105.4 KB) - added by klaurent 5 months ago.
- preindus_lifetimes.png (76.8 KB) - added by klaurent 5 months ago.
Download all attachments as: .zip