| Version 22 (modified by ledouard, 6 years ago) (diff) |
|---|
Internship of Louis-Axel Edouard-Rambaut
- Internship of Louis-Axel Edouard-Rambaut
- I - EDGAR and ORCHIDEE
- II - N2O emissions
- III - NH3 emissions
This internship has been conducted during my Master 1 of Ecology. This work is a first report of the global emissions of N2O and NH3 estimated by the model. The localisation of the main emission, the evolution of the emissions and the response of the emissions with fertilizers have been described. The emissions estimated in ORCHIDEE have been compared with the one estimated by the inventory EDGAR. A work of hgarmonization have been conducted to allow a robust comparaison between the EDGAR sources and ORCHIDEE.
I - EDGAR and ORCHIDEE
Differents simulations used in the comparaisons : S1B and S4
- S1B is obtnaied withe the following forcing : CLIM+CO2+LCLU+NDEP+NFER+MANN;
- S4 is obtained with the following forcing : CLIM+ CO2+LCLU
with CLIM:climate, CO2: atmospheric CO2, LCLU: land cover and land use change, NDEP: N deposition,NFER: N fertilizer use, and MANN: manure N use.
The simulations are located
https://vesg.ipsl.upmc.fr/thredds/catalog/store/p529vui/OL2/PROD/NMIP-halfdeg/catalog.html :
To compare the emissions estimated in ORCHIDEE and in EDGAR, we only took agricultural soils emissions. For EDGAR we selected several Sources of emissions :
- Agricultural soils (4C + 4D) [AS]
- Indirect N2O emissions from agriculture (4D3) [I]
The total emissions of N2O we took in consideration is T = [AS] - [I] since the leaching flux are put out of the system in ORCHIDEE.
The emissions relatives to those sources are obtainable here in EDGAR (http://edgar.jrc.ec.europa.eu/overview.php?v=432_GHG&SECURE=123)
We compared these emissions estimated by EDGAR with the emissions of the PFTs 10, 11, 12 and 13.
Grid resolution :
- ORCHIDEE : 0.5°*0.5°
- EDGAR : 0.1°*0.1°
Period studied :
- ORCHIDEE : from 01/01/1861 to 31/12/2016, monthly emissions
- EDGAR : from 1970 to 2012, annual emissions
II - N2O emissions
A - Emissions of N2O in ORCHIDEE
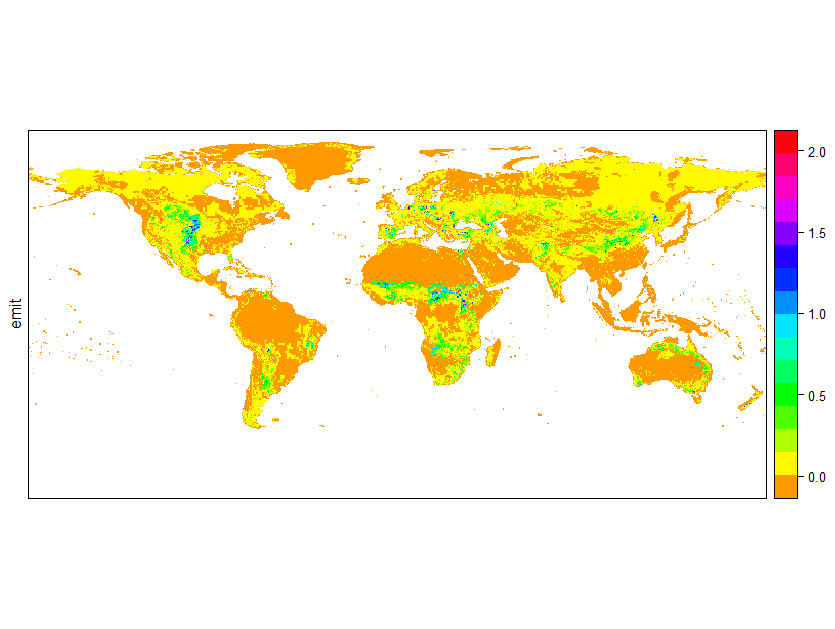
1 - Maps of emissions for the 2010-2015 period

|
Figure 1 : Emissions of N2O (in gN2O-N.m-2.years-1) estimated by ORCHIDEE for the 2010-2015 period for all the PFTs
2 - Evolution of the emissions for the 1861-2016 period

|
Figure 2 : Emissions of N2O (in gN2O-N.m-2.years-1) estimated by ORCHIDEE for the 1860-2015 period for the whole world
The regression is obtained with the ggplot2 package on r (type="loess") and is here only for a representative mean.
In black is represented the emissions for all the PFTs.
In blue is represented the emissions for the PFTs 12 and 13.
In green is represented the emissions for the PFTs 10, 11, 12 and 13.
In orange is represented the emissions for the PFTs 1 to 9
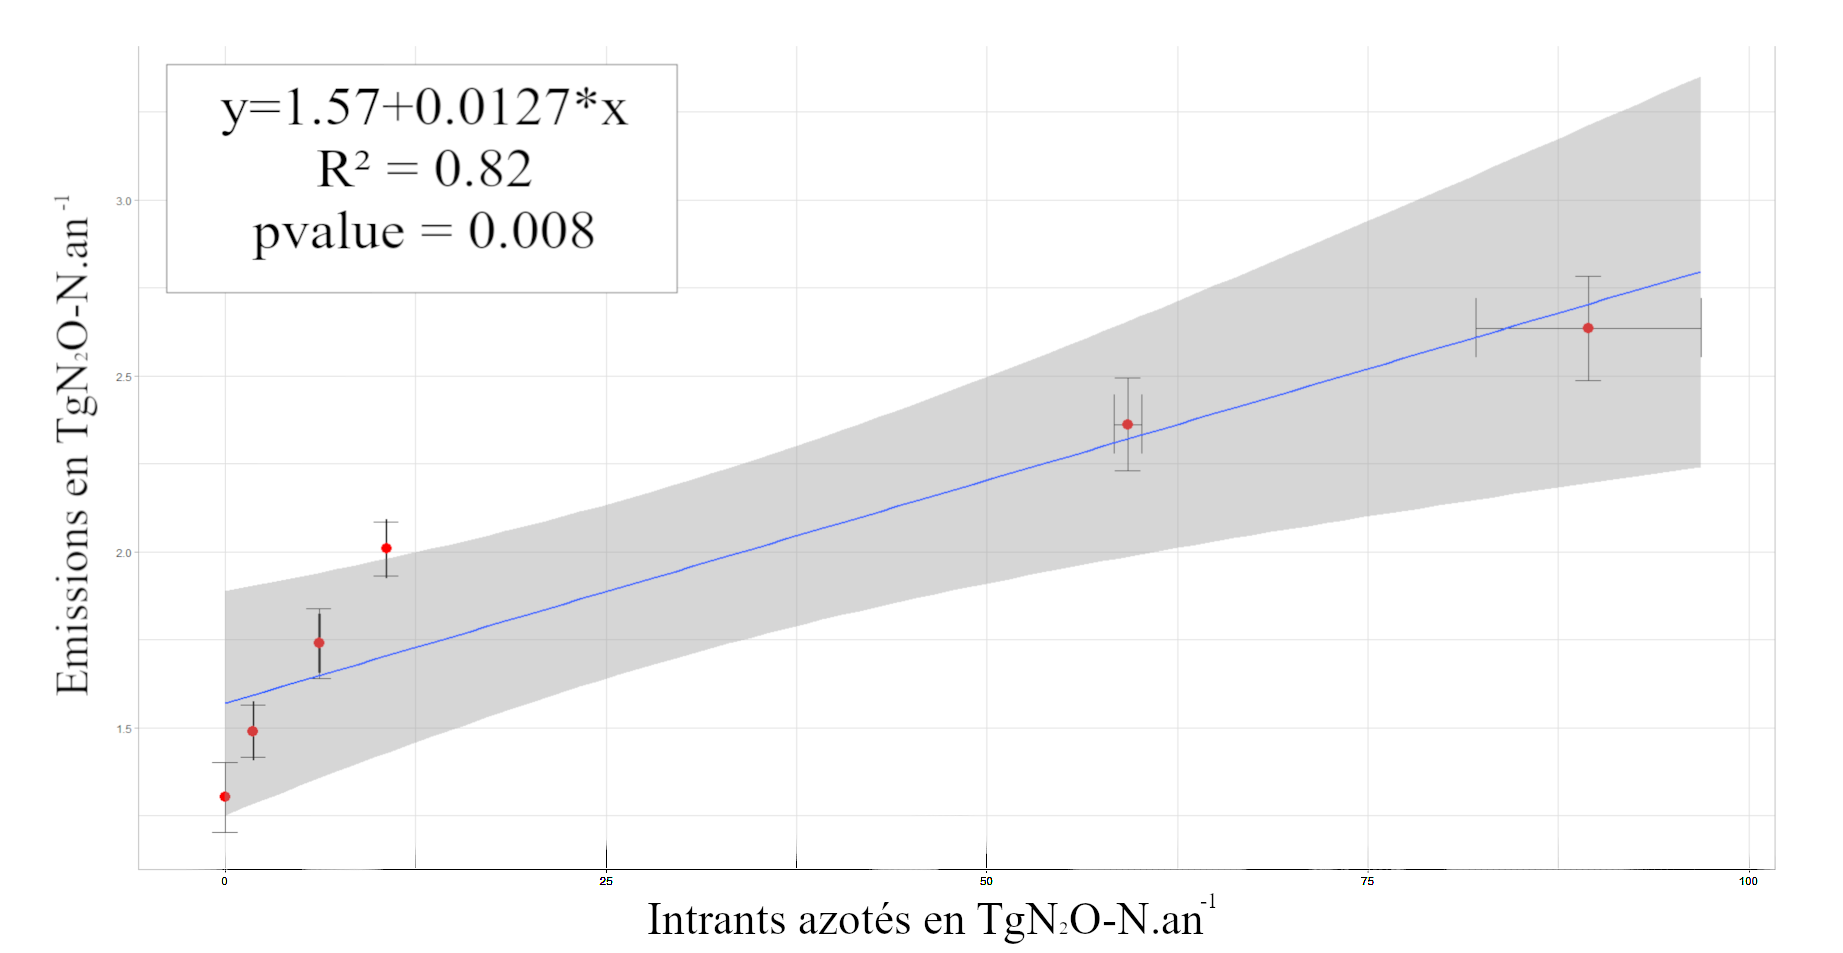
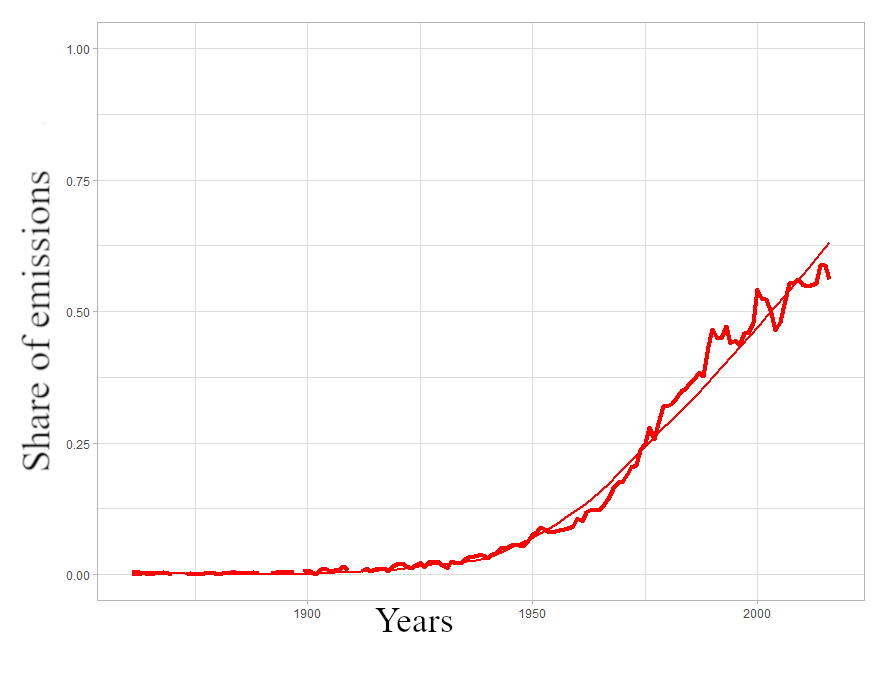
3 - Effects of the fertilizers on the emissions

|
Figure 3 : Global annual emissions of N2O (in TgN.years-1) estimated by ORCHIDEE in fonction of the fertilizers (in TgN.years-1). In blue is represented the linear regresssion and the grey zone correspond to the confidence interval of the regression.
s1b.png "N2O(S1-S4)/S1")
|
Figure 4 : Share of the emissions of N2O in ORCHIDEE due to the modification of the N cycle
This figure is obtained by doing the following operations on the annual emisisons : Share of emission = (S1B-S4) / S1B
- with S1B the annual N2O emissions in the S1B simulations
- with S4 the annual N2O emissions in the S4 simulations
B - Comparaison of N2O emissions between EDGAR and ORCHIDEE
1 - Maps of emission
The PFT selected in ORCHIDEE to do the comparaison are the following : 10 ; 11 ; 12 ; 13 (only wherethe N_Fertilizants there was striclty positive)

|
Figure 5 : Global annual emissions of N2O (in TgN.years-1) estimated by ORCHIDEE in fonction of the fertilizers (in TgN.years-1). In blue is represented the linear regresssion and the grey zone correspond to the confidence interval of the regression.
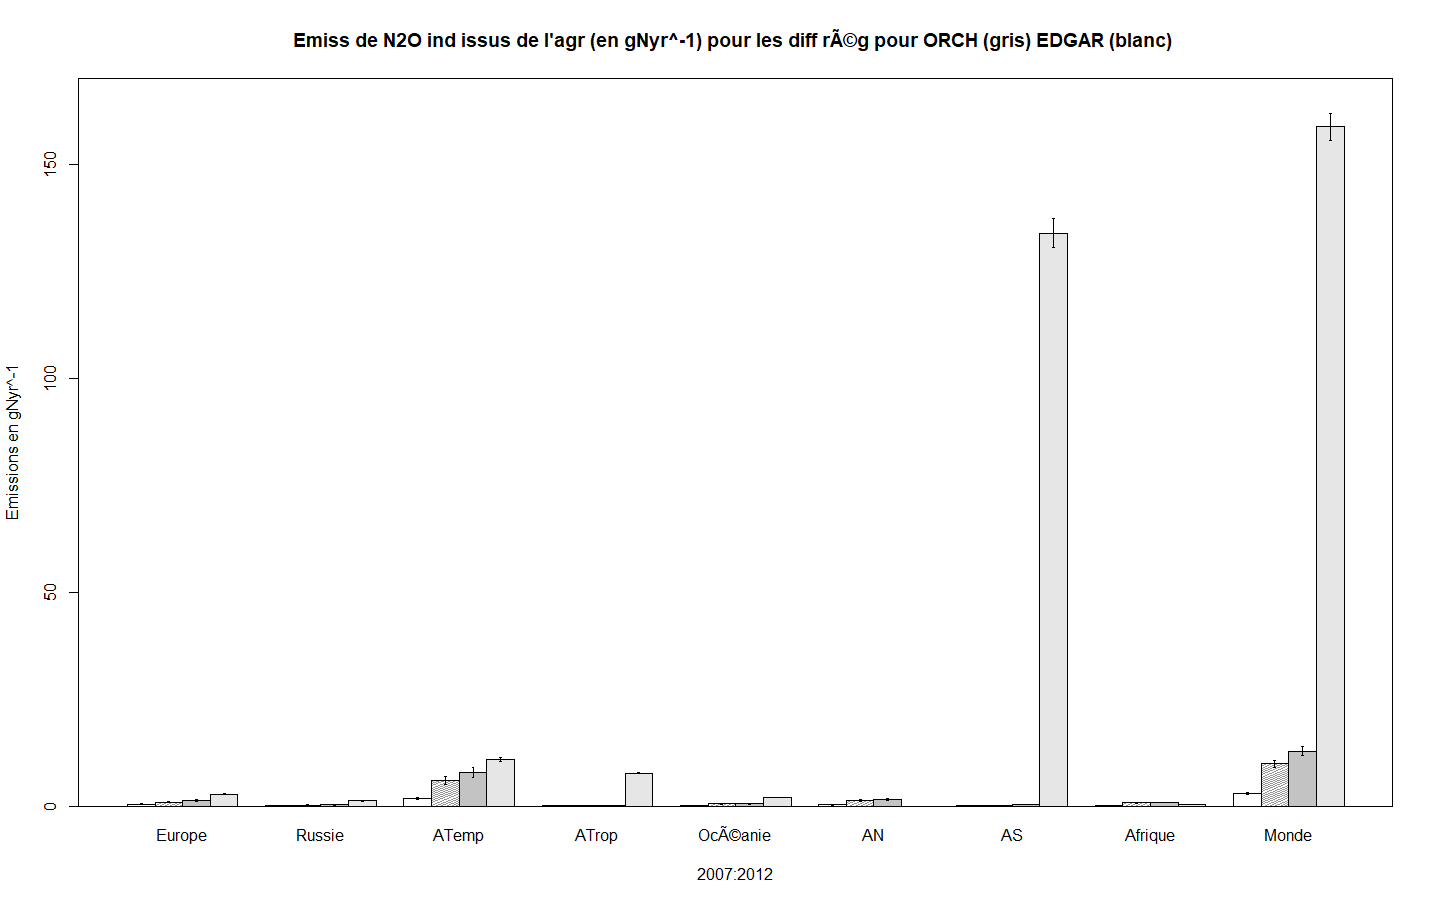
2 - Evolutions of emission between 1860-2015
a)  b) b) 
|
Figure 5: Means emissions estimated of N2O for each region for differents regions by EDGAR and ORCHIDEE for the period 1970-1975 (in Tg N2O-N.an-1). The Standard-Deviation are represented by the variation bar. The regions of temperate Asia, tropical Asia, north America and south America are nammed withe following terms «ATemp», «ATrop», «AN», «AS».
- a) For the period 1970-1975
- b) For the period 2007-2012
The bars represents (from left to right) the emissions from anthroposied grasslands estimated by ORCHIDEE, the emissions from crops estimated by ORCHIDEE ORCHIDEE, the emissions from anthoposied grasslands and crops estimated by ORCHIDEE ORCHIDEE and the emissions estimated by EDGAR.
3 - Maps of emission

|
Figure 6 : Emissions of N2O (en gN.m-2.years-1) to the global scale by EDGAR (a) and by ORCHIDEE (b)
III - NH3 emissions
A = Evolution of the emissions for the 1861-2016 period In ORCHIDEE
1 - Map of the emission
a)  b) b) 
|
Figure 7 : Emissions of NH3(in gNH3-N.m-2.an-1) estimated by ORCHIDEE period for all the PFTs
- a) For the period 1970-1975
- b) For the period 2007-2012
2 - Evolution of the emissions for the 1861-2016 period

|
Figure 8 : Emissions of NH3 (in Tg.yr-1) estimated by ORCHIDEE for the 1860-2015 period for the whole world
In red is represented the emissions for all the PFTs.
In orange is represented the emissions for the PFTs 12 and 13.
In black is represented the emissions for the PFTs 10 and 11.
In blue is represented the emissions for the PFTs 10, 11, 12 and 13.
In greenis represented the emissions for the PFTs 1 to 9
3 - Effects of the fertilizers on the emissions
/S1")
|
Figure 9 : Share of the emissions of NH3 in ORCHIDEE due to the modification of the N cycle
This figure represent : (S1B-S4) / S1B
- with S1B the annual N2O emissions in the S1B simulations
- with S4 the annual N2O emissions in the S4 simulations
B - Comparaison of NH3 emissions between ORCHIDEE and EDGAR
1 - Regional emissions
The PFT selected in ORCHIDEE to do the comparaison are the following : 10 ; 11 ; 12 ; 13 (only wherethe N_Fertilizants there was striclty positive)
a)  b) b) 
|
Figure 10 : Means emissions estimated of N2O for each region for differents regions by EDGAR and ORCHIDEE for the period 1970-1975 (in Tg N2O-N.an-1). The Standard-Deviation are represented by the variation bar. The regions of temperate Asia, tropical Asia, north America and south America are nammed withe following terms «ATemp», «ATrop», «AN», «AS».
- For the period 1970-1975
- For the period 2007-2012
The bars represents (from left to right) the emissions from anthroposied grasslands estimated by ORCHIDEE, the emissions from crops estimated by ORCHIDEE ORCHIDEE, the emissions from anthoposied grasslands and crops estimated by ORCHIDEE ORCHIDEE and the emissions estimated by EDGAR.
2 - Evolutions of emissions between 1860-2015

|
Figure 11 : Emissions of NH3 (in Tg.yr-1) estimated by ORCHIDEE and EDGAR for the 1970-2012 period for the whole world
In cyan is represented the emission of NH3 estimated by EDGAR
The other color represent the same emissions as in the II-A-Figure
3 - Maps of emissions
| Emissions of NH3(in gNH3-N.m-2.years-1) estimated | |
| EDGAR | |
| For the 1970-1975 period | For the 2007-2012 period |
a)  | b) 
|
| ORCHIDEE | |
| For the 1970-1975 period | For the 2007-2012 period |
| a) | b)
|
Attachments (28)
-
Rapport Louis-Axel.pdf
(1.3 MB) -
added by ledouard 6 years ago.
Internship_report
- ORCHIDEE tot.png (78.1 KB) - added by ledouard 6 years ago.
- n2o temp.png (19.3 KB) - added by ledouard 6 years ago.
- CARTE 2.png (207.1 KB) - added by ledouard 6 years ago.
- 0712real.png (111.8 KB) - added by ledouard 6 years ago.
- 7075 final.png (61.9 KB) - added by ledouard 6 years ago.
- Ferti.png (125.3 KB) - added by ledouard 6 years ago.
-
1860-2015.png
(16.2 KB) -
added by ledouard 6 years ago.
Emissions of NH3 19612016
- EDGAR NH3 ORCHID wt mask.png (11.2 KB) - added by ledouard 6 years ago.
- 7075 ORCHID 02.png (20.4 KB) - added by ledouard 6 years ago.
- ORCHID 0712.png (18.4 KB) - added by ledouard 6 years ago.
- MOYENNES 0712.png (11.8 KB) - added by ledouard 6 years ago.
- MOYENNES 7075.png (13.0 KB) - added by ledouard 6 years ago.
- 7012 NH3 eo.png (11.8 KB) - added by ledouard 6 years ago.
- MOYENNES 0712.2.png (9.6 KB) - added by ledouard 6 years ago.
- MOYENNES 7075.2.png (8.3 KB) - added by ledouard 6 years ago.
-
0712 edgar.png
(65.3 KB) -
added by ledouard 6 years ago.
NH3
-
EDGAR 7075 016.png.png
(30.2 KB) -
added by ledouard 6 years ago.
NH3
- 0712 edgar NH3.png (80.3 KB) - added by ledouard 6 years ago.
-
EDGAR 7075 NH3.png
(74.3 KB) -
added by ledouard 6 years ago.
EDGAR 7075 016.png.png
- S1bS4S1.2.png (29.6 KB) - added by ledouard 6 years ago.
- (s1b-s4)s1b.2.png (30.0 KB) - added by ledouard 6 years ago.
- 7012 NH3 eo.2.png (32.4 KB) - added by ledouard 6 years ago.
-
S1bS4S1.png
(30.2 KB) -
added by ledouard 6 years ago.
NH3(S1-S4)/S1
-
(s1b-s4)s1b.png
(30.2 KB) -
added by ledouard 6 years ago.
N2O(S1-S4)/S1
- EmiEDFG.png (18.8 KB) - added by ledouard 6 years ago.
- Entrées VS SOrties N.png (28.8 KB) - added by ledouard 6 years ago.
- Entrée VS Sorties mensuelles.png (30.8 KB) - added by ledouard 6 years ago.
s1b.2.png)
s1b.2.png)
s1b.png)