Opened 3 years ago
Closed 3 years ago
#2563 closed Defect (fixed)
trunk is overly slow to run
| Reported by: | clem | Owned by: | systeam |
|---|---|---|---|
| Priority: | low | Milestone: | |
| Component: | MULTIPLE | Version: | trunk |
| Severity: | critical | Keywords: | |
| Cc: | smasson |
Description (last modified by nemo)
I compared the runtime of 2 ORCA2 simulations without pisces. One is based on 4.0-HEAD and the other one is based on the actual trunk (r13721). I ran the simulations for 1 year without changing anything in the reference namelists. I used 40 processors on 1 core of Jean-Zay machine in attached mode (monthly outputs). Results are worrying.
4.0-HEAD = 4h cpu time
trunk = 12h cpu time
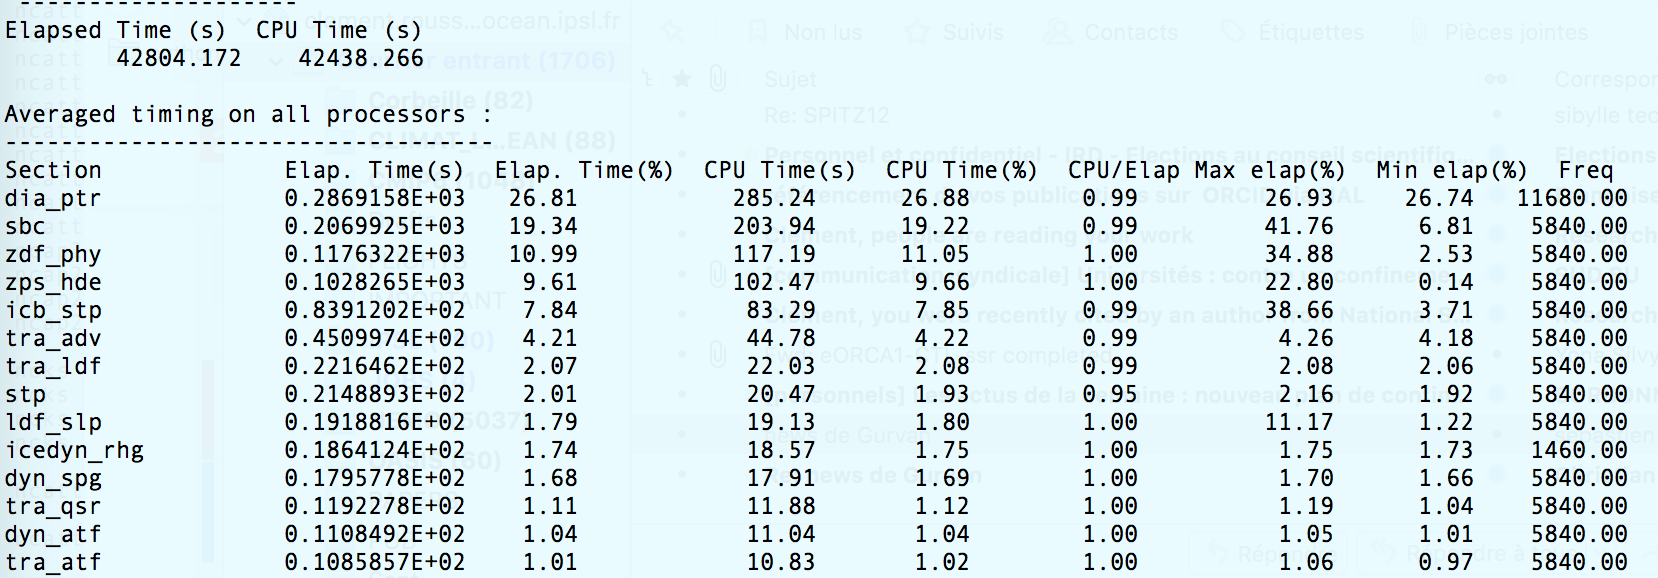
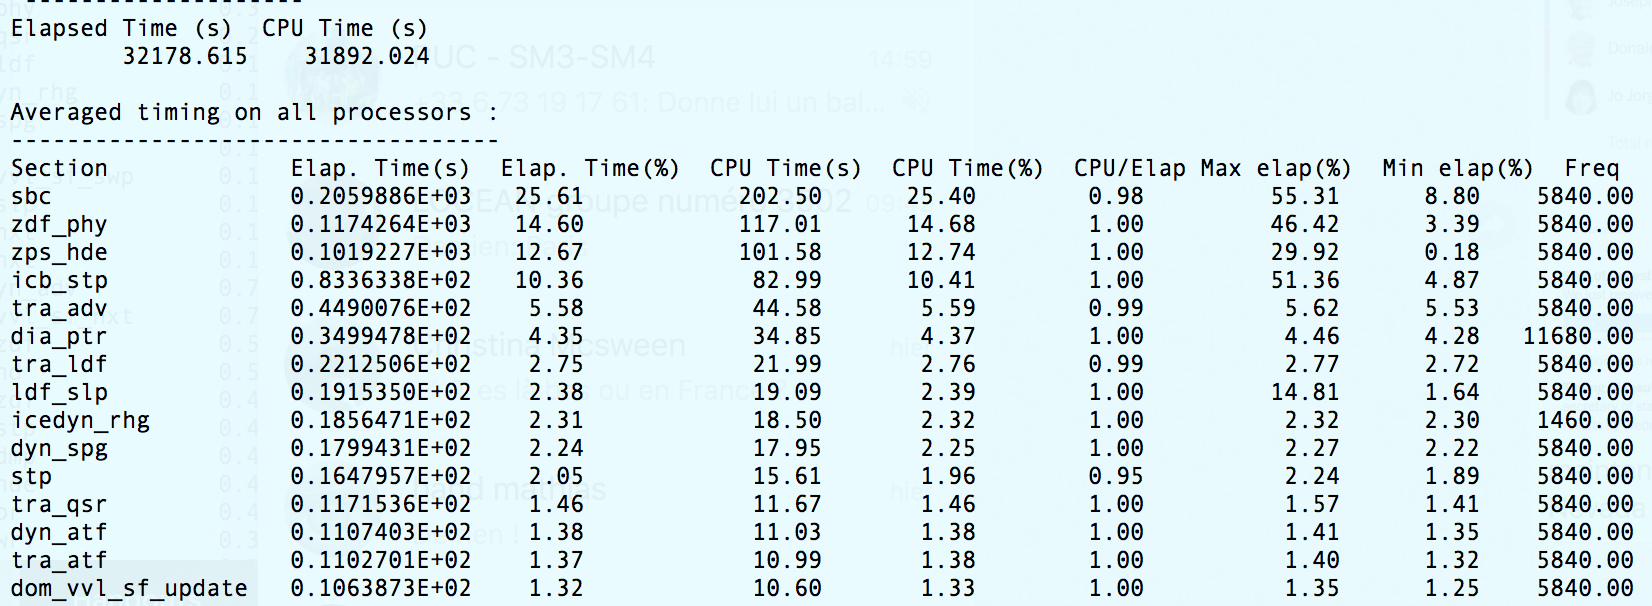
Time is tripled in the trunk. The timing.output file indicates an issue with diaptr that has been reported recently (ticket #2559). But a number of other routines are also super slow (e.g. sbc, zdf_phy, icb_stp etc). I'll try to attach the logs (if I find the attachement button)
I am either missing something or we are facing a huge problem here.
Commit History (1)
| Changeset | Author | Time | ChangeLog |
|---|---|---|---|
| 13747 | smasson | 2020-11-09T09:08:14+01:00 | trunk: remove array copy when calling xios_send_field in iom_put interfaces, see #2563 |
Attachments (28)
Change History (63)
Changed 3 years ago by clem
Changed 3 years ago by clem
comment:1 Changed 3 years ago by hadcv
comment:2 Changed 3 years ago by clem
Same xios libraries between 4.0 and the trunk indeed.
I tried commenting out all the "xios_send_field" in iom.F90 but I end up with the same very long runtime. I noted that the runtime for each time step is increasing with time in the trunk, contrary to 4.0
comment:3 Changed 3 years ago by clem
and I also removed the output refered to dia_ptr (because this routine needs 100 global communications). Well, same kind of problem happens. Time spent at each time step is increasing with time. Maybe doubled every 2500 time steps or so

comment:4 Changed 3 years ago by smasson
2 points:
- in sette tests in think that most of us are not using XIOS in "detached" mode as it is more convenient, i.e. in iodef.xml we usually have
In this case, XIOS performance are expected to be very bad.
<variable id="using_server" type="bool">false</variable>
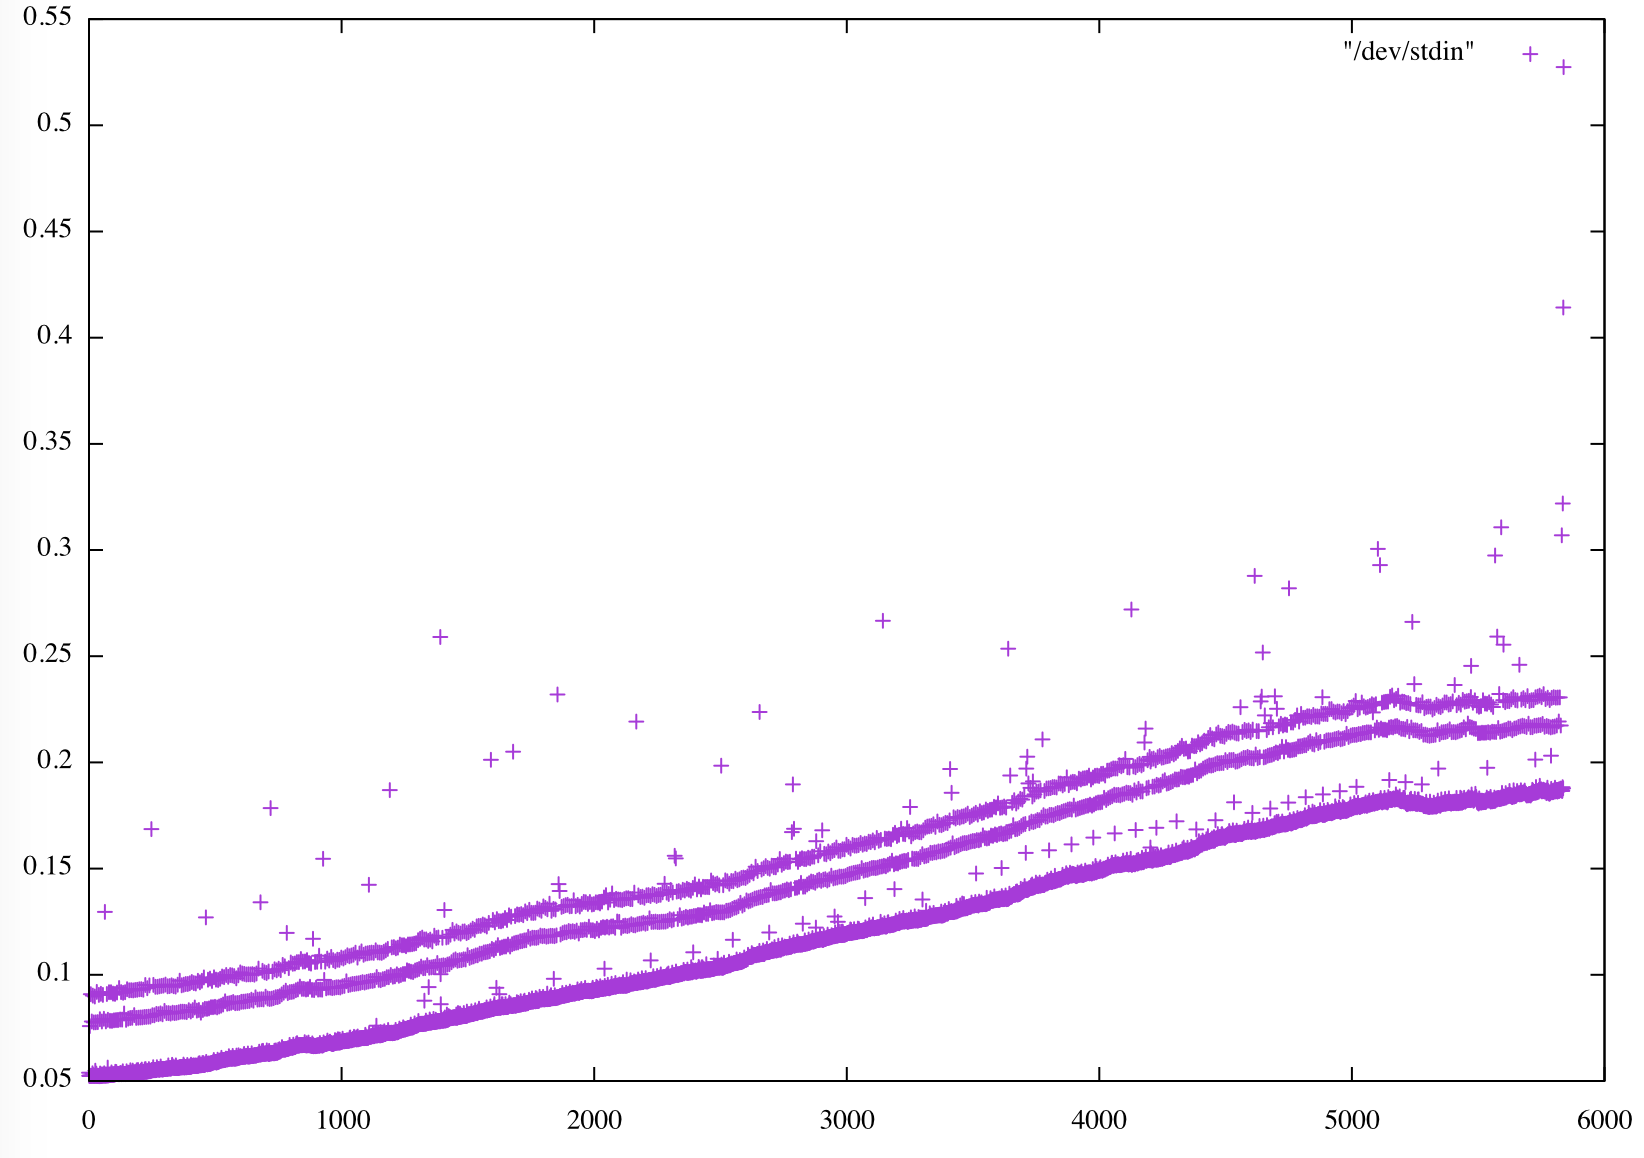
- the increasing runtime of each time step is quite embarrassing... Clem can you plot this evolution with this command:
module load gnuplot
grep " timing step" timing.output | sed -e "s/.*: *//" | gnuplot -p -e 'plot "/dev/stdin"'
comment:5 Changed 3 years ago by smasson
- Cc smasson added
comment:6 Changed 3 years ago by smasson
- Description modified (diff)
Nice demonstration... :-(
For sure HPC performances of the trunk are quite different from the 4.0...
Some memory leak somewhere?
Hopefully we have a big mistake somewhere that could be fixed quickly...
comment:7 Changed 3 years ago by nemo
- Description modified (diff)
comment:9 Changed 3 years ago by smasson
great job on wiki formatting ;-)
Changed 3 years ago by smasson
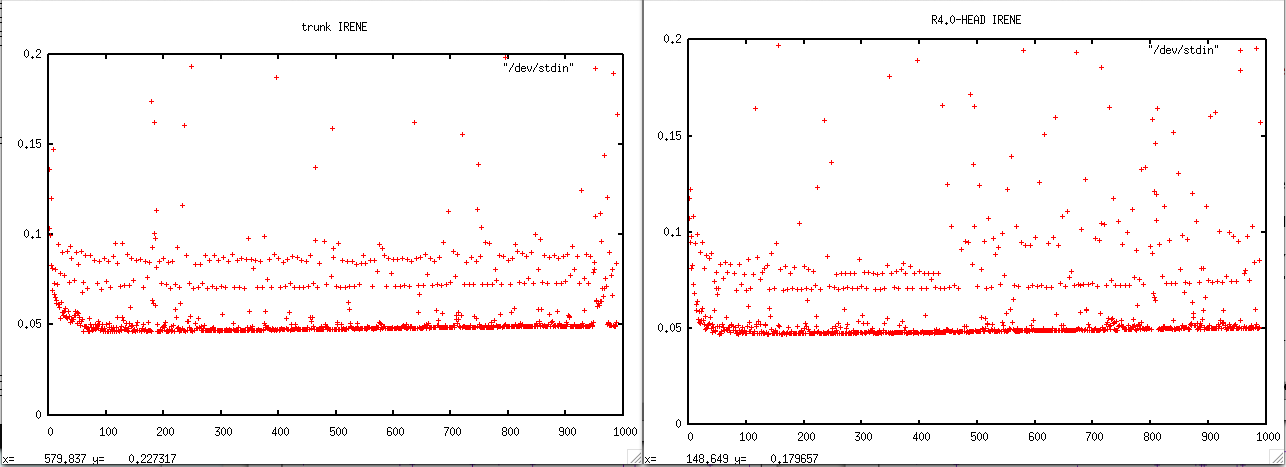
comment:10 Changed 3 years ago by smasson
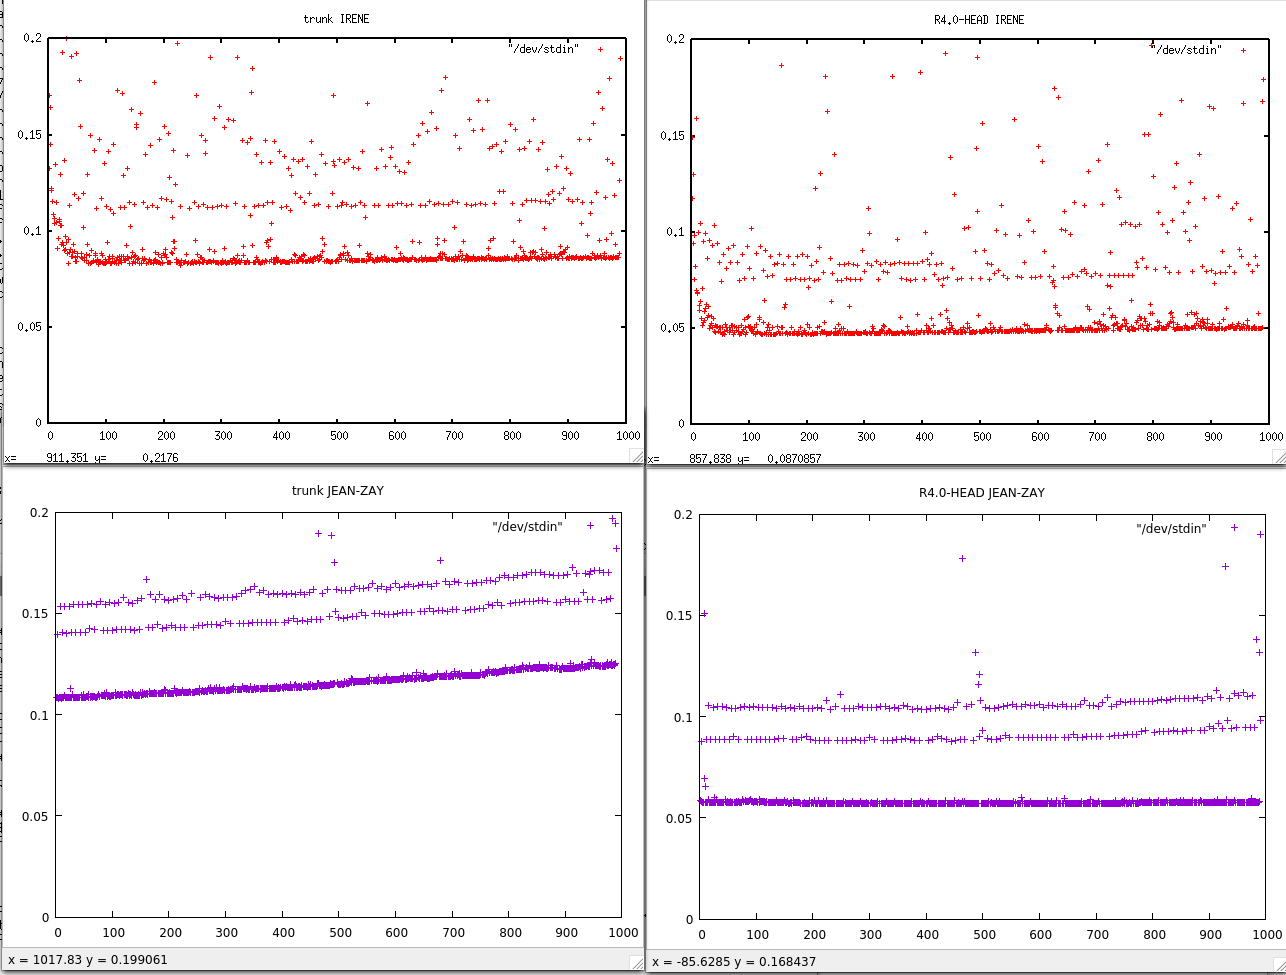
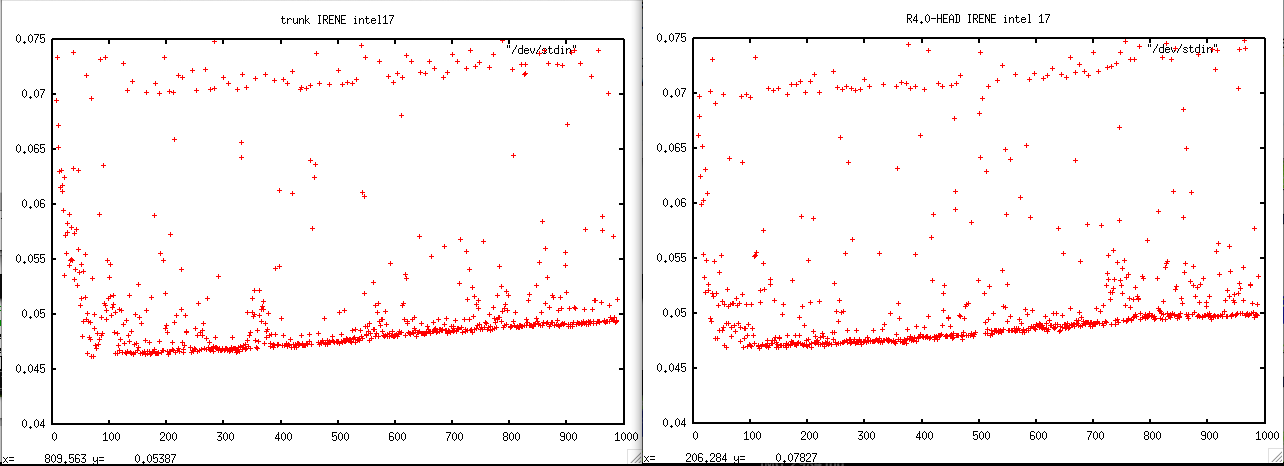
OK, I was able to reproduce the same problem with trunk@13722 and r4.0-HEAD@13720
I used the LONG simulation from sette with ORCA2_ICE_PISCES but without key_top
- on IRENE : trunk is about twice slower
- on JEAN-ZAY: trunk is also about twice slower, but in addition, there is a nice positive trend in the time duration needed to compute 1 time step.
I add the small command which allows me to do these plots with gnuplot from timing.output:
grep " timing step" timing.output | sed -e "s/.*: *//" | gnuplot -p -e 'set yrange [0:.2] ; set title "trunk IRENE" ; plot "/dev/stdin"'
Changed 3 years ago by smasson
comment:11 Changed 3 years ago by smasson
Some progress...
Suppressing key_iomput suppress the shift between the trunk and r4.0-HEAD.
-> I suspect modifications I done in iom_put (array copy to suppress halos from outputs)... I am now testing this...
But we still have a drift with the trunk on Jean-Zay...
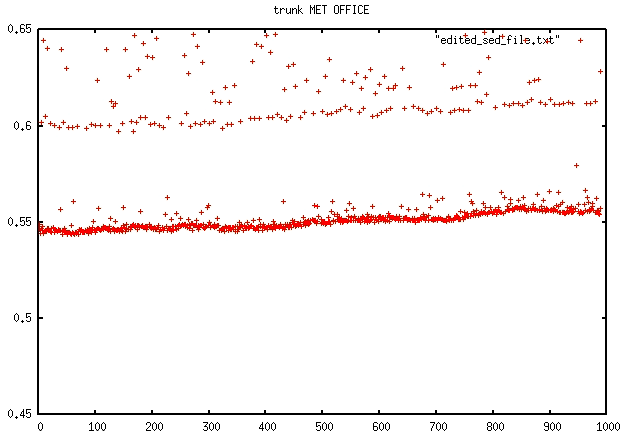
comment:12 Changed 3 years ago by ayoung
I have tried running a back-to-back of the current trunk vs r4.0.4 on the Met Office HPC. Looking at the timing.outputs for ORCA2_ICE_PISCES/LONG, running SPMD (attached XIOS servers), there is no significant increase in solve time. There is a slight increase (total solve time: trunk = 19,774s vs r4.0.4 = 18,516s) but this is solely due to the increase in dia_ptr time. The order of the timings is roughly the same between the two with tra_adv still the largest contributor. It would seem that we could narrow it down to some kind of architecture/compiler/environment specific issue which affects: sbc, zdf_phy, zps_hde and icb_stp.
Job Specifications
Compiler: Intel (version 18.0.5.274)
Flags: %FCFLAGS -r8 -i4 -init=zero -init=arrays -traceback -debug minimal -debug inline-debug-info -O2 -fp-model consistent
Cores: 32 (jnpi=4, jpnj=8)
XIOS: Attached (SPMD)
comment:13 Changed 3 years ago by clem
Thanks Amy. Could you precise how many cores you are using? Also, it is possible for you to create the gnu plots as Seb did?
Changed 3 years ago by gsamson
Changed 3 years ago by gsamson
comment:14 Changed 3 years ago by hadcv
I've run ORCA2_ICE_PISCES/LONG without key_top as Seb did, using the same compiler options and platform as Amy but for both attached and detached XIOS.
Elapsed times (sum over all processors) are:
| r4.0-HEAD | trunk | |
|---|---|---|
| Attached XIOS | 5225.509 | 9406.907 |
| Detached XIOS | 4761.515 | 7244.532 |
I have included timing for iom_put, which accounts for 2200-2300s of the increase in elapsed time when multiplied by the number of processors (32). Average times (per processor) are:
| r4.0-HEAD | trunk | |
|---|---|---|
| Attached XIOS | 23.4 (120032 calls) | 94.1 (149296 calls) |
| Detached XIOS | 7.0 (120032 calls) | 76.0 (149296 calls) |
dia_ptr does not appear in the r4.0-HEAD timings as here it is controlled by a namelist logical, which is .false. by default, instead of iom_use. This is another (11 x 32 = 352) seconds added to the trunk time.
This and the iom_put timing increase account for the difference in total elapsed time when using detached XIOS. There is still another ~1500s difference when using attached XIOS. This comes mainly from sbc, the average time per processor increasing by ~40s in this case, which is another (40 x 32 = 1280) seconds. Otherwise, there are some small increases in individual section times that could just be variation.
I suspect the array copies introduced by the halo changes Seb mentioned are the cause of the iom_put slowdown. I’ve no idea why sbc is much slower in the trunk when using attached XIOS, but this is only one run and might not be a robust result.
Changed 3 years ago by smasson
comment:15 Changed 3 years ago by smasson
Guillaume's plots
comment:16 Changed 3 years ago by smasson
Amys's plots
comment:17 Changed 3 years ago by smasson
some improvements by suppressing array copy in XIOS interface...
comment:18 Changed 3 years ago by hadcv
To include timings for iom_put, make the following changes in each routine in the iom_put interface (IOM/iom.F90):
-
(a) before vs. (b) after
a b 1 1 !!---------------------------------------------------------------------- 2 2 !! INTERFACE iom_put 3 3 !!---------------------------------------------------------------------- 4 4 SUBROUTINE iom_p0d_sp( cdname, pfield0d ) 5 5 CHARACTER(LEN=*), INTENT(in) :: cdname 6 6 REAL(sp) , INTENT(in) :: pfield0d 7 CALL timing_start('iom_put') 7 8 !! REAL(wp) , DIMENSION(jpi,jpj) :: zz ! masson 8 9 #if defined key_iomput 9 10 !!clem zz(:,:)=pfield0d 10 11 !!clem CALL xios_send_field(cdname, zz) 11 12 CALL xios_send_field(cdname, (/pfield0d/)) 12 13 #else 13 14 IF( .FALSE. ) WRITE(numout,*) cdname, pfield0d ! useless test to avoid compilation warnings 14 15 #endif 16 CALL timing_stop('iom_put') 15 17 END SUBROUTINE iom_p0d_sp
comment:19 Changed 3 years ago by smasson
Just for a test, we can also add a basic "had made" timing to make sure that the timing routine is effectively given the proper number...
-
(a) before vs. (b) after
a b 1 INCLUDE 'mpif.h' 1 2 2 3 ... 3 4 4 5 SUBROUTINE iom_p0d_dp( cdname, pfield0d ) 5 6 CHARACTER(LEN=*), INTENT(in) :: cdname 6 7 REAL(dp) , INTENT(in) :: pfield0d 8 REAL(wp) :: ztime 9 CALL timing_start('iom_put') 10 ztime = MPI_Wtime() 7 11 !! REAL(wp) , DIMENSION(jpi,jpj) :: zz ! masson 8 12 #if defined key_iomput 9 13 !!clem zz(:,:)=pfield0d 10 14 #else 11 15 IF( .FALSE. ) WRITE(numout,*) cdname, pfield0d ! useless test to avoid compilation warnings 12 16 #endif 17 IF( lwp .AND. ln_timing ) WRITE(numtime,*) 'timing iom_put ', MPI_Wtime() - ztime 18 CALL timing_stop('iom_put') 13 19 END SUBROUTINE iom_p0d_dp
defining timeall = 0 somewhere in dom_oce for example, we can cumulate it and print it only in nemogcm once we exit the step loop.
This solution is better as we could get the value fore each core (it might be quite different...).
-
(a) before vs. (b) after
a b 1 timeall = timeall + MPI_Wtime() - ztime 2 CALL timing_stop('iom_put') 1 3 END SUBROUTINE iom_p0d_dp
Changed 3 years ago by smasson
Changed 3 years ago by smasson
comment:20 Changed 3 years ago by smasson
Good news, with the new iom_put interface (no array copy in NEMO) and without diaptr files in the trunk (as in the r4.0-HEAD), we get the same results.
Could you test the new iom.F90 file and confirm this result?
Change are small:
1) cleaning of 6 interfaces, for example:
-
(a) before vs. (b) after
a b 1 IF( SIZE(pfield2d, dim=1) == jpi .AND. SIZE(pfield2d, dim=2) == jpj ) THEN 2 CALL xios_send_field( cdname, pfield2d(Nis0:Nie0, Njs0:Nje0) ) ! this extraction will create a copy of pfield2d 3 ELSE 4 CALL xios_send_field( cdname, pfield2d ) 5 ENDIF 1 CALL xios_send_field( cdname, pfield2d )
2) the redefinition of the data domain in iom interface so we can send the whole domain to XIOS and XIOS itself will extrate the appropriate values.
-
(a) before vs. (b) after
a b 1 CALL iom_set_domain_attr("grid_"//cdgrd, data_dim=2, data_ibegin = 0, data_ni = Ni_0, data_jbegin = 0, data_nj = Nj_0)1 CALL iom_set_domain_attr("grid_"//cdgrd, data_dim=2, data_ibegin = -nn_hls, data_ni = jpi, data_jbegin = -nn_hls, data_nj = jpj) 2 2 3 3 ... 4 4 5 CALL iom_set_domain_attr("gznl", data_dim=2, data_ibegin = 0, data_ni = Ni_0, data_jbegin = 0, data_nj = Nj_0)5 CALL iom_set_domain_attr("gznl", data_dim=2, data_ibegin = -nn_hls, data_ni = jpi, data_jbegin = -nn_hls, data_nj = jpj)
I need to check if this is working in debug mode as we may send non-initialized values to XIOS (that won(t be used)...
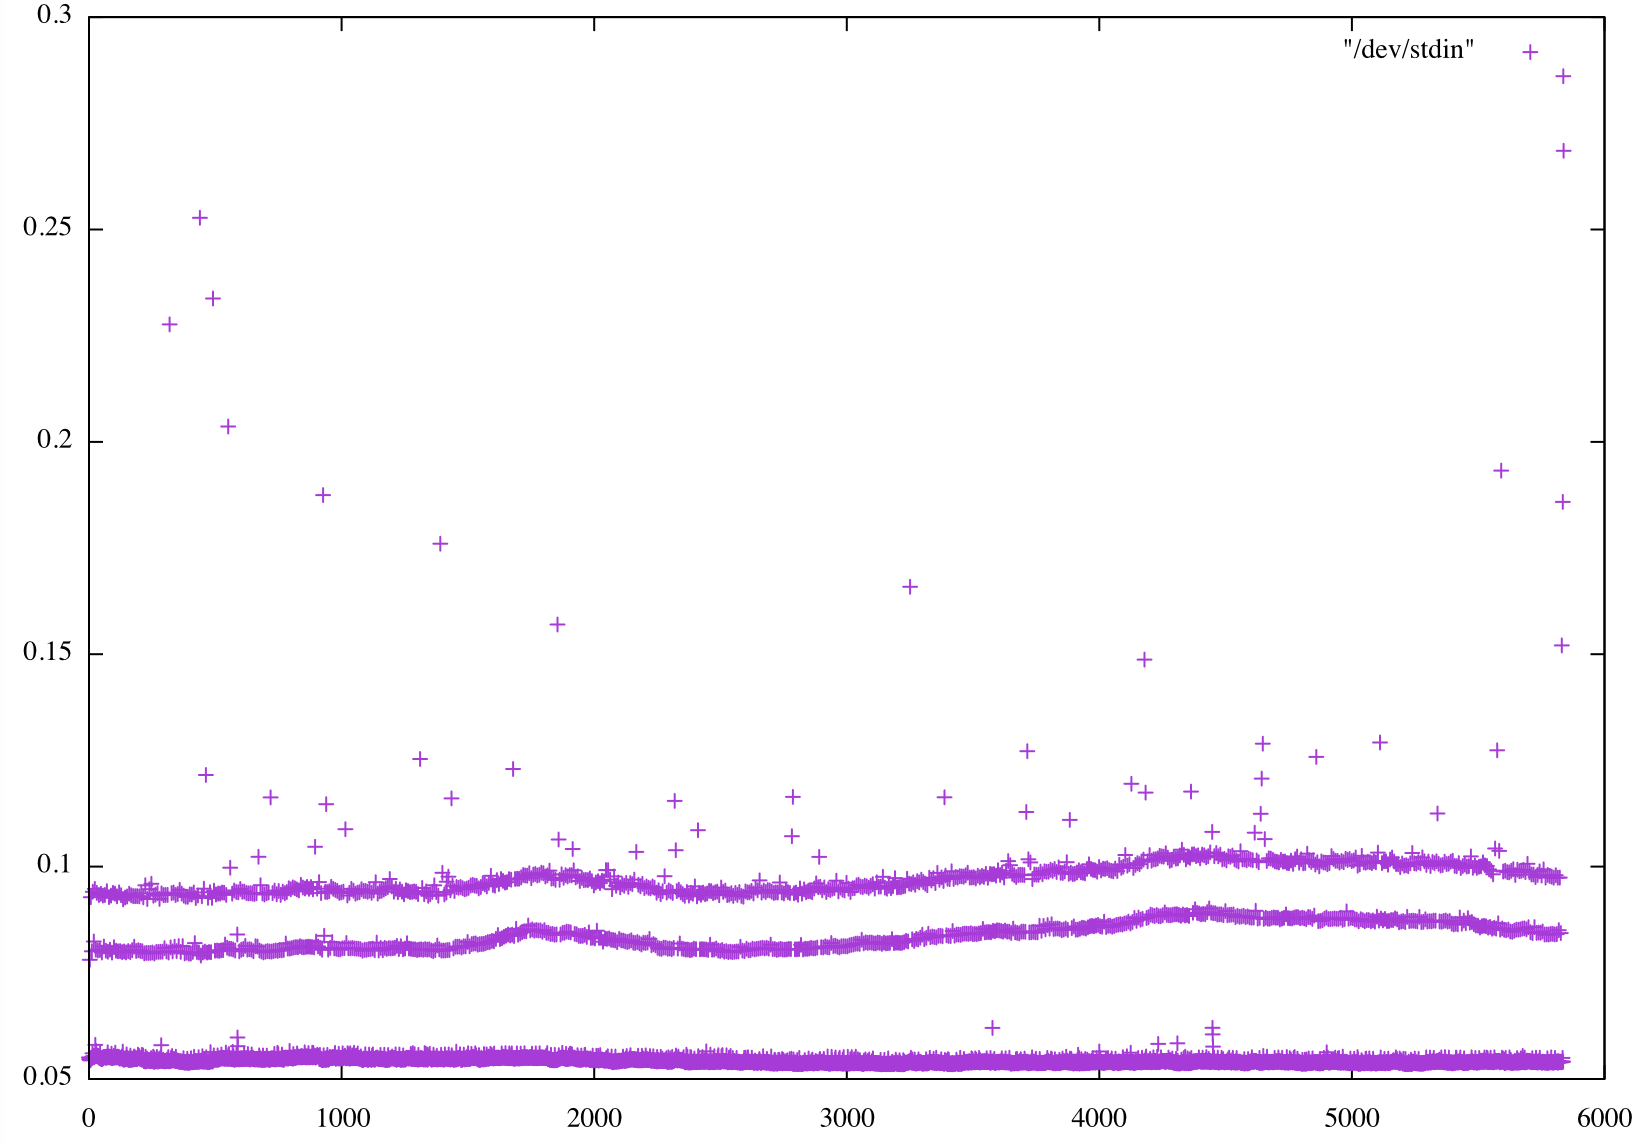
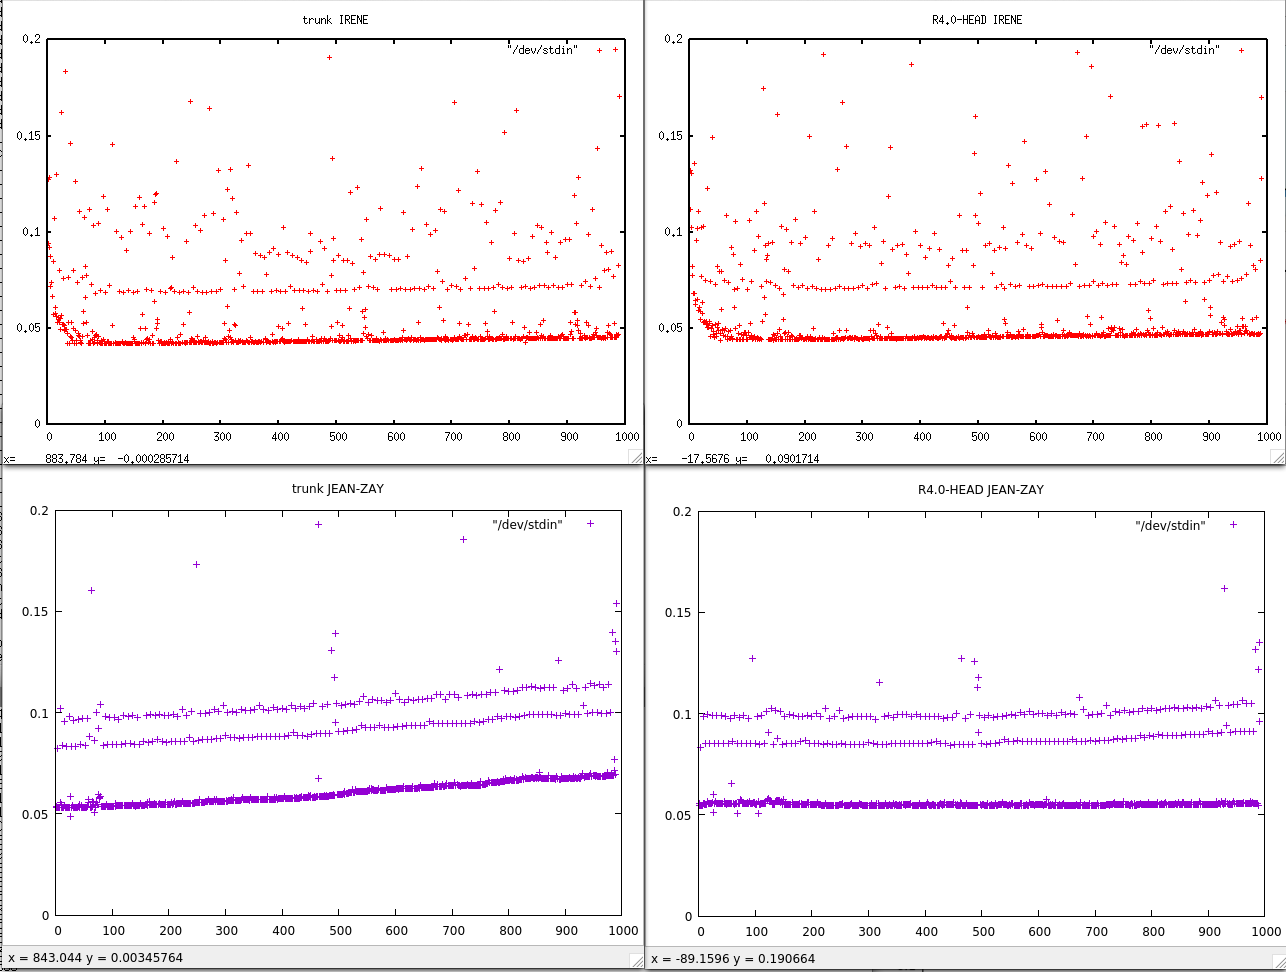
Bad news, the drift is there even on Irene, if we look carefully. There is the same plot as above but with reduced yrange...
At least the problem was already there in r4.0-HEAD...
I remember similar problem have been found in previous versions of the code. It was related to XIOS but according to Yann Meurdesoif, the problem was in fact a small memory leak in NetCDF itself, not in XIOS... If I remember correctly, Jean-Marc Molines shown at that time that the trend was rested to 0 every time the NetCDF file was closed an a new one opened.
-> should be tested again...
Changed 3 years ago by smasson
comment:21 Changed 3 years ago by smasson
Amazing (or quite scarry) to see how the same test differs on different machines...
I get this test by running the LONG run of ORCA2_ICE_PICES
- with the iom.F90 attached in this ticket
- compiled without key_top
- ln_timing = .true. in namelist_cfg
- I supressed all the 1mo file group in file_def_nemo-oce.xml:
<file_group id="1m" output_freq="1mo" output_level="10" enabled=".TRUE."> <!-- real monthly files -->
...
</file_group>
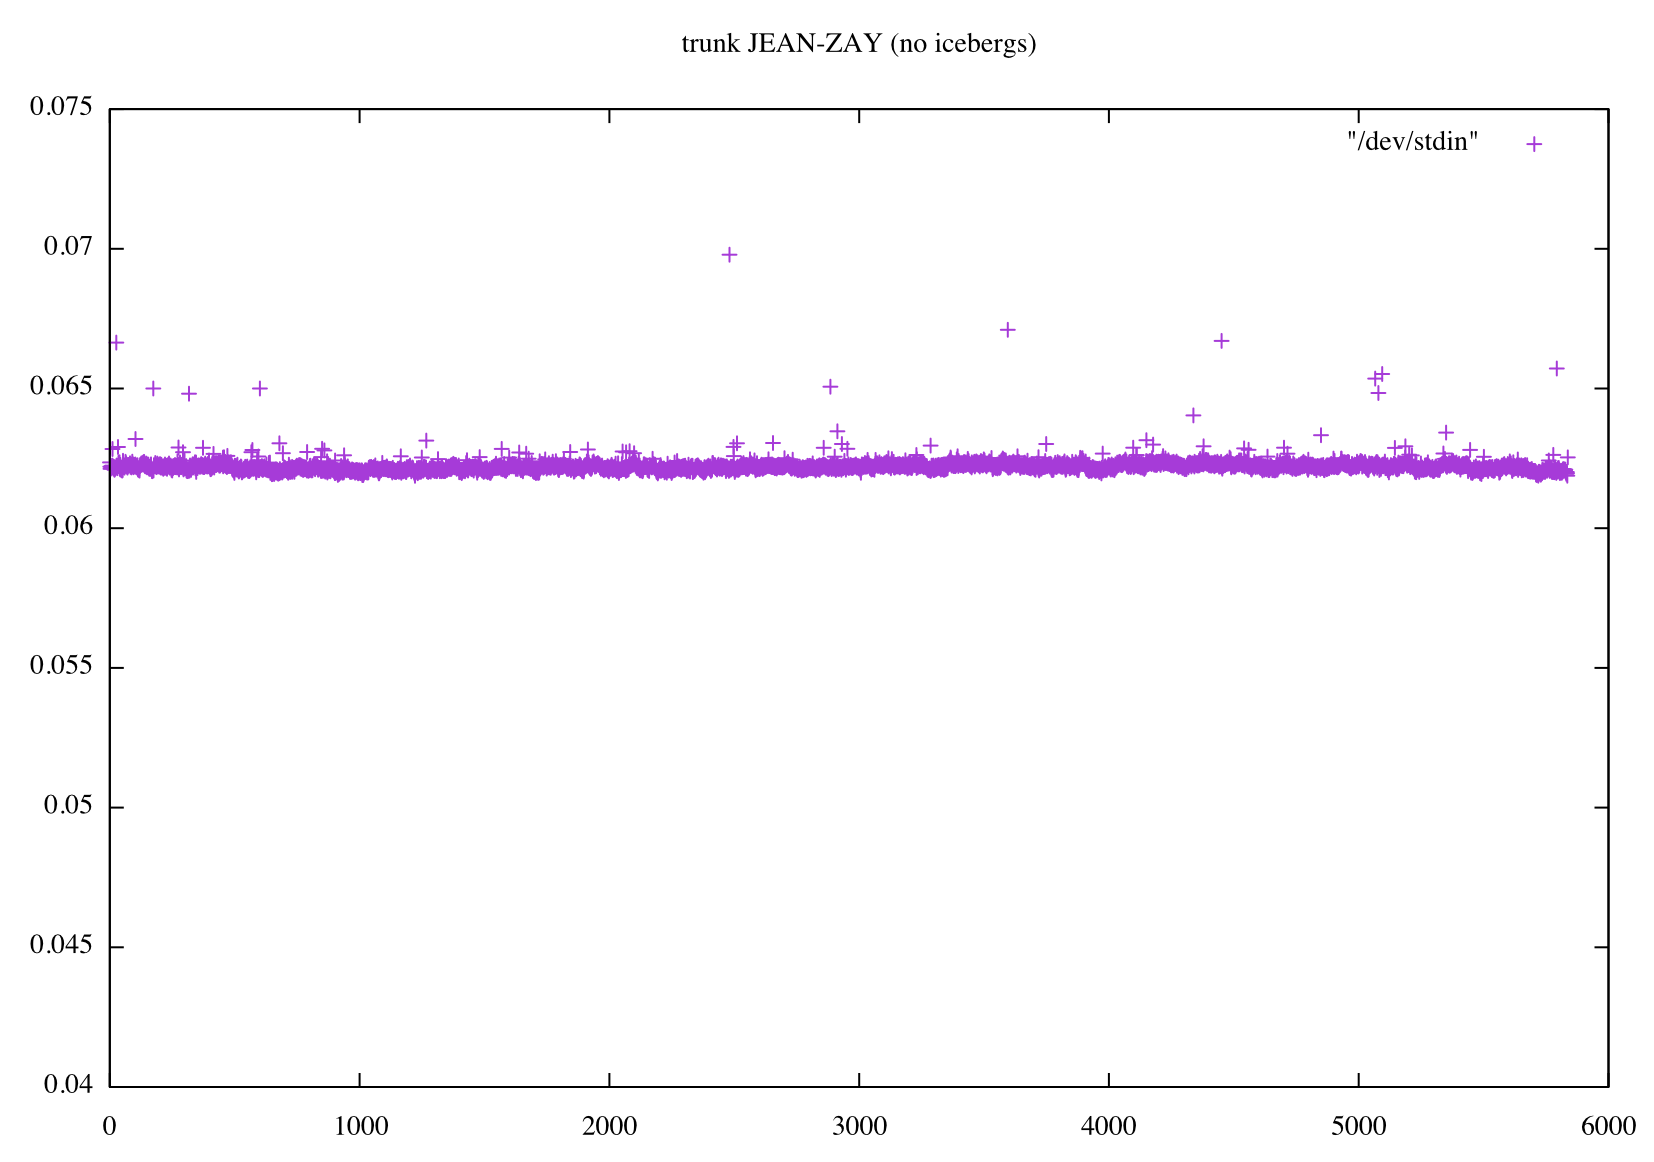
- I get the plot, for example, with this command:
grep " timing step" timing.output | sed -e "s/.*: *//" | gnuplot -p -e 'set yrange [0.04:0.075] ; set title "trunk JEAN-ZAY" ; plot "/dev/stdin"'
On JEAN-ZAY:
- I use 1 full node of 40 cores
- ifort (IFORT) 19.0.4.243 20190416
- netcdf-c/4.7.2-mpi, netcdf-fortran/4.5.2-mpi, hdf5/1.10.5-mpi
On IRENE:
- I use 1 full node of 48 cores
- ifort (IFORT) 17.0.6 20171215
- netcdf-c/4.6.0, netcdf-fortran/4.4.4, hdf5/1.8.20
comment:22 Changed 3 years ago by smasson
A new test on IRENE, but changing compiler version :
ifort (IFORT) 19.0.5.281 20190815 instead of ifort (IFORT) 17.0.6 20171215 in comment 20
same versions of the NetCDF, HFD and XIOS libraries (but compiled with intel 19 instead of 17).
Changed 3 years ago by francesca
Changed 3 years ago by francesca
Changed 3 years ago by francesca
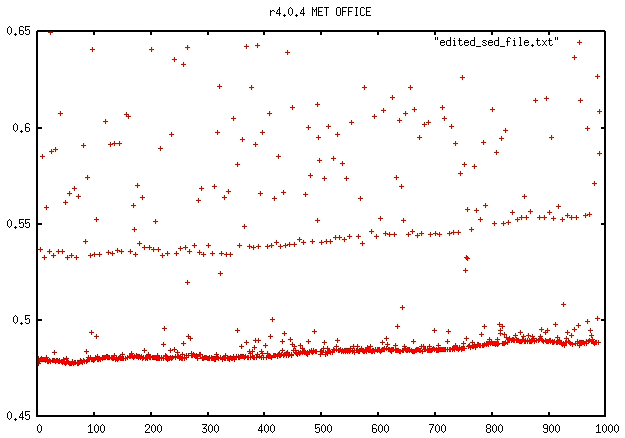
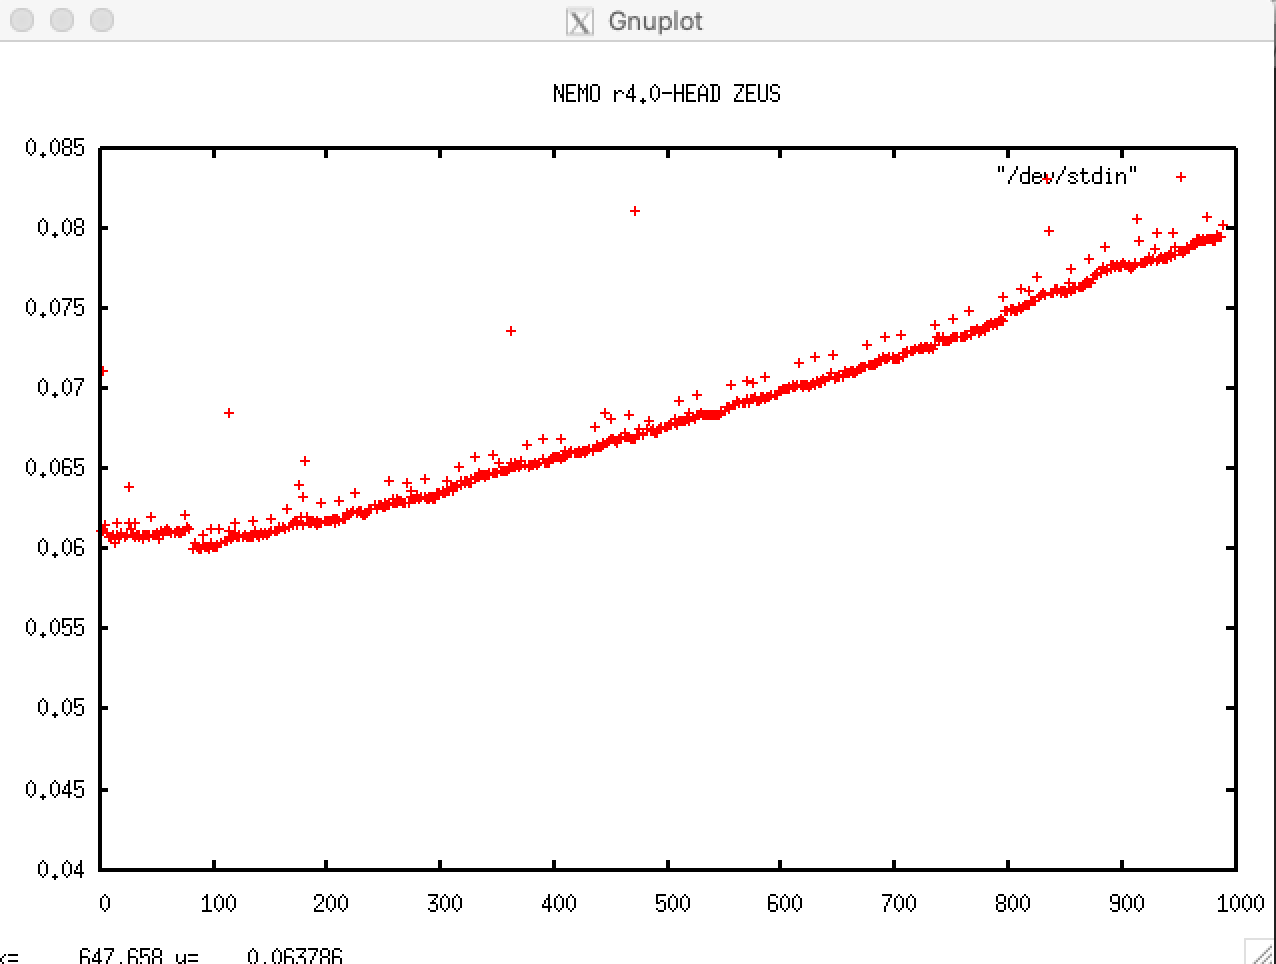
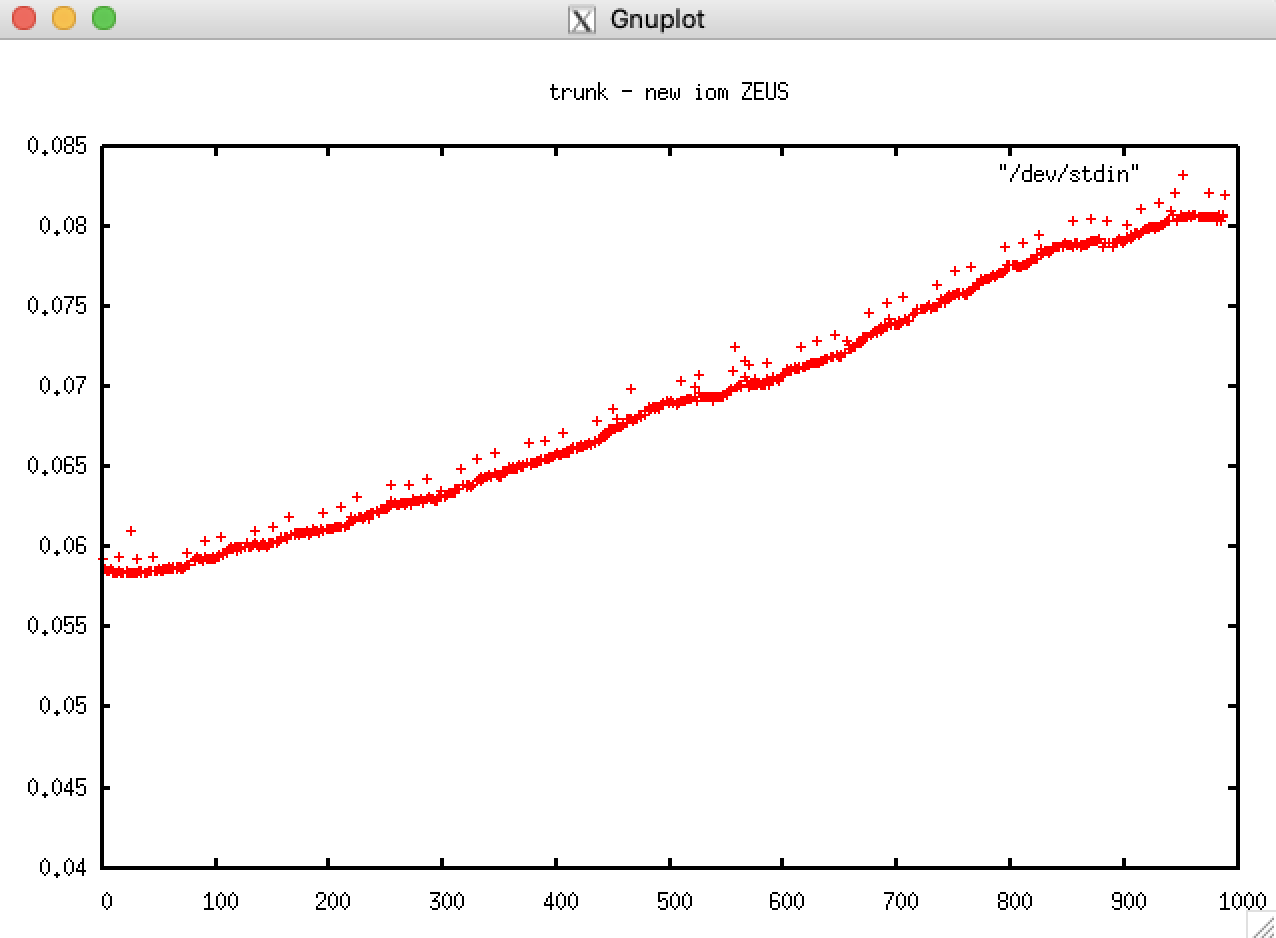
comment:23 Changed 3 years ago by francesca
Following Seb comment n21, I did the test on ZEUS CMCC machine comparing:
trunk with original iom.F90 file, trunk with the modified iom.F90 attached in the ticket and NEMO r4.0-head


- I use 1 full node of 36 cores
- ifort (IFORT) 19.0.5.281 20190815
- hdf5 1.10.5, parallel-netcdf 1.12.0, netCDF 4.7.2
- XIOS attached mode
- LONG run of ORCA2_ICE_PICES ( jpni=4, jpnj=8)
- compilation without key_top
- ln_timing = .true. in namelist_cfg
- supression all the 1mo file group in file_def_nemo-oce.xml
Changed 3 years ago by smasson
Changed 3 years ago by smasson
Changed 3 years ago by smasson
Changed 3 years ago by smasson
comment:24 Changed 3 years ago by hadcv
As for Seb/Francesca? except:
- Met Office Cray XC40
- 1 full node of 32 cores
- ifort 18.0.5 20180823
- hdf5 1.8.13
- netcdf*_parallel 4.3.2
Elapsed times (sum over all processors) are now:
| r4.0-HEAD | trunk | |
|---|---|---|
| Attached XIOS | 5414.736 | 4910.816 |
| Detached XIOS | 4663.086 | 4253.107 |
So the trunk now appears to be faster.
comment:25 Changed 3 years ago by acc
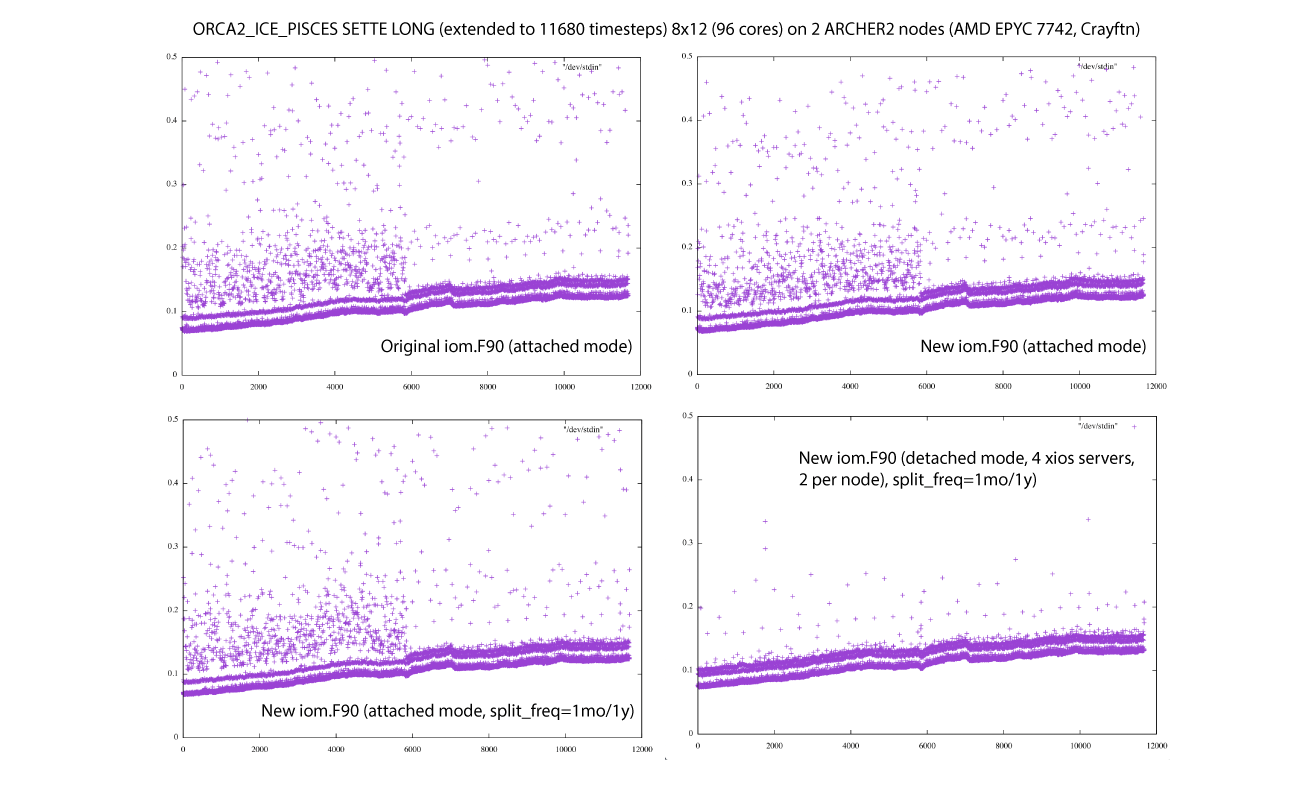
Here is a late response because I've been battling to get going on a new machine (NEMO not at fault!). I see the same pattern but no change with the update to iom.F90 or setting a split_freq to reset the files (at monthly intervals for 5d/1mo and yearly for 1y). The only significant change is in the scatter which is greatly reduced in detached mode. One caveat: I've got optimisation dialled down to -O1 because of issues with the new compiler. One observation is that the rate of increase seems to level off in the third quarter of each year (these are two year runs). Everything is standard SETTE (inc. PISCES), just the domain decomposition and nn_stock changed.

Changed 3 years ago by acc
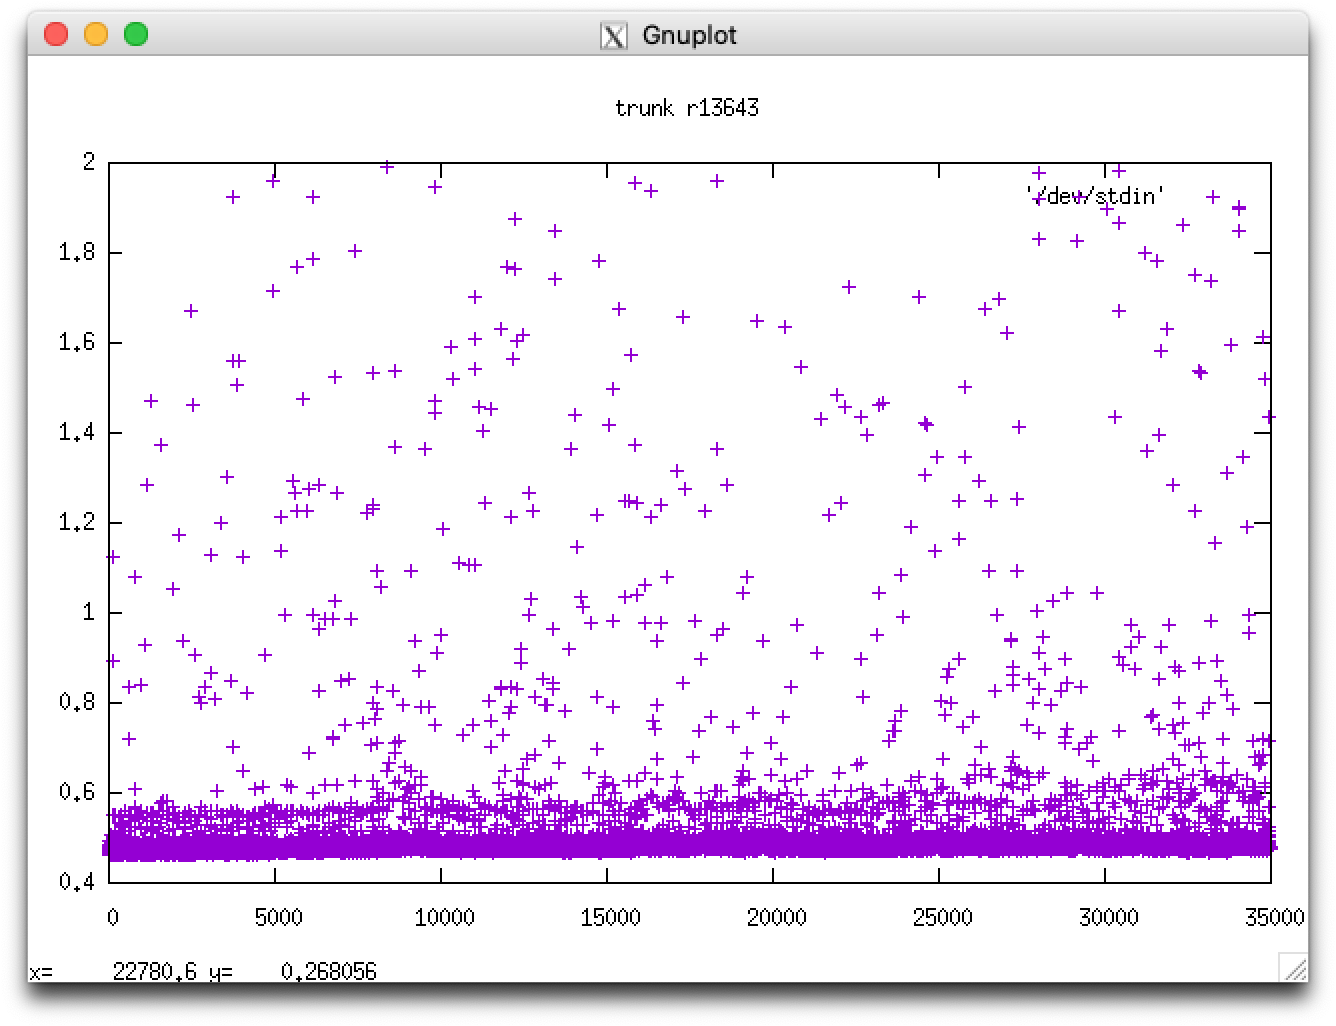
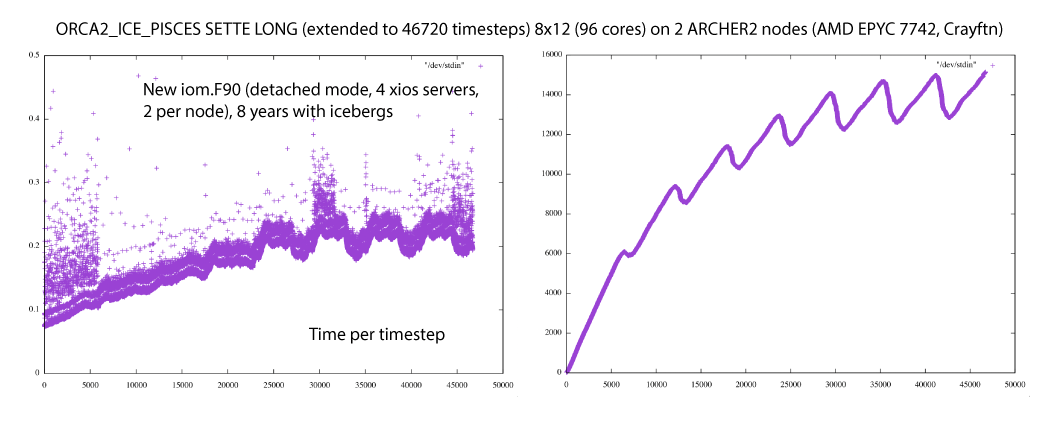
comment:26 Changed 3 years ago by acc
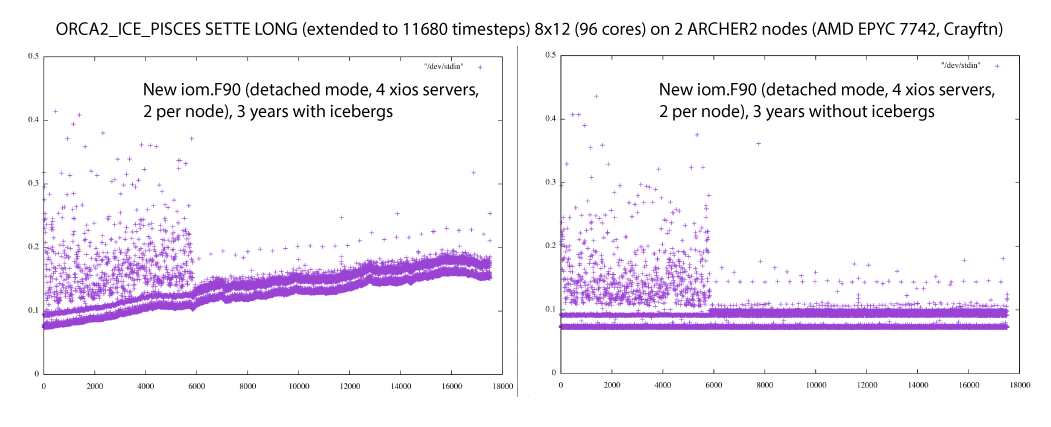
It is the icebergs. At least in my case; these plots show times for two 3 year runs (caption should read 17520 timesteps): the first with ln_icebergs=.true. the second with ln_icebergs=.false.:

I guess it makes sense that we create more icebergs as the run progresses but perhaps we need to check that they are disappearing cleanly and in a timely fashion? There doesn't seem to be much evidence of reaching saturation. The increased scatter in year 1 is puzzling too but perhaps I'm expecting too much of the original SETTE setup? (i.e. running out of surface forcing data?). Or maybe its all in a file cache somewhere in this new system's memory for year's 2 and 3?
comment:27 Changed 3 years ago by clem
I concur with Andrew. Icebergs seem to be the issue. I did not have to change iom.F90 to flatten the curve on Jean-Zay

comment:28 Changed 3 years ago by smasson
So it is simply climate change? Ice shelf is melting and we have more and more icebergs (that are never completely melting)? ;-)
I agree that the change in the scatter between yr 1 and 2 is also quite strange...
comment:29 Changed 3 years ago by smasson
In 13747:
Changed 3 years ago by acc
comment:30 Changed 3 years ago by acc
Another test; this time with the total number of icebergs added to run.stat.nc (see attached version of stpctl.F90). Plots of time per timestep and total number of icebergs for a 4 year run are here:

Icebergs numbers are still rising after 4 years with the effect of doubling the time taken per timestep. The numbers may be levelling off and are not montonically increasing but still creating more than are decaying each year.
Changed 3 years ago by acc
comment:31 Changed 3 years ago by acc
Some good news: the iceberg numbers do eventually level off:

comment:32 Changed 3 years ago by smasson
OK. As Clément, I confirm your results.
We now have the explanation for the slow down of the model time step...
Should we close the ticket?
... and open new tickets to for the following points:
- Do we really expect to have 14 000 icebergs in ORCA2? Which number is acceptable at this resolution?
- Do we accept that, at some point, we spend half of the computing time (including sea-ice and pisces) dealing with icebergs?
- Maybe real "HPC" progress would be achieved by simply working on icebergs and on some other routines such as diaprt (see #2559)... ;-)
comment:33 Changed 3 years ago by acc
This ticket should probably be closed. The issue needs further investigation though (yet more for the workplan). Is starting calving with a stationary ocean part of the problem? Would we end up with fewer icebergs if we allowed the circulation to spin-up first?
comment:34 Changed 3 years ago by mathiot
Comments about the points mentioned above:
- It takes about 10 years for the icebergs to spin up (ie calving of icebergs balanced by icebergs melt) (Merino et al. 2016).
- Yes for a realistic calving, simulation should start from a former iceberg restart (an option to do so while starting from T/S climatology from rest will be nice)
- The number of icebergs probably does not depends of the resolution but of your amount of ice you calve in the ocean, ie your input file (source of icebergs) and the amount of melt (ACC surface temperature) (sink of icebergs)
- Icebergs will benefit from the extra halo because as it is now, we duplicate at each time step some variables (ssh, sst, sss, ssu, ssv, ice conc, ice thickness, scale factor and maybe some others) to simply add an extra halo (which will be useless if we use the full potential of the extra halo code).
- Same operations are done multiple times or some operation are done but not used (see ticket #2494 and #2375)
- About the cost, the smaller it is the better but, if some user found it to expensive for the benefit and if they really need a realistic pattern of iceberg melts, some climatologies are available to represent the effect of the icebergs (this option has been used by IPSL for CMIP6 I think). See Merino et al. 2016 for details on these climatologies.
- The ratio cost of the iceberg vs cost of the ocean+sea-ice really depend of your resolution. Cost of the iceberg depends of the total amount of iceberg you calve (probably constant across resolution) and cost of NEMO depend on the resolution of your grid. So the ration cost of iceberg / cost of the ocean probably will go down when you are at higher resolution (it is a feeling, I didn't do a test).
comment:35 Changed 3 years ago by smasson
- Resolution set to fixed
- Status changed from new to closed
In GYRE tests, I placed timing calls inside the iom_put subroutines and found that these accounted for more than half of the total run time. Without these timing calls, this time is included in the other timing sections. I found that most of the dia_ptr time was spent in iom_put.
Since iom_put time is really just the time spent in XIOS, I wonder if your results could be indicating a slow down of XIOS? Are you using consistent XIOS libraries in your trunk and 4.0-HEAD runs?