| Version 1 (modified by peylin, 9 years ago) (diff) |
|---|
Page describing on-going effort to clarify the calculation of roughness length in ORCHIDEE and investigate/solve the biais in bare soil evaporation
Testing roughness length for heat in LMDZOR
01-Sep-2015 by Fuxing WANG, Frederique CHERUY.
Background:
The roughness length for heat (z0h) is generally not identical to roughness length for momentum (z0m).
In LMDZOR, z0h = z0m. A short description of related code is (only in coupled mode): https://forge.ipsl.jussieu.fr/orchidee/attachment/wiki/Meetings/CMIP6/Physic/condveg_z0cdrag.pdf
Objective:
To test the sensitively of LMDZOR to z0h.
Simulations:
Two simulations (1-year) were done with LMDZOR after 20 years spin-up.
(1) CTL: z0h = z0m; ORCHIDEE-rev 2664, LMDZ-rev 2287; new soil vertical discretization and soil thermodynamics
(2) EXP: The same as CTL, but z0h = 0.1 * z0m.
Results:
Results are compared over different seasons (annual mean, JJA and DJF): https://forge.ipsl.jussieu.fr/orchidee/attachment/wiki/Meetings/CMIP6/Physic/z0mh_annual_jja_djf.pdf.
The left side in the figures is "CTL: z0h = z0m", the right side is the 'EXP-CTL' (except the last row which is the " EXP/CTL").
The Ts (temp_sol) increases over most regions. The maximum increase is over 0N-90N in JJA (1-2K), while it is over 30N-60S in DJF (0.5-1.5K).(Fig b)
The pattern of fluxsens is similar for different seasons. It increases over most regions (3 W/m2 for most regions).
The variation of fluxlat (+/- 6 W/m2 over most regions) and precipitation (+/-0.5mm/d over most regions) is less systematic than Ts and fluxsens.
Attachments (11)
-
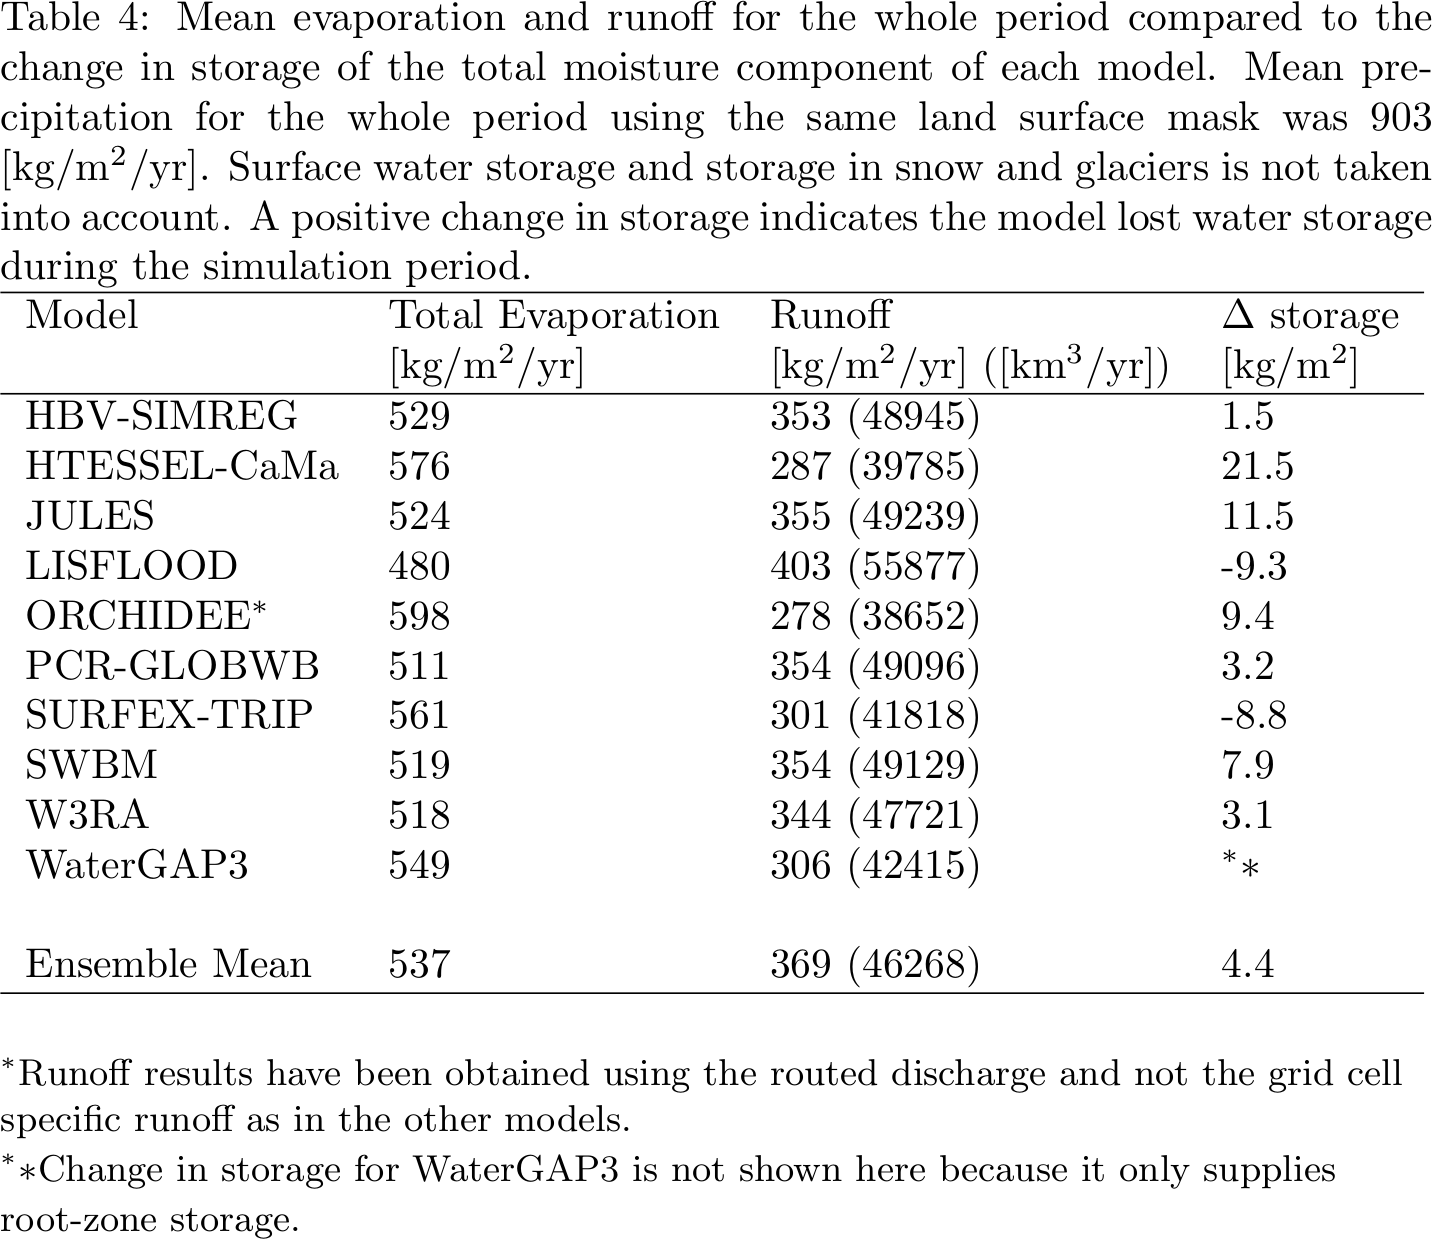
Table3.png
(230.1 KB) -
added by jpolcher 9 years ago.
Table 3 of Schellekens et al.
-
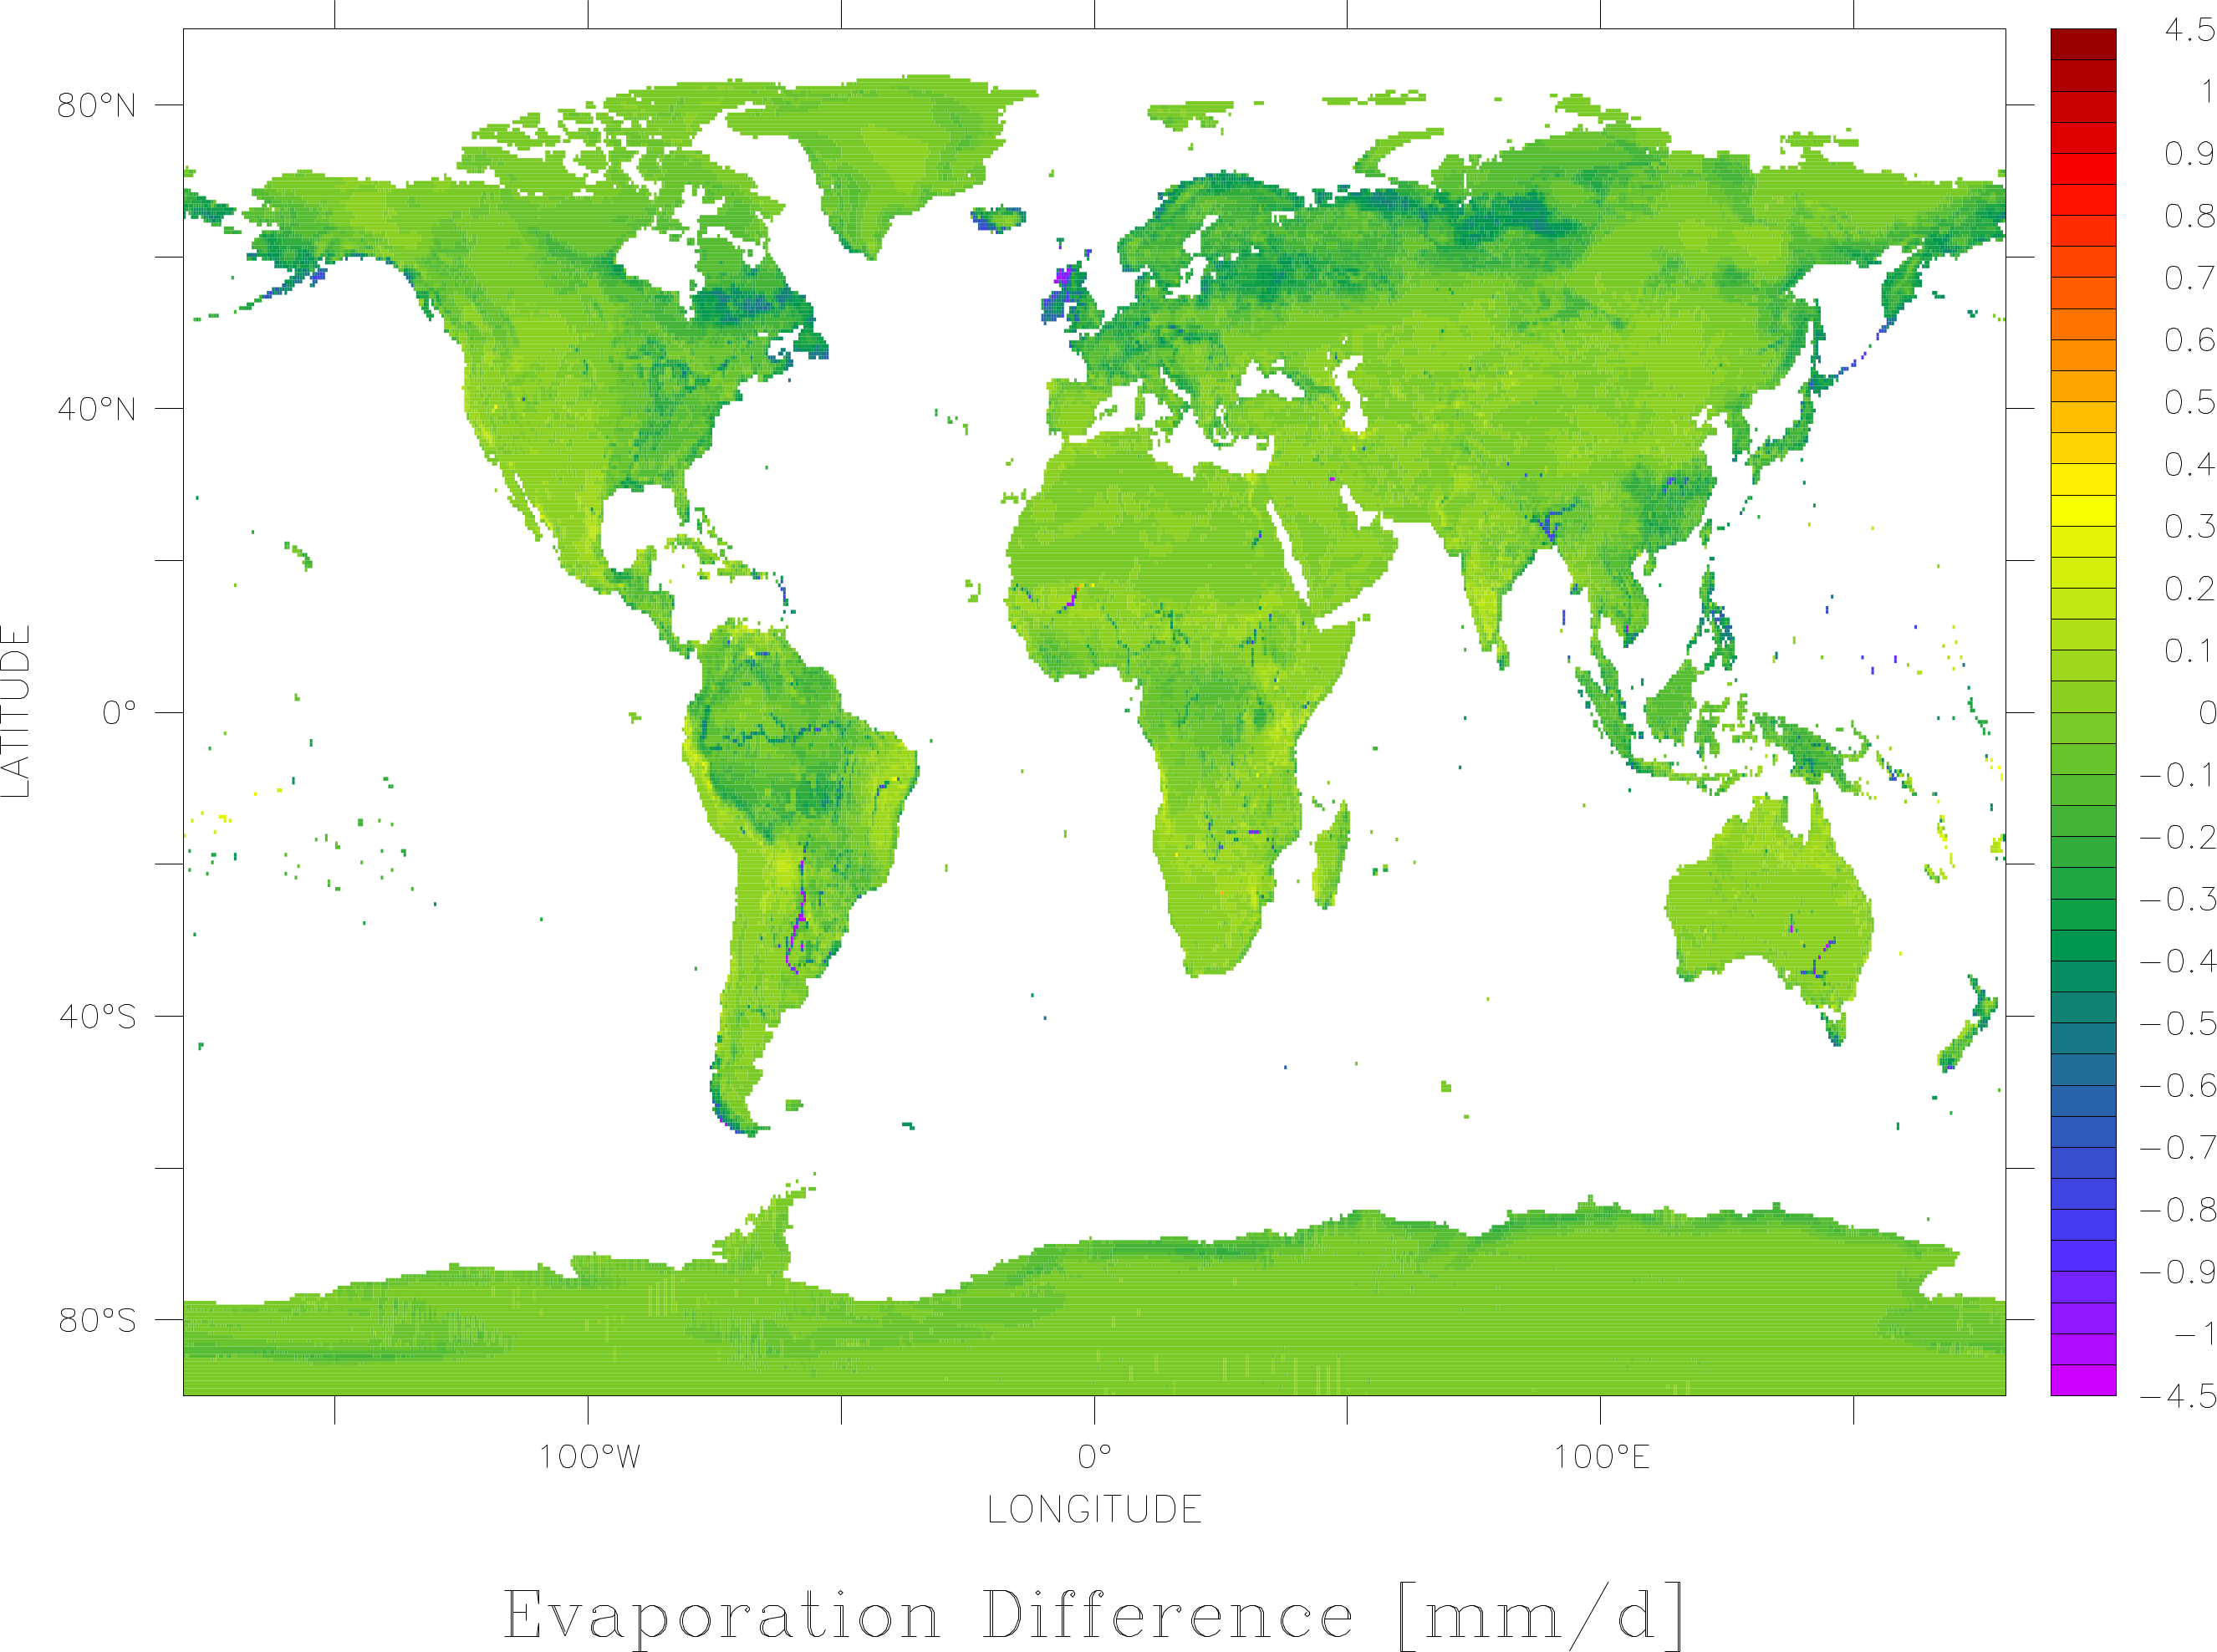
Evap_Diff.png
(568.0 KB) -
added by jpolcher 9 years ago.
Evaporation Difference over full period (1979-2012)
-
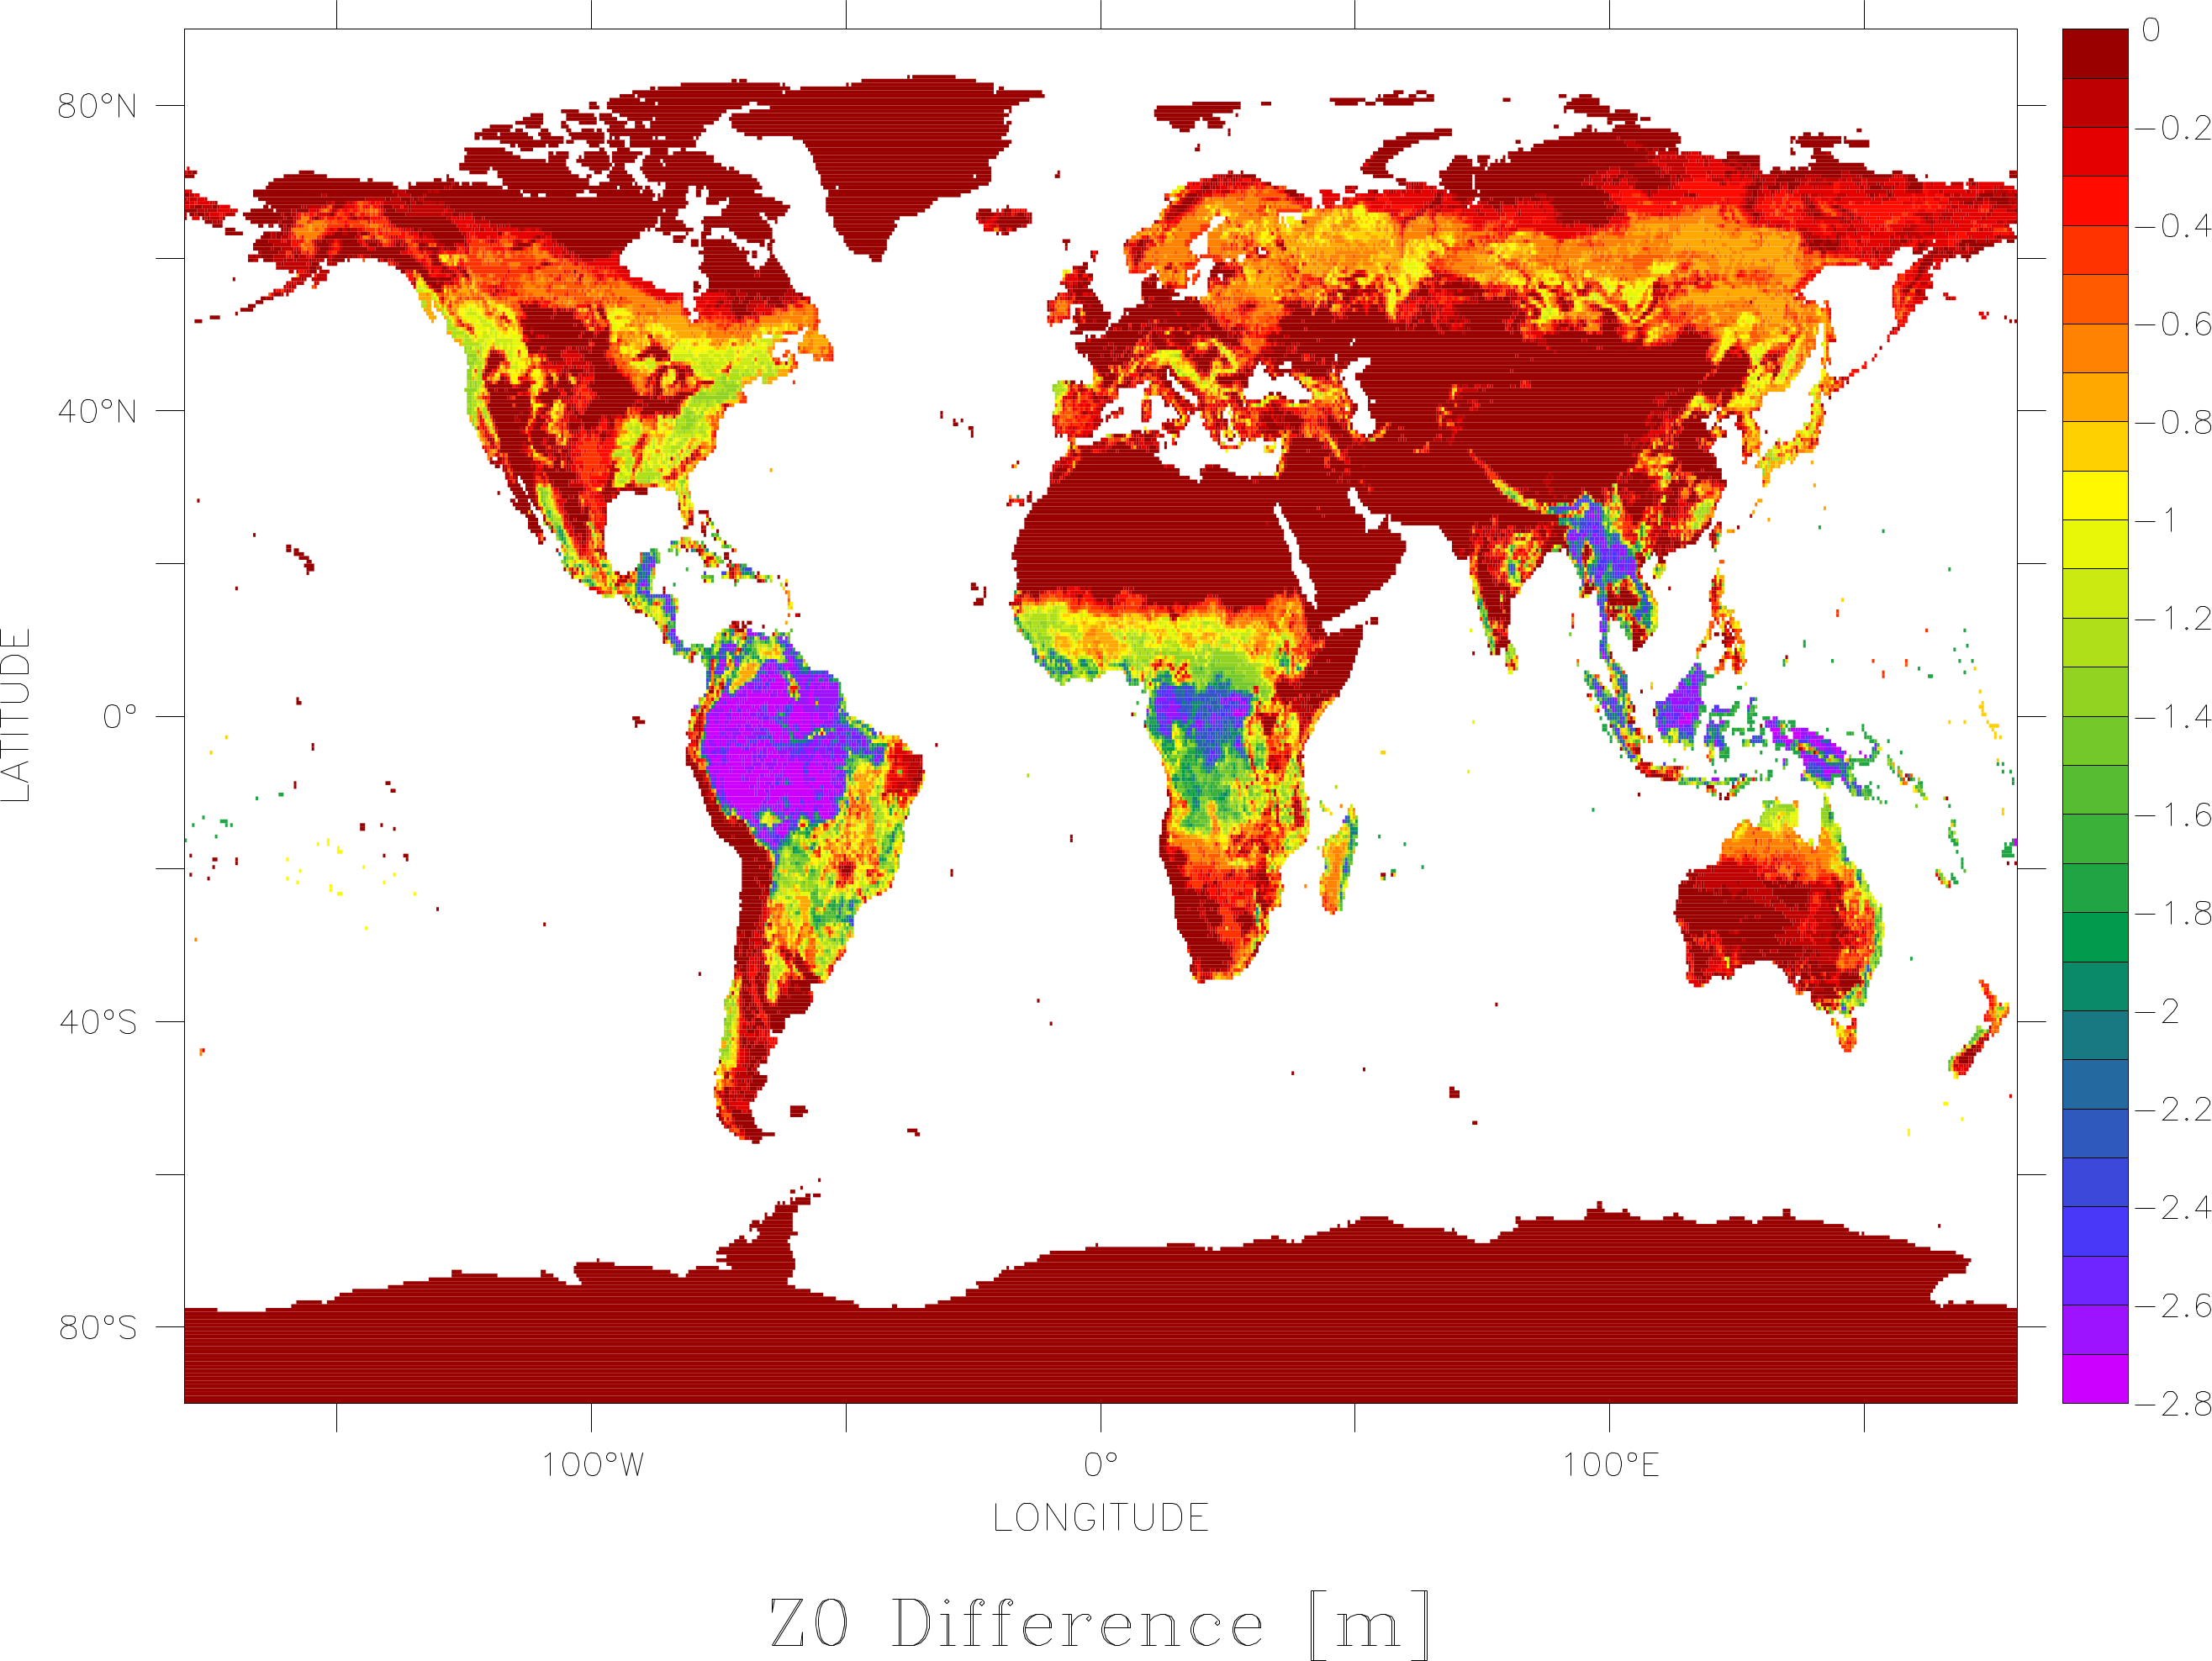
Z0_Diff.png
(536.4 KB) -
added by jpolcher 9 years ago.
Difference map for Z0
-
Table3_B.png
(230.1 KB) -
added by jpolcher 9 years ago.
Revised version of the Schellekens et al. paper
-
Z0_Diff_B.png
(536.4 KB) -
added by jpolcher 9 years ago.
Z0 Differences over the full period of simulation.
-
Evap_Diff_B.png
(568.0 KB) -
added by jpolcher 9 years ago.
Evaporation changes following the Z0/10 change for the period 1979-2012.
- z0mh_SU.pdf (2.8 MB) - added by fwang 8 years ago.
- z0mh_s01_mh_january.pdf (2.4 MB) - added by fwang 8 years ago.
-
su_2001.pdf
(592.4 KB) -
added by nvuilsce 8 years ago.
Su_2001
-
ershadietal2015.pdf
(1.1 MB) -
added by nvuilsce 8 years ago.
Ershadi_2015
-
averaging_z0.xlsx
(33.2 KB) -
added by nvuilsce 8 years ago.
How to compute the mean z0 over grid cells